. 2013 Sep 6;1(1):19.
doi: 10.1186/2049-3002-1-19.

Quinoline 3-sulfonamides inhibit lactate dehydrogenase A and reverse aerobic glycolysis in cancer cells

Affiliations

Quinoline 3-sulfonamides inhibit lactate dehydrogenase A and reverse aerobic glycolysis in cancer cells

Julia Billiard et al. Cancer Metab. .

Abstract

Background: Most normal cells in the presence of oxygen utilize glucose for mitochondrial oxidative phosphorylation. In contrast, many cancer cells rapidly convert glucose to lactate in the cytosol, a process termed aerobic glycolysis. This glycolytic phenotype is enabled by lactate dehydrogenase (LDH), which catalyzes the inter-conversion of pyruvate and lactate. The purpose of this study was to identify and characterize potent and selective inhibitors of LDHA.

Methods: High throughput screening and lead optimization were used to generate inhibitors of LDHA enzymatic activity. Effects of these inhibitors on metabolism were evaluated using cell-based lactate production, oxygen consumption, and 13C NMR spectroscopy assays. Changes in comprehensive metabolic profile, cell proliferation, and apoptosis were assessed upon compound treatment.

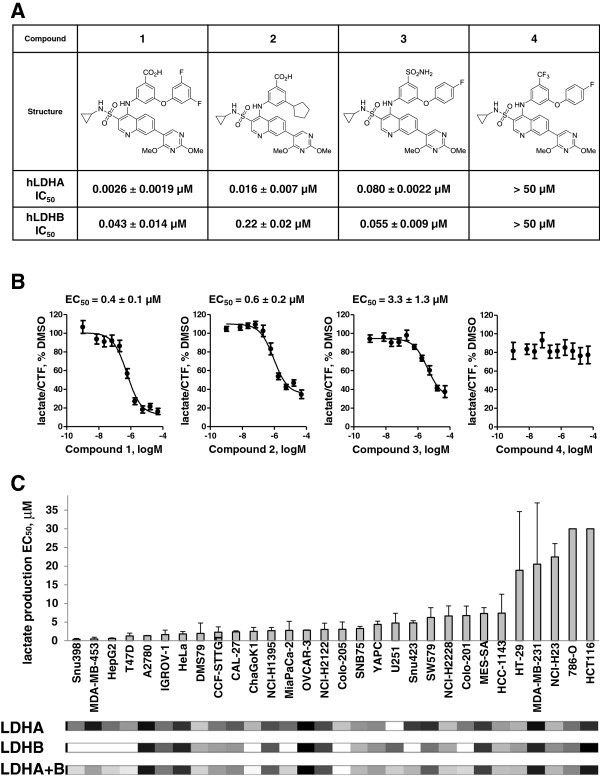
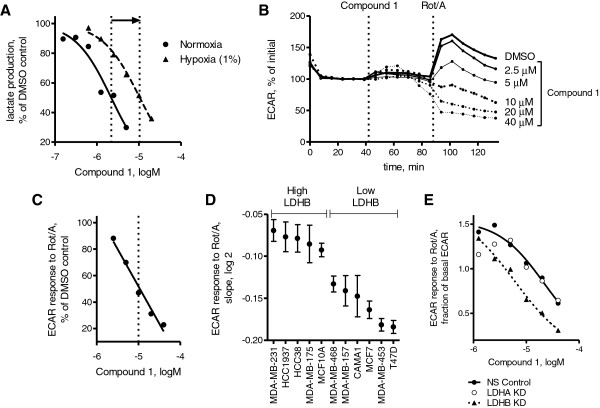
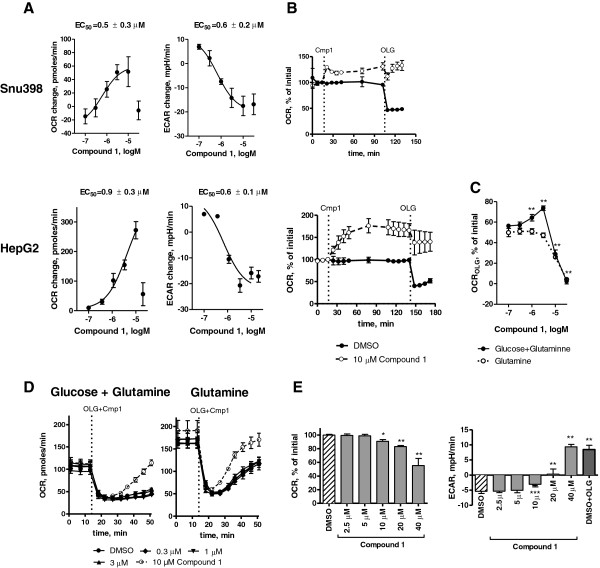
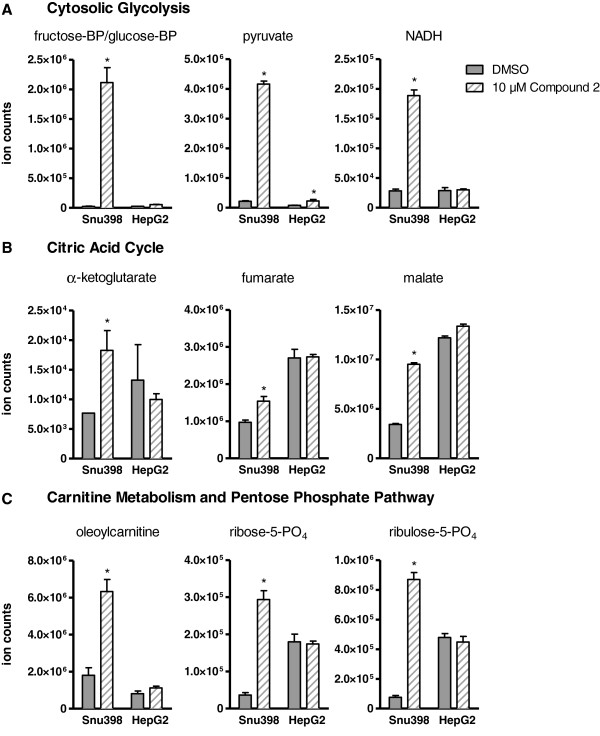
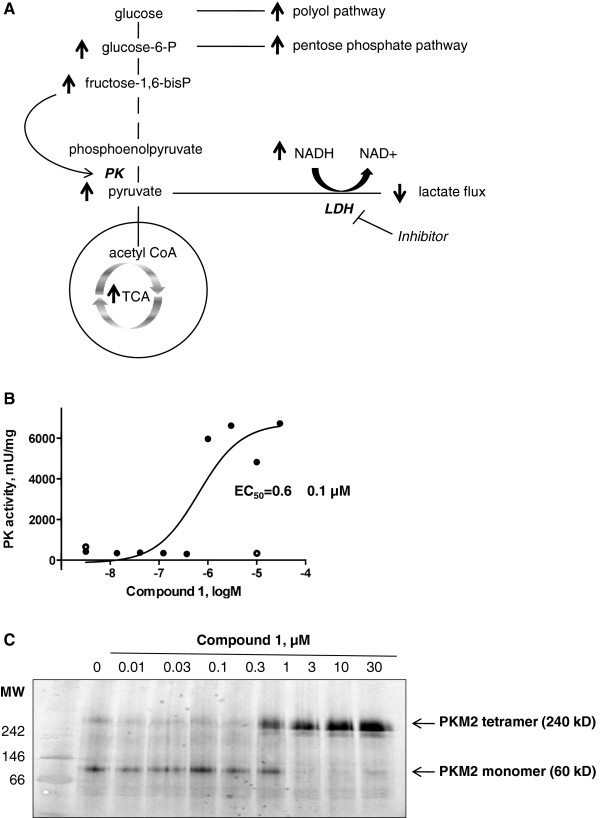
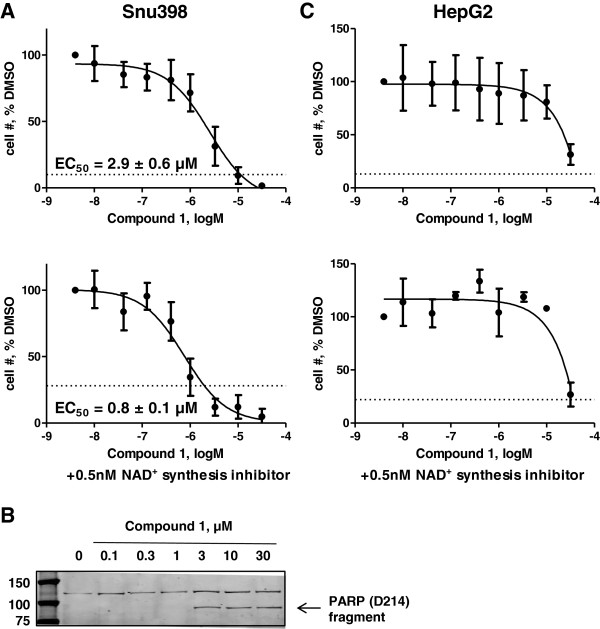
Results: 3-((3-carbamoyl-7-(3,5-dimethylisoxazol-4-yl)-6-methoxyquinolin-4-yl) amino) benzoic acid was identified as an NADH-competitive LDHA inhibitor. Lead optimization yielded molecules with LDHA inhibitory potencies as low as 2 nM and 10 to 80-fold selectivity over LDHB. Molecules in this family rapidly and profoundly inhibited lactate production rates in multiple cancer cell lines including hepatocellular and breast carcinomas. Consistent with selective inhibition of LDHA, the most sensitive breast cancer cell lines to lactate inhibition in hypoxic conditions were cells with low expression of LDHB. Our inhibitors increased rates of oxygen consumption in hepatocellular carcinoma cells at doses up to 3 microM, while higher concentrations directly inhibited mitochondrial function. Analysis of more than 500 metabolites upon LDHA inhibition in Snu398 cells revealed that intracellular concentrations of glycolysis and citric acid cycle intermediates were increased, consistent with enhanced Krebs cycle activity and blockage of cytosolic glycolysis. Treatment with these compounds also potentiated PKM2 activity and promoted apoptosis in Snu398 cells.

Conclusions: Rapid chemical inhibition of LDHA by these quinoline 3-sulfonamids led to profound metabolic alterations and impaired cell survival in carcinoma cells making it a compelling strategy for treating solid tumors that rely on aerobic glycolysis for survival.


Figures

Figure 1
Figure 1
Quinoline 3-sulfonamides inhibit lactate dehydrogenase A (LDHA) and reduce lactate production in cancer cells. (A) Structures of the LDHA inhibitors and their potency on recombinant human LDH enzymes. (B) Potent LDHA inhibitors (Compounds 1 to 3) inhibit lactate production in Snu398 hepatocellular carcinoma cells whereas an analog that does not have LDHA inhibitory activity (Compound 4) does not affect cellular lactate. Lactate concentration in the conditioned medium was normalized to cell viability assessed by CellTiter Fluor™ assay (CTF), and the lactate/CTF ratio obtained in dimethyl sulfoxide -treated cells was set at 100%. Data are means ± standard error (SE) of at least five independent experiments with two replicates each. Half maximal effective concentrations (EC50) are means ± SE of at least five independent experiments. (C) Cancer cell lines exhibit different sensitivity to LDHA inhibition. Thirty-one cancer cell lines of different origins were analyzed in the lactate production assay described in (B). Data are means ± SD of at least two independent experiments with 2 replicates each. Heat maps of LDHA, LDHB, and combined transcript expression obtained from gene expression analysis are shown underneath the graph, with the darker color representing higher expression. Expression values in MAS5 units are listed in Additional file 3. MAS5 units are obtained by processing the data using Affymetrix MAS5 algorithm, with target value set at 100.
Figure 2
Figure 2
Effects of Compound 1 on lactate production in hypoxia/anoxia and the role of lactate dehydrogenase B (LDHB) expression in breast cancer cells. (A) Effect of hypoxia on lactate production EC50 values of Compound 1. MDA-MB-453 cells were cultured in normoxic (21% oxygen) or hypoxic (1%) conditions overnight. Medium was exchanged with physiological DMEM containing dimethyl sulfoxide (DMSO) or Compound 1 at multiple concentrations and collected after 2 h for hypoxic cells and 6 h for normoxic cells. EC50 values were estimated based on a 50% reduction in lactate production (dotted lines). (B) Extracellular acidification rate (ECAR) as a measure of lactate production after mitochondrial inhibition was quantified for MDA-MB-453. The baseline ECAR reading was obtained, and multiple concentrations of Compound 1 (2.5 to 40 μM) or DMSO were added followed by rotenone (Rot) (1 μM) and antimycin (1 μM). ECAR reading immediately prior to Compound 1 injection was set at 100%. (C) ECAR response of MDA-MB-453 cells to rotenone/antimycin after Compound 1 addition from (B) as a function of Compound 1 concentration. The averages of the final three readings were normalized to the untreated DMSO control. EC50 value was estimated based on a 50% reduction in ECAR. (D) Ssensitivity of a panel of breast cancer cell lines to Compound 1 after mitochondrial inhibition. Log2-linear slopes of ECAR response (obtained as in (C) for MDA-MB-453) were estimated for multiple cell lines between 2.5 and 40 μM. Means ± standard error (SE) of fitted values are shown. Cells were classified as low LDHB if the primary LDH tetramer was LDH5. Relative LDHB expression was determined previously by non-denatured electrophoresis [25]. (E) Effect of LDHA or LDHB expression on Compound 1 sensitivity in HCC1937 cells. Stable isogenic lines were created using a lentiviral shRNA (non-silencing. LDHA, or LDHB) with puromycin selection.
Figure 3
Figure 3
Real-time 13C nuclear magnetic resonance (NMR) spectroscopy analysis of D-(1,6-13C2)glucose consumption and (3-13C)lactate production for Snu398 and HepG2 human hepatocellular carcinoma cells. (A) Selective 13C-enrichment of glucose enables detection of 13C-enriched metabolites originating exclusively from glucose metabolism. (B) Time-dependent changes in concentrations of D-(1,6-13C2)glucose and (3-13C)lactate obtained by recording NMR spectra every 4 minutes in Snu398 and HepG2 cells in the absence and presence of 10 μM Compound 1. Peak areas for 13C-1 of glucose and 13C-3 of lactate were used for measuring their concentrations. Data are means ± SD of two independent experiments.
Figure 4
Figure 4
Effects of Compound 1 on extracellular acidification rate (ECAR) and oxygen consumption rate (OCR). (A) Change in ECARand OCR of Snu398 (top) and HepG2 (bottom) cells upon addition of lactate dehydrogenase A (LDHA) inhibitor. ECAR and OCR values were assessed by Seahorse XF Analyzer before and after addition of Compound 1, and changes observed 92 minutes after inhibitor addition were plotted as a function of inhibitor concentration. Results are means ± standard error (SE) of at least three independent experiments containing four wells per condition. EC50 values are means ± SE of at least three independent experiments. (B) Time-dependent changes in OCR in Snu398 (top) and HepG2 (bottom) cells in response to Compound 1 addition followed by 1 μg/mL oligomycin addition normalized to basal values. (C) Oligomycin-dependent OCR (OCROLG) of HepG2 cells as a function of Compound 1 concentration. OCROLG is defined as the OCR change to oligomycin following Compound 1 addition. Cells were measured in 5 mM glucose/0.5 mM glutamine or 0.5 mM glutamine DMEM. Values are presented as a percentage of the basal OCR. (D) OCR of HepG2 cells in response to Compound 1 in DMEM containing 5 mM glucose and 0.5 mM glutamine (left) or 0.5 mM glutamine alone (right). Oligomycin (1 μg/mL) and Compound 1 were added simultaneously after 14 minutes, and the time-dependent OCR was recorded. Residual OCR after oligomycin addition represents the non-mitochondrial and mitochondrial proton leak contributions to the total OCR. Non-mitochondrial OCR as determined by antimycin addition was unchanged after Compound 1 addition (data not shown). (E) OCR and ECAR responses of HepG2 mitochondria to Compound 1. Cells were permeabilized using 2 nM PMP in MAS containing 10 mM pyruvate/10 mM malate/4 mM ADP. For (B-E), each point represents means ± SD. *P <0.05, **P <0.01, ***P <0.001 compared to untreated controls.
Figure 5
Figure 5
Lactate dehydrogenase A (LDHA) inhibitor induces profound metabolic changes in Snu398, but not HepG2 hepatocellular carcinoma cells. Cells were treated with 10 μM of Compound 2 or dimethyl sulfoxide (DMSO) control for 24 h and whole-cell extracts and conditioned media were subjected to mass spectrometry analysis of over 500 metabolites. Changes in ion counts observed in the whole-cell extracts in select intermediates of cytosolic glycolysis (A), citric acid cycle (B), and carnitine metabolism and pentose phosphate pathway (C) are shown. Data are presented as means ± standard error SE of five replicates per condition, *P ≤0.001. Changes in all other metabolites in both cell lines and conditioned media are presented in Additional file 3.
Figure 6
Figure 6
Compound 1 causes increase in pyruvate kinase (PK) activity. (A) Schematic representation of the metabolic changes observed in Snu398 cells upon LDHA inhibition indicating a significant rise in fructose-1,6-bisphosphate that is known to potentiate PK activity. (B) Compound 1 causes dose-dependent increase in PK activity in Snu398, but not HepG2 cells. Cells were incubated with dimethyl sulfoxide (DMSO) or increasing doses (Snu398 cells, closed circles) or 10 μM (HepG2 cells, open circles) of Compound 1 for 6 h and whole-cell extracts were isolated and subjected to PK activity analysis. (C) Compound 1 causes dose-dependent increase in Pyruvate kinase M2 (PKM2) tetramerization in Snu398 cells. Snu398 cells were incubated with DMSO control or increasing doses of Compound 1 for 6 h and whole-cell extracts were isolated and subjected to native gel electrophoresis followed by western immunoblotting with PKM2-specific antibody. NAD+, nicotinamide adenine dinucleotide; TCA, tricarboxylic acid cycle.
Figure 7
Figure 7
Compound 1 inhibits cell proliferation and induces apoptosis in Snu398, but not HepG2 human hepatocellular carcinoma cells. (A,C) Both cell lines were plated in 6-well plates and treated with dimethyl sulfoxide (DMSO) or increasing doses of Compound 1 for 4 to 8 days. At the end of this incubation, numbers of viable cells were assessed by trypan blue exclusion and plotted as a function of Compound 1 concentration. The graphs on the bottom panels were obtained in the presence of 0.5 nM of the nicotinamide adenine dinucleotide (NAD+) synthesis inhibitor, FK866. Starting cell densities are indicated by dashed lines. Data are means ± SD of at least four independent experiments except in (C), bottom, where n = 2. (B) Snu398 cells were treated with DMSO or increasing doses of Compound 1 for 24 h, whole-cell extracts were isolated and subjected to western immunoblotting with the antibody-recognizing poly (ADP-ribose) polymerase (PARP) (D214) fragment.

Similar articles

Cited by

References

    1. Vander Heiden MG, Cantley LC, Thompson CB. Understanding the Warburg effect: the metabolic requirements of cell proliferation. Science. 2009;324:1029–1033. doi: 10.1126/science.1160809. - DOI - PMC - PubMed
    1. Dang CV. MYC on the path to cancer. Cell. 2012;149:22–35. doi: 10.1016/j.cell.2012.03.003. - DOI - PMC - PubMed
    1. Giatromanolaki A, Sivridis E, Gatter KC, Turley H, Harris AL, Koukourakis MI. Lactate dehydrogenase 5 (LDH-5) expression in endometrial cancer relates to the activated VEGF/VEGFR2(KDR) pathway and prognosis. Gynecol Oncol. 2006;103:912–918. doi: 10.1016/j.ygyno.2006.05.043. - DOI - PubMed
    1. Kolev Y, Uetake H, Takagi Y, Sugihara K. Lactate dehydrogenase-5 (LDH-5) expression in human gastric cancer: association with hypoxia-inducible factor (HIF-1alpha) pathway, angiogenic factors production and poor prognosis. Ann Surg Oncol. 2008;15:2336–2344. doi: 10.1245/s10434-008-9955-5. - DOI - PubMed
    1. Koukourakis MI, Giatromanolaki A, Sivridis E, Bougioukas G, Didilis V, Gatter KC, Harris AL. Lactate dehydrogenase-5 (LDH-5) overexpression in non-small-cell lung cancer tissues is linked to tumour hypoxia, angiogenic factor production and poor prognosis. Br J Cancer. 2003;89:877–885. doi: 10.1038/sj.bjc.6601205. - DOI - PMC - PubMed