. 2013:4:2834.
doi: 10.1038/ncomms3834.

The TSC-mTOR pathway regulates macrophage polarization

Affiliations

The TSC-mTOR pathway regulates macrophage polarization

Vanessa Byles et al. Nat Commun. 2013.

Abstract

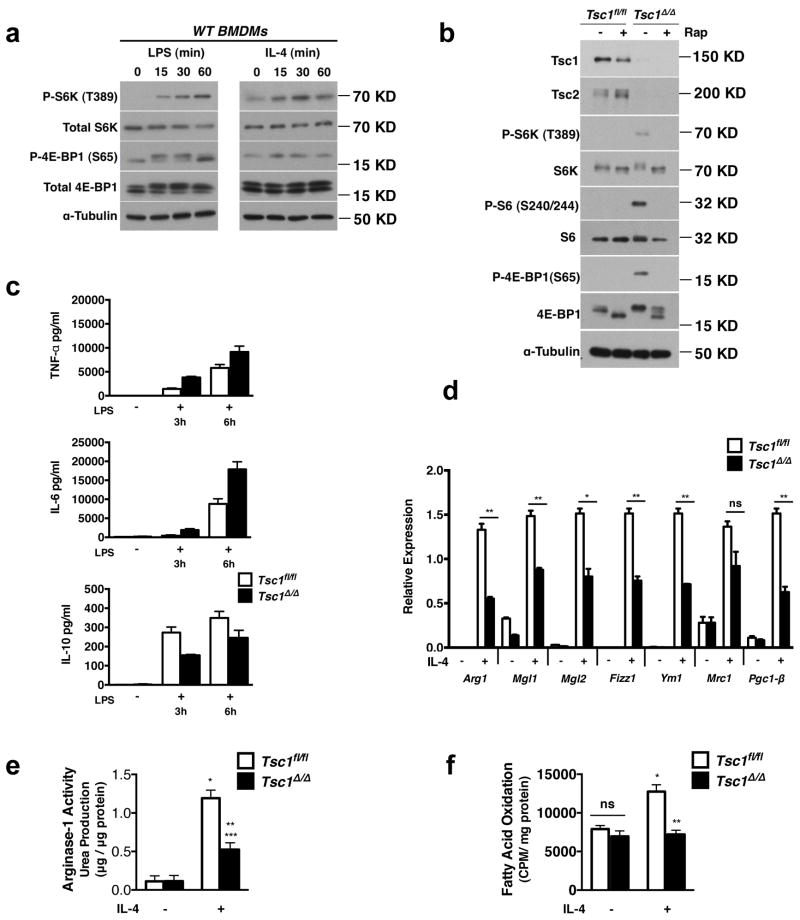
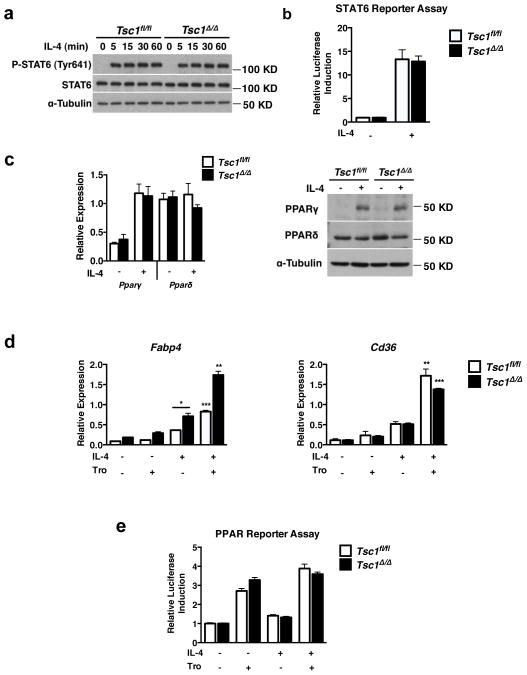
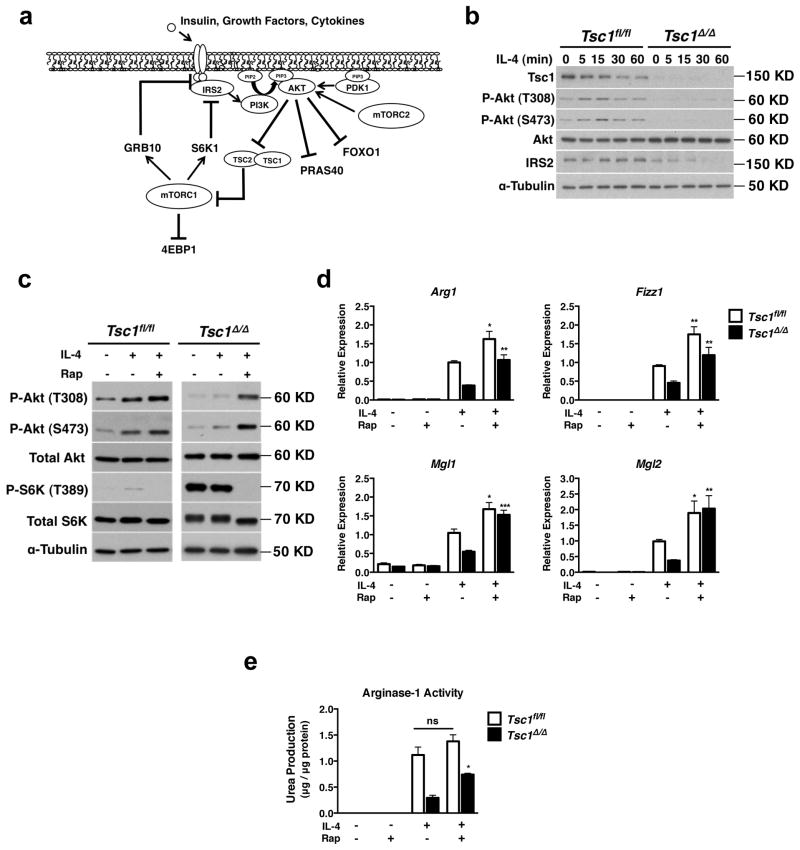
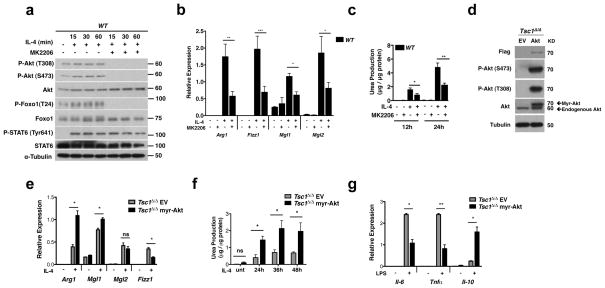
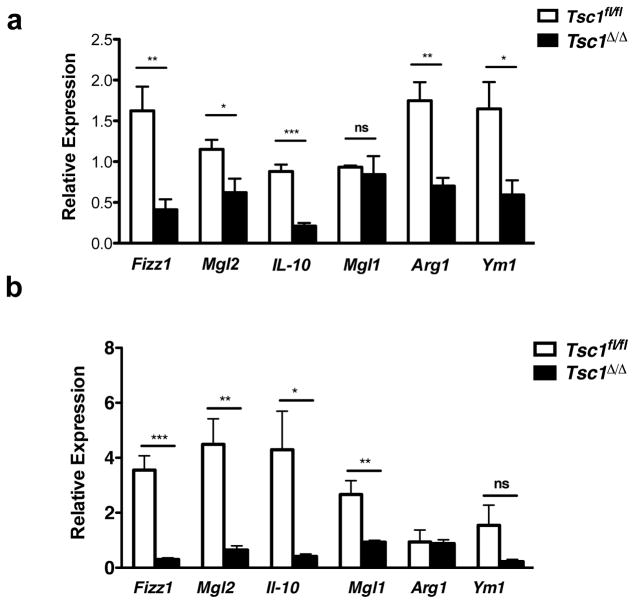
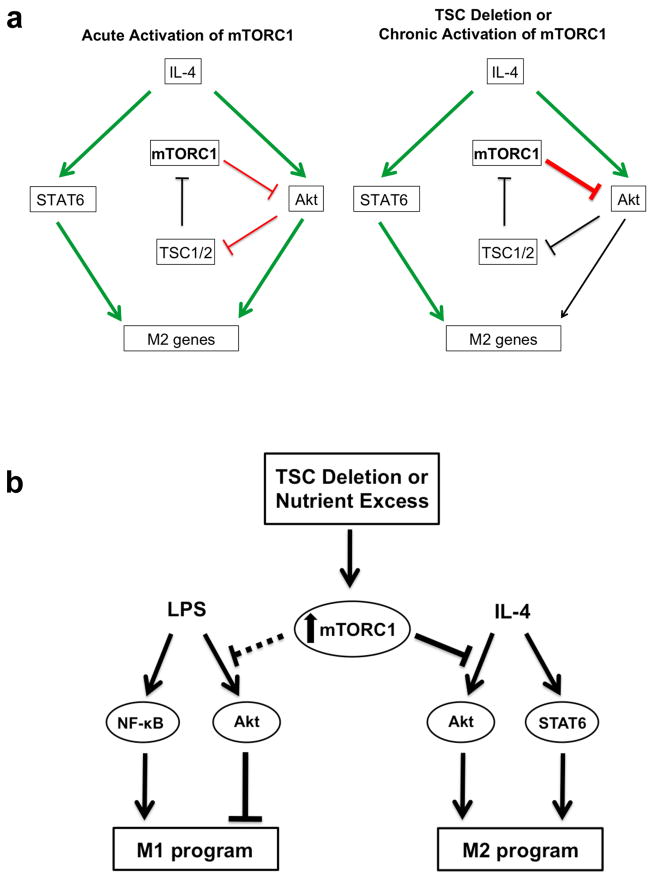
Macrophages are able to polarize to proinflammatory M1 or alternative M2 states with distinct phenotypes and physiological functions. How metabolic status regulates macrophage polarization remains not well understood, and here we examine the role of mTOR (mechanistic target of rapamycin), a central metabolic pathway that couples nutrient sensing to regulation of metabolic processes. Using a mouse model in which myeloid lineage-specific deletion of Tsc1 (Tsc1(Δ/Δ)) leads to constitutive mTOR complex 1 (mTORC1) activation, we find that Tsc1(Δ/Δ) macrophages are refractory to IL-4-induced M2 polarization, but produce increased inflammatory responses to proinflammatory stimuli. Moreover, mTORC1-mediated downregulation of Akt signalling critically contributes to defective polarization. These findings highlight a key role for the mTOR pathway in regulating macrophage polarization, and suggest how nutrient sensing and metabolic status could be 'hard-wired' to control of macrophage function, with broad implications for regulation of type 2 immunity, inflammation and allergy.


Conflict of interest statement

Competing financial interests

The authors declare no competing financial interests.

Figures

Figure 1
Figure 1. Tsc1Δ/Δ BMDMs Have Defective M2 Polarization and Enhanced Responses to LPS stimulation
a. Immunoblot analysis of WT BMDMs stimulated with LPS or IL-4 for 15–60 min as indicated. b. Immunoblot analysis of lysates from Tsc1fl/fl and Tsc1Δ/Δ BMDMs treated with or without rapamycin for 15h. c. Measurement of TNF-α, IL-6, and IL-10 secretion by ELISA after treatment with LPS for 3h and 6h, (n=2 representative experiments). d. Expression of M2 genes in Tsc1fl/fl and Tsc1Δ/Δ BMDMs after treatment with IL-4 for 24h (n=3). *p<0.05, **p<0.01, ***p<0.001.e. Urea production normalized to total protein in Tsc1fl/fl and Tsc1Δ/Δ BMDMs stimulated as in (c), (n=4), *p<0.001 for untreated vs IL-4 for Tsc1fl/fl, **p<0.01 for IL-4 treated Tsc1fl/fl vs Tsc1Δ/Δ, ***p<0.05 for untreated vs IL-4 for Tsc1Δ/Δ. f. Fatty acid oxidation of 3H-palmitic acid presented as counts per minute normalized to mg of total protein after 36h treatment with IL-4, (n=3). *p<0.01 for untreated vs IL-4 in Tsc1fl/fl, **p<0.01 for IL-4 treated Tsc1fl/fl vs Tsc1Δ/Δ. Graphs are shown as mean ± SEM. P-values were determined using Student’s t-tests.
Figure 2
Figure 2. STAT6 and PPARγ Activity are Normal in Tsc1Δ/Δ BMDMs
a. Immunoblot analysis of lysates from Tsc1fl/fl and Tsc1Δ/Δ BMDMs stimulated with IL-4 for 5–60min. b. STAT6 luciferase reporter assay in Tsc1fl/fl and Tsc1Δ/Δ BMDMs. Data shown as fold induction of firefly luciferase activity normalized to renilla luciferase for IL- 4 treatment relative to untreated sample (n=2 experiments performed in duplicate). c. Gene expression and immunoblots for PPARγ and PPARδ in Tsc1fl/fl and Tsc1Δ/Δ BMDMs after treatment with IL-4 for 24h. Gene expression data is shown as mean ± SEM (n=3). d. Expression of PPARγ-dependent genes in Tsc1fl/fl and Tsc1Δ/Δ BMDMs treated with IL-4 in the presence or absence of troglitazone for 24h. DMSO vehicle was used as control, ( n=3). *p<0.05 for IL-4 treated Tsc1fl/fl and Tsc1Δ/Δ, **p<0.01, ***p<0.001 for IL-4 versus IL-4+Tro. e. PPAR luciferase reporter assay in Tsc1fl/fl and Tsc1Δ/Δ BMDMs. Data shown as fold induction of firefly luciferase activity normalized to renilla luciferase for IL-4 or troglitazone treatment relative to untreated sample (representative of 3 experiments performed in triplicate). Graphs are shown as mean ± SEM. P-values determined using Student’s t-tests.
Figure 3
Figure 3. Constitutive mTORC1 Activity Attenuates IL-4-Induced Akt Activation
a. Overview of mTORC1 signaling downstream of IL-4, insulin, and growth factors. Receptor activation engages the IRS/PI3K/Akt pathway. PI3K converts PIP2 to PIP3 thus recruiting PDK1 and Akt to the plasma membrane, enabling PDK1-mediated phosphorylation of Akt on T308. PI3K also activates mTORC2, which phosphorylates Akt on S473. Thus activated, Akt can phosphorylate downstream targets to regulate their activity. One consequence of Akt activation is increased mTORC1 activity, which feeds back to attenuate IRS2/PI3K/Akt signaling through multiple mechanisms, including reducing levels of IRS2 while increasing levels of GRB10. b. Immunoblot analysis of lysates from Tsc1fl/fl and Tsc1Δ/Δ BMDMs stimulated with IL-4 for 5–60 min. c. Immunoblot analysis of lysates from Tsc1fl/fl and Tsc1Δ/Δ BMDMs stimulated with IL-4 for 20 min in the presence or absence of rapamycin (20nM, 1h pretreatment). DMSO vehicle was used as control. d. Expression of M2 genes in Tsc1fl/fl and Tsc1Δ/Δ BMDMs after treatment with IL-4 for 15h in the presence or absence of rapamycin (20nM, 1h pretreatment). (n=5). *p<0.05, **p<0.01, ***p<0.001 for IL-4 versus IL-4+rap. e. Urea production normalized to total protein in Tsc1fl/fl and Tsc1Δ/Δ BMDMs stimulated with IL- 4 for 20h in the presence or absence of rapamycin (20nM, 1h pretreatment). (n=5),*p<0.001. Graphs are shown as mean ± SEM. P-values were determined using Student’s t-tests.
Figure 4
Figure 4. Akt Signaling is Critical For Polarization in Tsc1Δ/Δ BMDMs
a. Immunoblot analysis of WT BMDMs pretreated with MK-2206 for 1h and treated with IL-4 for the indicated time points. b and c. WT BMDMs were pretreated with MK-2206 or DMSO for 1h before stimulation with IL-4 for 24h and examination of (b) M2 gene expression (n=3) or (c) urea production (n=4). d. Immunoblot analysis of Tsc1Δ/Δ BMDMs transduced with myr-flag-Akt or empty vector (EV). e and f. Myr-Akt Tsc1Δ/Δ BMDMs and EV Tsc1Δ/Δ BMDMs were stimulated with IL-4 followed 24h later by analysis of (e) M2 gene expression (n=4 representative experiments) or (f) urea production (n=3). g. Cytokine gene expression in myr-Akt Tsc1Δ/Δ BMDMs and EV Tsc1Δ/Δ BMDMs stimulated with LPS for 6 hours (n=3). Graphs are shown as mean ± SEM,*p<0.05, **p<0.01, ***p<0.001. P-values were determined using Student’s t-tests.
Figure 5
Figure 5. M2 Polarization of Tsc1Δ/Δ Mice is Impaired in vivo
a. M2 gene expression in PECs from Tsc1Δ/Δ and Tsc1fl/fl mice 4 days post IP injection with IL-4 complex on days 0 and 2 (n= 4 mice per genotype). b. M2 gene expression in PECs from male Tsc1Δ/Δ and Tsc1fl/fl mice 48h post IP injection with chitin (n=5 mice per genotype). Data shown as mean ± SEM, *p<0.05, **p<0.01, ***p<0.001. P-values were determined using Student’s t-tests.
Figure 6
Figure 6. Model
Proposed model for how mTORC1 activity controls macrophage polarization. a. Physiological induction of the Akt-mTORC1 signaling loop by IL-4 stimulation (left) allows for transient, inducible activation of the pathway, and enables Akt to synergize with the JAK/STAT pathway for M2 polarization. mTORC1 activity is also regulated by nutrient availability (not shown here), so such wiring of the signaling pathway may allow calibration of M2 activation to metabolic status (left). In contrast, constitutive or aberrant mTORC1 activation corrupts this signaling pathway and modulation of macrophage activation by metabolic inputs (right). (Green = activation; Red = inhibition; Black = attenuated) b. Constitutive or aberrant activation of mTORC1 impairs the ability of macrophages to respond appropriately to polarizing stimuli. A critical mediator of this process is Akt, whose activity is downregulated by increased mTORC1 activity.

References

    1. Sica A, Mantovani A. Macrophage plasticity and polarization: in vivo veritas. J Clin Invest. 2012;122:787–795. - PMC - PubMed
    1. Gordon S, Martinez FO. Alternative activation of macrophages: mechanism and functions. Immunity. 2010;32:593–604. - PubMed
    1. Chawla A. Control of macrophage activation and function by PPARs. Circ Res. 2010;106:1559–1569. - PMC - PubMed
    1. Odegaard JI, et al. Macrophage-specific PPARgamma controls alternative activation and improves insulin resistance. Nature. 2007;447:1116–1120. - PMC - PubMed
    1. Kang K, et al. Adipocyte-derived Th2 cytokines and myeloid PPARdelta regulate macrophage polarization and insulin sensitivity. Cell Metab. 2008;7:485–495. - PMC - PubMed

Publication types