. 2013:4:2862.
doi: 10.1038/ncomms3862.

Triggers of key calcium signals during erythrocyte invasion by Plasmodium falciparum

Affiliations
Free PMC article

Triggers of key calcium signals during erythrocyte invasion by Plasmodium falciparum

Xiaohong Gao et al. Nat Commun. 2013.
Free PMC article

Abstract

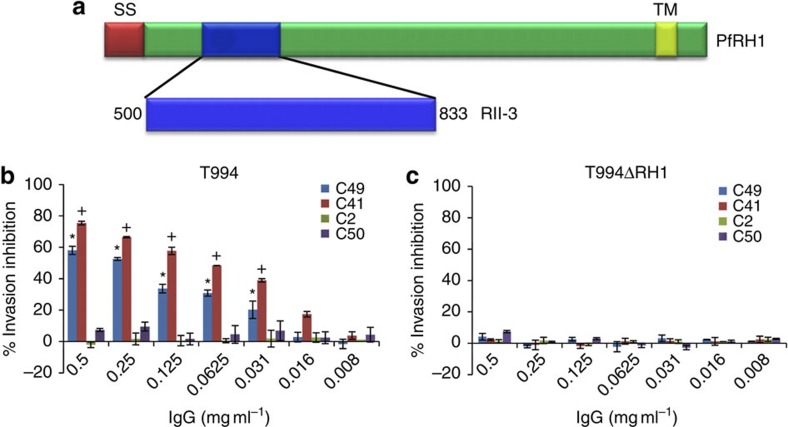
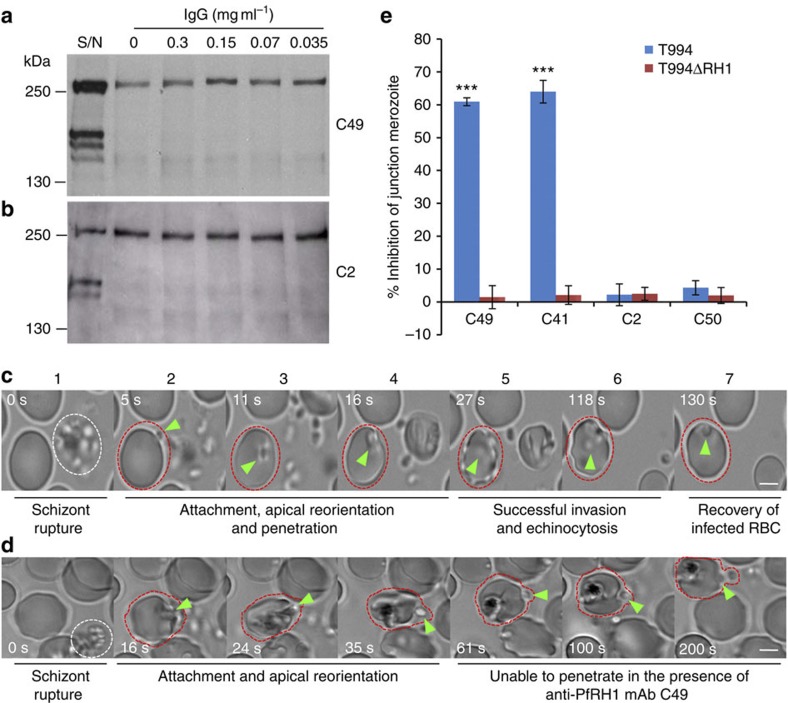
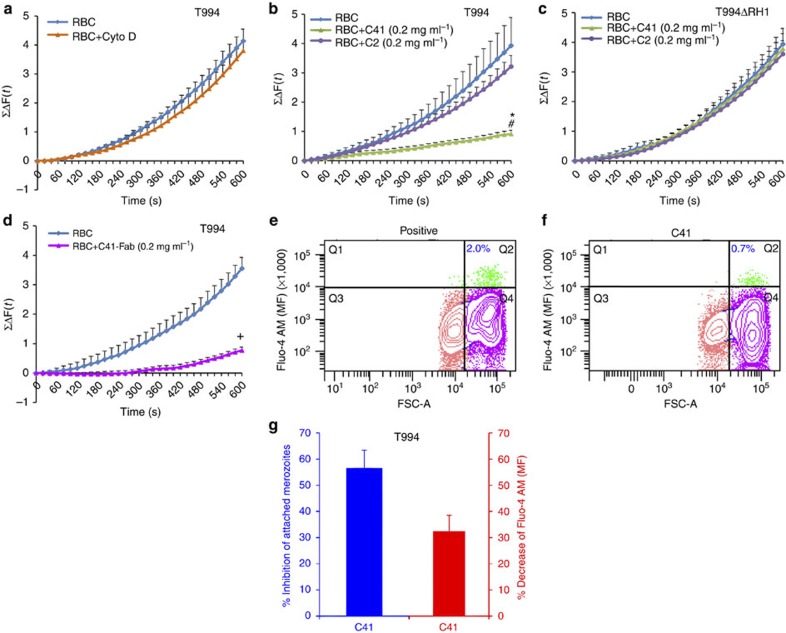
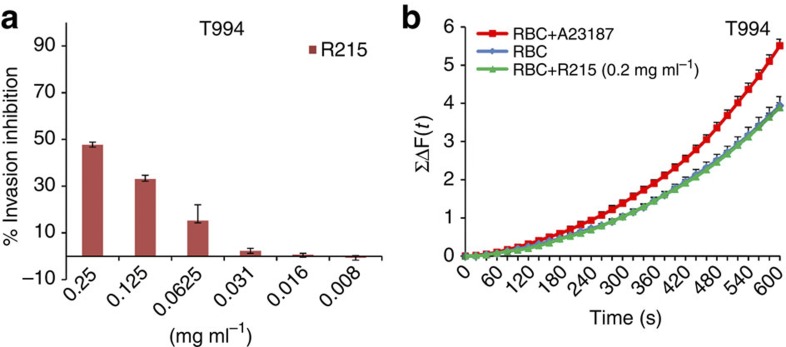
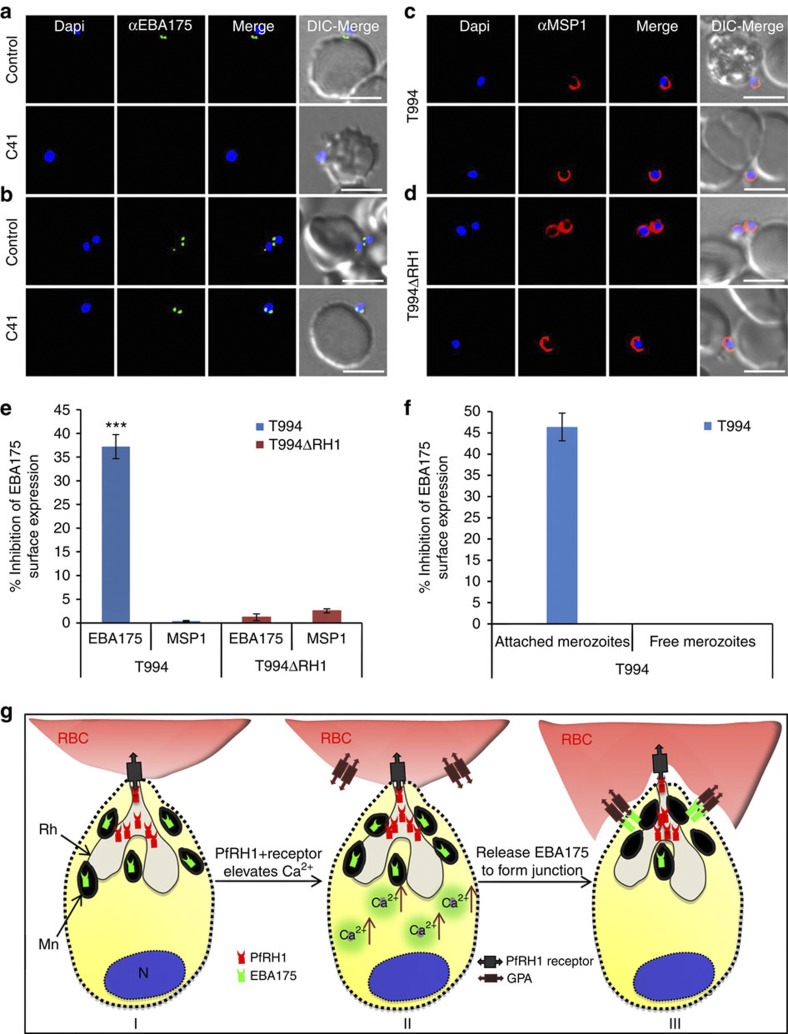
Invasion of erythrocytes by Plasmodium falciparum merozoites is a complex multi-step process mediated by specific interactions between host receptors and parasite ligands. Reticulocyte-binding protein homologues (RHs) and erythrocyte-binding-like (EBL) proteins are discharged from specialized organelles and used in early steps of invasion. Here we show that monoclonal antibodies against PfRH1 (an RH) block merozoite invasion by specifically inhibiting calcium signalling in the parasite, whereas invasion-inhibiting monoclonal antibodies targeting EBA175 (an EBL protein) have no effect on signalling. We further show that inhibition of this calcium signalling prevents EBA175 discharge and thereby formation of the junction between parasite and host cell. Our results indicate that PfRH1 has an initial sensing as well as signal transduction role that leads to the subsequent release of EBA175. They also provide new insights on how RH-host cell interactions lead to essential downstream signalling events in the parasite, suggesting new targets for malaria intervention.


Figures

Figure 1
Figure 1. Anti-PfRH1 mAbs significantly block parasite invasion.
(a) Full-length PfRH1 including signal sequence (SS, red), erythrocyte-binding region RII-3 (blue, encompassing amino acids 500–833) and transmembrane domain (TM, yellow). (b,c) Invasion inhibition assays using anti-PfRH1 mAbs (IgG) in T994 (b) and T994ΔRH1 (c). Bar charts show mean±s.e.m.; n=3. *P≤0.0003 by one-way ANOVA, indicating that C49 successfully blocked the invasion in T994 compared with the invasion in the presence of C2 and C50.+P≤0.0003 by one-way ANOVA, indicating that C41 significantly inhibited the invasion compared with C2 and C50.
Figure 2
Figure 2. Anti-PfRH1 mAbs inhibit invasion before junction formation.
(a,b) Erythrocyte binding assays of T994 parasite culture supernatants using the C49 (a) and C2 (b) mAbs. Neither C49 nor C2 (0.035–0.3 mg ml−1) was able to inhibit the erythrocyte binding of PfRH1. T994 parasite culture supernatants (S/N) were used as a quality control. Molecular sizes are indicated on the left (in kDa). (c,d) Snapshots taken from time-lapse live movie microscopy of invasion of W2mef by merozoites in the absence (c) or presence (d) of C49 mAb. Time-elapsed post schizont rupture is indicated in each snapshot in seconds (sec, white). A white dotted circle indicates a rupturing schizont. Green arrows point to merozoites. A red dotted circle around an erythrocyte is added to help follow the infection. Scale bars=5 μM. (c) In the absence of mAb, the merozoite released from a mature schizont (white cycle) attaches, apically reorients and penetrates into an uninfected erythrocyte. Following successful invasion, deformation of infected erythrocytes occurs (echinocytosis) and by 2 min the erythrocytes recover back to its normal shape. (d) In the presence of C49, the merozoite released from a mature schizont attaches and apically reorients, but it is unable to penetrate the erythrocyte even after 3 min. Also see Supplementary Movies 1,2. (e) Anti-PfRH1 inhibitory mAbs significantly reduce merozoite junction formation. T994 or T994ΔRH1 schizonts were pretreated with Cyto D and allowed to rupture in the absence or presence of anti-PfRH1 mAbs (0.2 mg ml−1). Junction-arrested merozoites were counted microscopically. Bar chart indicates the counting of junction-arrested merozoites with mAbs C2, C41, C49 and C50 in T994 and T994ΔRH1 compared with the arrested parasites in the absence of mAbs. Inhibitory mAbs C49 and C41 significantly blocked merozoite junction formation in T994. The error bar indicates the s.e.m.; n=3. ***P≤0.00014 by one-way ANOVA indicates the significant differences between the effects of inhibitory mAbs (C49 and C41) and those of non-inhibitory mAbs (C2 and C50).
Figure 3
Figure 3. Detection of cytosolic Ca2+ levels during merozoite invasion.
(ad) Cytosolic Ca2+ levels were detected using a fluorescence plate reader. (a) Preloaded T994 merozoites with Fluo-4AM were incubated with erythrocytes in the absence (RBC) or presence of Cyto D (RBC+Cyto D). (b,c) Preloaded T994 (b) or T994ΔRH1 (c) merozoites were incubated with erythrocytes in the absence (RBC) and presence of either C41 (RBC+C41 (0.2 mg ml−1)) or C2 (RBC+C2 (0.2 mg ml−1)). (d) Preloaded T994 merozoites were incubated with erythrocytes in the absence (RBC) or presence of mAb C41 Fab fragment (C41 Fab (0.2 mg ml−1)). The cumulative changes of Ca2+ levels (≤ΔF (t)) in merozoites over 600 s were summed up and plotted against time (s). Experimental data were presented as the mean±s.e.m.; n=3. *P≤0.0001 by one-way ANOVA, indicating that C41 successfully blocked the Ca2+ signalling in T994 when compared with the absence of C41. #P≤0.0001 by one-way ANOVA, indicating that C41 successfully blocked the Ca2+ signalling in T994 when compared with the presence of C2.+P≤0.0001 by one-way ANOVA, indicating that C41 Fab fragment significantly inhibited the Ca2+ signalling in T994, when compared with the absence of C41 Fab fragment. (eg) Cytosolic Ca2+ levels detected by flow cytometry. Representative FACS contour plots (e,f) were gated by size (FSC-A) versus mean fluorescence (MF) of Fluo-4 AM of merozoite (DAPI (+)) incubated with erythrocytes in the absence (e, Positive) or presence of C41 (f, C41). Vertical gating is to separate the free merozoites with low FSC from the RBC-attached merozoites with high FSC, whereas horizontal gating is to differentiate intercellular Ca2+ levels. Q1 (green) represents free merozoites with Fluo-4 AM signals. Q2 (green) represents invading merozoites with increasing Fluo-4 AM signals. The number (blue) in Q2 represents % population of attached merozoites. Q3 (peach) represents free merozoites with no signal. Q4 (pink) represents attached merozoites with no signal. (g) Statistical analysis of the effect of C41 on Ca2+ signalling during T994 merozoite invasion by FACS. C41 was able to reduce the number of invading merozoites to 56.6% (blue) and to decrease the overall Ca2+ level to 32.42% (red) during invasion, as compared with that in the absence of C41. Experimental data are presented as the mean±s.e.m.; n=3.
Figure 4
Figure 4. Correlation between invasion and Ca2+ signal.
(a) T994 merozoites isolated from each Ca2+ measurement experiment (Fig. 3b) were also used in parallel to test invasion (Supplementary Table S3). The percentage of invasion (Parasitemia (%), horizontal axis) is plotted against the Ca2+ signals at t=600 s (≤ΔF (t=600 s), vertical axis) (Fig. 3b). Blue diamonds represent merozoites incubated with erythrocytes in the absence of mAbs (RBC). Green triangles represent merozoites incubated with erythrocytes in the presence of inhibitory mAb C41 (RBC+C41 (0.2 mg ml−1)). Purple circles represent merozoites incubated with erythrocytes in the presence of non-inhibitory mAb C2 (RBC+C2 (0.2 mg ml−1)). The R-square (R2) with value of 0.836 indicates strong correlation between invasion and Ca2+ signalling. (b) Merozoite invasion kinetics assay under heparin treatment. Freshly isolated T994 merozoites were allowed to invade erythrocytes followed by treatment with heparin (200 μg ml−1) at different time points (2–10 min with 2 min interval) to inhibit invasion. After the final time point, cultures were incubated for 40 h, and resulting parasitemias were analysed by flow cytometry. The proportion of merozoites that have invaded with increasing time is shown as % of maximum invasion obtained in uninhibited culture. The rate of merozoite invasion over time is linear (R2=0.991). Experimental data are presented as the mean±s.e.m.; n=3.
Figure 5
Figure 5. The R215 mAb against EBA175 region II inhibits invasion but not Ca2+ signalling.
(a) Invasion inhibition assay using anti-EBA175 mAb R215 in T994 parasites. Bar charts show invasion inhibition of different concentrations (0.25–0.008 mg ml−1) of the EBA175-specific mAb R215 in T994. Bar charts show mean±s.e.m.; n=3. (b) Cytosolic Ca2+ levels were detected by using a fluorescence plate reader. Preloaded T994 merozoites with Fluo-4AM were incubated with erythrocytes in the absence (RBC) or presence of R215 (RBC+R215 (0.2 mg ml−1)). Ca2+ ionophore A23187 (RBC+A23187) was used as positive control. Changes in cytosolic Ca2+ levels during merozoite invasion were assessed over time using a fluorescence plate reader. ≤ΔF(t) that reflects the total changes of cytosolic Ca2+ levels in merozoites were plotted against time (s). Experimental data were presented as the mean±s.e.m.; n=3.
Figure 6
Figure 6. Effect of anti-PfRH1 inhibitory mAbs on merozoite surface expression of EBA175 during invasion.
(ad) Surface expression of EBA175 and MSP1 on T994 and T994ΔRH1 was detected by immunofluorescence assays. Isolated T994 (a,c) or T994ΔRH1 (b,d) merozoites were directly incubated with erythrocytes containing 4 μM Cyto D in the absence (Control) and presence (C41) of C41 (0.2 mg ml−1) before analysis of expression of EBA175 and MSP1 at the junction. Both differential interference contrast (DIC) and fluorescence images were captured. Nuclear DNA was counterstained with DAPI (blue). EBA175 is shown in green, whereas MSP1 is shown in red. Fluorescence images, merged fluorescence images (DAPI and green or DAPI with red) and merged fluorescence images with DIC images are shown. Scale bars=10 μM. (e) EBA175 surface expression on merozoites was detected by using a fluorescence plate reader. Surface expression of EBA175 and MSP1 on merozoite in the presence of C41 was compared with their controls. Experimental data are presented as the mean±s.e.m.; n=3. ***P≤0.000025 by one-way ANOVA, indicating that C41 significantly decreases the surface expression of EBA175 in T994. (f) T994 merozoite EBA175 surface expression was also detected by flow cytometry during invasion (detail shown in Supplementary Fig. S8). Statistical analysis of the effect of C41 on merozoite EBA175 surface expression is shown. Merozoite attached to RBCs surface expression of EBA175 in the presence of C41 was compared with its positive control. Experimental data are presented as the mean±s.e.m.; n=4. (g) Schematic diagram of Ca2+ signalling in junction formation during erythrocyte invasion. After the merozoite initially attaches to the erythrocyte (RBC) and reorients itself, PfRH1 released from rhoptry (Rh) is responsible for sensing the apical end interaction (I). The binding of PfRH1 to its receptor triggers an increase of intracellular Ca2+ (II). Rise in cytosolic Ca2+ levels results in release of microneme (Mn) proteins such as EBA175 to bind to glycophorin A (GPA), which leads to tight junction formation (III).

Similar articles

Cited by

References

    1. Cowman A. F. & Crabb B. S. Invasion of red blood cells by malaria parasites. Cell 124, 755–766 (2006). - PubMed
    1. Baum J., Gilberger T. W., Frischknecht F. & Meissner M. Host-cell invasion by malaria parasites: insights from Plasmodium and Toxoplasma. Trends Parasitol. 24, 557–563 (2008). - PubMed
    1. Gaur D. & Chitnis C. E. Molecular interactions and signalling mechanisms during erythrocyte invasion by malaria parasites. Curr. Opin. Microbiol. 14, 422–428 (2011). - PubMed
    1. Gunalan K., Gao X., Yap S. S., Huang X. & Preiser P. R. The role of the reticulocyte-binding-like protein homologues of Plasmodium in erythrocyte sensing and invasion. Cell Microbiol. 15, 35–44 (2013). - PubMed
    1. Chitnis C. E. & Miller L. H. Identification of the erythrocyte binding domains of Plasmodium vivax and Plasmodium knowlesi proteins involved in erythrocyte invasion. J. Exp. Med. 180, 497–506 (1994). - PMC - PubMed

Publication types

MeSH terms

LinkOut - more resources