. 2013 Nov 26:9:709.
doi: 10.1038/msb.2013.66.

Transcriptional regulation is insufficient to explain substrate-induced flux changes in Bacillus subtilis

Affiliations

Transcriptional regulation is insufficient to explain substrate-induced flux changes in Bacillus subtilis

Victor Chubukov et al. Mol Syst Biol. .

Abstract

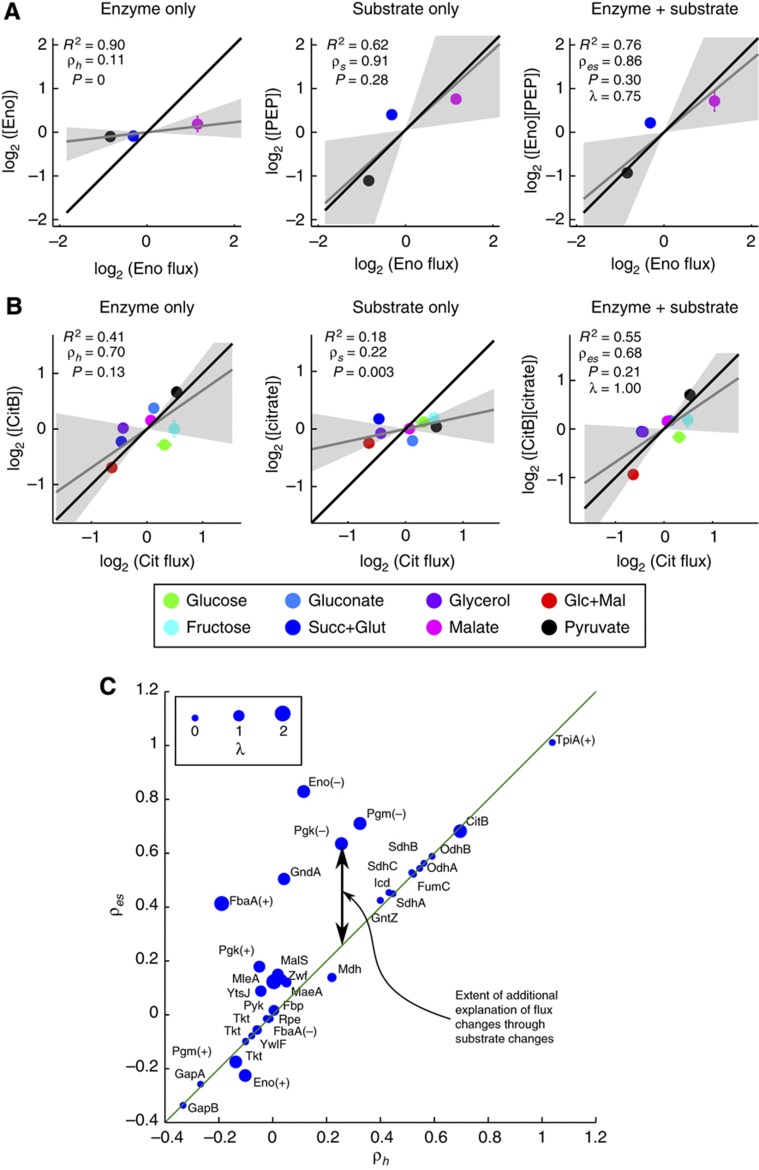
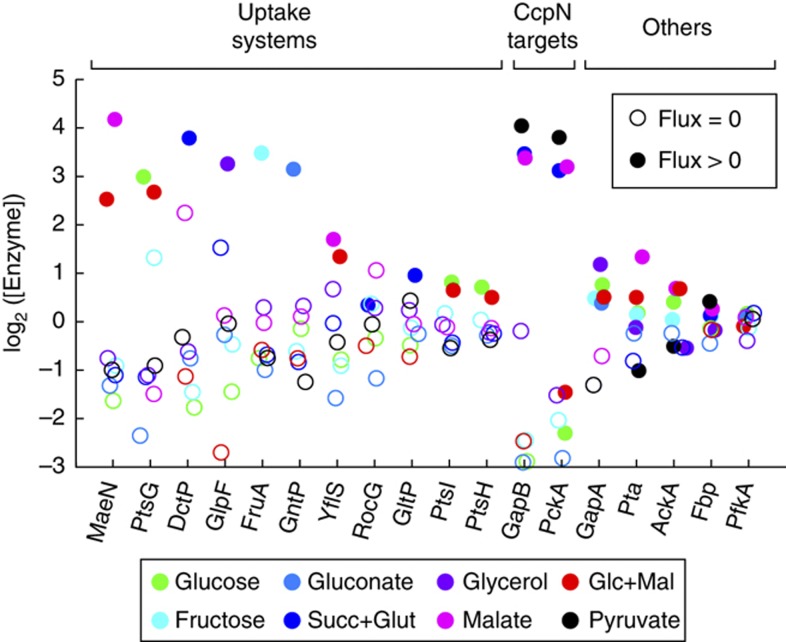
One of the key ways in which microbes are thought to regulate their metabolism is by modulating the availability of enzymes through transcriptional regulation. However, the limited success of efforts to manipulate metabolic fluxes by rewiring the transcriptional network has cast doubt on the idea that transcript abundance controls metabolic fluxes. In this study, we investigate control of metabolic flux in the model bacterium Bacillus subtilis by quantifying fluxes, transcripts, and metabolites in eight metabolic states enforced by different environmental conditions. We find that most enzymes whose flux switches between on and off states, such as those involved in substrate uptake, exhibit large corresponding transcriptional changes. However, for the majority of enzymes in central metabolism, enzyme concentrations were insufficient to explain the observed fluxes--only for a number of reactions in the tricarboxylic acid cycle were enzyme changes approximately proportional to flux changes. Surprisingly, substrate changes revealed by metabolomics were also insufficient to explain observed fluxes, leaving a large role for allosteric regulation and enzyme modification in the control of metabolic fluxes.


Conflict of interest statement

The authors declare that they have no conflict of interest.

Figures

Figure 1
Figure 1
Fluxes through B. subtilis central metabolism under eight conditions defined by different carbon sources. Numbers and sizes of arrows are normalized to the substrate uptake rate in each condition. For further analysis, absolute fluxes (mmol h−1 gcdw−1) were used. Substrate uptake rates (q) are given in mmol h−1 gcdw−1 and growth rates (μ) are in h−1.
Figure 2
Figure 2
Basic hypotheses of regulatory analysis. (A) Flux (J) changes can be decomposed into the contribution of enzyme concentration (E) changes and changes in the metabolic state (M). If the relative contributions of the two are constant, then the contribution of enzyme levels, ρh, can be estimated by the linear fit of a log-log plot. If ρh is near 1 (B), then it is consistent with changes in enzyme levels being entirely responsible for observed changes in flux. Otherwise, despite good correlation between flux and enzyme (C), other mechanisms such as substrate concentration changes, allosteric regulation, or enzyme modification are necessary to explain flux changes. Other possible outcomes could be incoherent flux and enzyme changes (D) or generally good agreement between enzyme concentration and flux but with several conditions where a distinct metabolic state is reached, which would show up as outliers from an otherwise good fit (E).
Figure 3
Figure 3
Correlation of flux and enzyme concentration (inferred from transcripts) changes for reactions in central metabolism. Four typical cases are shown in (AD). Both X and Y data are log2-transformed and normalized by subtracting the mean, forcing the line of best fit to pass through the origin. For each plot, the coefficient of determination (R2) and the slope (ρh) of the line of best fit (gray) are given, along with P, the P-value associated with the hypothesis ρh>1 (see Materials and methods). The shaded area corresponds to a 95% confidence interval of the fitted slope and the black line corresponds to ρh=1. (E) Scatter plot of P-values and goodness of linear fit for each reaction. To distinguish cases like (C) from (D), both of which give R2≈0, we take the mean value of the residuals as the goodness of fit for the purpose of this plot. Symbol size corresponds to the deviation in flux values (considering only fluxes greater than the cutoff of 0.1 mmol gcdw−1 h−1). Color corresponds to ρh values (the slope of the fitted line). Enzymes where P<0.05 (i.e., ρh=1 cannot be statistically excluded) and the mean residual value is <0.4 (i.e., good fit) are shown in italic. Some points that overlap perfectly have been offset slightly for visibility. (F) Graphical representation of ρh values for each enzyme in central carbon metabolism. Color legend and fonts are identical to (E).
Figure 4
Figure 4
Ratio between flux split ratios and enzyme concentration ratios at three branch points in central metabolism (AC). As in Figure 3, the coefficient of determination (R2) and slope of the line of best fit (ρhr) are given for each plot, along with a P-value for the hypothesis ρhr>1. The shaded region indicates a 95% confidence interval of the fitting and the black line corresponds to slope 1.
Figure 5
Figure 5
Combined effects of substrate and enzyme changes on flux predictions. Substrate changes may be the dominant drivers of flux (A) or partially explain outliers (B). See Figures 3 and 4 for an explanation of the plots. λ is the non-linearity parameter for the effect of substrate on flux (λ=1 corresponds to an inferred linear relationship between substrate and flux). (C) Effect of including substrate information for all reactions. For each enzyme where substrate concentration information was available, the ρh and ρes values are shown. The difference ρes−ρh represents the additional contribution of substrate information, which was significant only for a few reactions. Symbol size represents λ (see above). Reversible reactions in lower glycolysis were analyzed separately for each direction and are marked with (+) for glycolytic and (−) for gluconeogenic directions. Transketolase (Tkt) appears multiple times corresponding to its multiple reactions involving different substrates.
Figure 6
Figure 6
Enzyme concentrations (inferred from transcripts) for reactions with zero flux under some conditions. All concentrations are relative to the mean across conditions. Solid circles represent conditions with a significant flux (>0.1 mmol gcdw−1 h−1) while open circles represent conditions with zero flux. For GapA-GapB and Fbp-PfkA, we assumed futile cycle flux to be zero—the actual value cannot be estimated from the available data.

References

    1. Bar-Even A, Flamholz A, Noor E, Milo R (2012) Rethinking glycolysis: on the biochemical logic of metabolic pathways. Nat Chem Biol 8: 509–517 - PubMed
    1. Baran R, Bowen BP, Price MN, Arkin AP, Deutschbauer AM, Northen TR (2013) Metabolic footprinting of mutant libraries to map metabolite utilization to genotype. ACS Chem Biol 8: 189–199 - PubMed
    1. Beste DJV, Bonde B, Hawkins N, Ward JL, Beale MH, Noack S, Nöh K, Kruger NJ, Ratcliffe RG, McFadden J (2011) 13C metabolic flux analysis identifies an unusual route for pyruvate dissimilation in mycobacteria which requires isocitrate lyase and carbon dioxide fixation. PLoS Pathog 7: e1002091. - PMC - PubMed
    1. Birkes D, Dodge DY (1993) Alternative Methods of Regression. John Wiley & Sons: New York, NY, USA
    1. Bodenmiller B, Wanka S, Kraft C, Urban J, Campbell D, Pedrioli PG, Gerrits B, Picotti P, Lam H, Vitek O, Brusniak M-Y, Roschitzki B, Zhang C, Shokat KM, Schlapbach R, Colman-Lerner A, Nolan GP, Nesvizhskii AI, Peter M, Loewith R et al. (2010) Phosphoproteomic analysis reveals interconnected system-wide responses to perturbations of kinases and phosphatases in yeast. Sci Signal 3: rs4. - PMC - PubMed

Publication types

MeSH terms