. 2014 Feb;196(2):539-55.
doi: 10.1534/genetics.113.157602. Epub 2013 Nov 26.

Genetic complexity in a Drosophila model of diabetes-associated misfolded human proinsulin

Affiliations

Genetic complexity in a Drosophila model of diabetes-associated misfolded human proinsulin

Soo-Young Park et al. Genetics. 2014 Feb.

Erratum in

  • Genetics. 2014 Dec;198(4):1773

Abstract

Drosophila melanogaster has been widely used as a model of human Mendelian disease, but its value in modeling complex disease has received little attention. Fly models of complex disease would enable high-resolution mapping of disease-modifying loci and the identification of novel targets for therapeutic intervention. Here, we describe a fly model of permanent neonatal diabetes mellitus and explore the complexity of this model. The approach involves the transgenic expression of a misfolded mutant of human preproinsulin, hINS(C96Y), which is a cause of permanent neonatal diabetes. When expressed in fly imaginal discs, hINS(C96Y) causes a reduction of adult structures, including the eye, wing, and notum. Eye imaginal discs exhibit defects in both the structure and the arrangement of ommatidia. In the wing, expression of hINS(C96Y) leads to ectopic expression of veins and mechano-sensory organs, indicating disruption of wild-type signaling processes regulating cell fates. These readily measurable "disease" phenotypes are sensitive to temperature, gene dose, and sex. Mutant (but not wild-type) proinsulin expression in the eye imaginal disc induces IRE1-mediated XBP1 alternative splicing, a signal for endoplasmic reticulum stress response activation, and produces global change in gene expression. Mutant hINS transgene tester strains, when crossed to stocks from the Drosophila Genetic Reference Panel, produce F1 adults with a continuous range of disease phenotypes and large broad-sense heritability. Surprisingly, the severity of mutant hINS-induced disease in the eye is not correlated with that in the notum in these crosses, nor with eye reduction phenotypes caused by the expression of two dominant eye mutants acting in two different eye development pathways, Drop (Dr) or Lobe (L), when crossed into the same genetic backgrounds. The tissue specificity of genetic variability for mutant hINS-induced disease has, therefore, its own distinct signature. The genetic dominance of disease-specific phenotypic variability in our model of misfolded human proinsulin makes this approach amenable to genome-wide association study in a simple F1 screen of natural variation.

Keywords: Drosophila; complex disease; diabetes; misfolded protein; mutant insulin.


Figures

Figure 1
Figure 1
Eye phenotypes induced by hINSC96Y transgene expression. (A–D) Eyes of 3- to 5-day-old adults. (A) Female, GMR-Gal4. (B) Female, GMR-Gal4/UAS-hINSWT. (C) Female, GMR-Gal4/UAS-hINSC96Y. (D) Male, GMR-Gal4/UAS-hINSC96Y. (E–H) High-magnification images of adult eyes in A–D showing defects in patterning of ommatidia and mechanosensory bristles. (I–L) Eye-antennal imaginal discs of third instar larvae of genotypes noted in A–D stained with anti-human C-peptide antibody (red). (M–P) Discs in I–L stained with anti-ELAV antibody (green). Insets in M–P show enlarged area of the most posterior part of the eye disc.
Figure 2
Figure 2
Gene expression in eye-antennal imaginal discs of third instar larvae. (A) Relative mRNA levels in discs from larvae expressing wild-type (WT) and mutant (M, hINSC96Y) human proinsulin. WT-6, WT-24, M-101, and M-1 are independent transgenic lines. Gene expression is normalized to the expression level of rp49. The values (mean ± SE) are shown relative to the ratio for female WT-6, set to one. (B) Heat maps of expression profiles in rows (genes) and columns (lines × sex) for top 514 genes based on ANOVA between WT-24 and M-1 and the GMR-Gal4 control line are compared. ANOVA was performed for the three genotypes, two sexes, and two replicates according to the model y = u +G + S + G × S, where G is the genotype and S is gender. Each gene was tested individually. A list of 514 genes was selected to control FDR < 5%. Each row is scaled to have mean 0 and variance 1. (C) Venn diagram showing the number of differentially expressed genes (up and down) in males and females in the comparison of WT-24 and M-1.
Figure 3
Figure 3
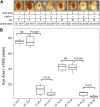
Eye degeneration in response to GMR-Gal4 and hINSC96Y gene dose. The eye degeneration phenotype is much more sensitive to mutant insulin gene dose than to GMR-Gal4 dose. All four possible combinations of two-locus genotypes (one or two copies of either GMR-Gal4 or hINSC96Y) were produced and adult eye areas measured separately for the two sexes, as described in Materials and Methods. (A) Representative adult eyes and the genotype abbreviations for the dosage series. (B) Box plot of eye area (N = 10 for each genotype/sex). Significance was determined by Student’s two-tailed t-test. Genotype abbreviations: 1G 1hI [F, M]: w; GMR>>hINSC96Y [Female, Male]; 2G 1hI [F, M]: w; GMR>>hINSC96Y/GMR-Gal4 [Female, Male]; 1G 2hI [F, M]: w; GMR>>hINSC96Y/UAS-hINSC96Y [Female, Male]; 2G 2hI [F, M]: w; GMR>>hINSC96Y/GMR>>hINSC96Y [Female, Male].
Figure 4
Figure 4
Notum and wing phenotypes induced by hINSC96Y transgene expression. (A–J) Notum (A–D) and wing (E–J) phenotypes in 3- to 5-day-old adults of indicated sex and genotype. Insets show a higher-magnification view of the anterior or posterior crossvein (ACV) with the campaniform sensillae shown by an arrow. Note the missing anterior crossvein in G (dpp-Gal4 driver), the partial anterior crossvein and abnormal posterior crossvein in J (en-Gal4 driver), and the relocation of the companiform sensillae from the anterior crossvein to the longitudinal vein in J.
Figure 5
Figure 5
Expression of hINSC96Y in different compartments produces a nonallometric reduction in wing size. (A and C) Control wings showing the regions used to quantify the effects of hINSC96Y expression. The red line denotes the border between the anterior (above) and posterior (below) compartments of the wing. en-GAL4 expresses in the posterior compartment. The five longitudinal wing veins are labeled L1–L5. The L2–L4 intervein sector is shadowed in green. dpp-GAL4 expresses in the L3–L4 intervein sector. (B) en genotypes: en-Gal4 (n = 13), en-Ga4/UAS-hINSWT (n = 13), and en-Gal4/UAS-hINSC96Y (n = 13). Values represent the ratio of the posterior wing compartment divided by the total wing area. (D) dpp genotypes: dpp-Gal4 (n = 10), dpp-Gal4/UAS-hINSWT (n = 10), and dpp-Gal4/UAS-hINSC96Y (n = 11). Values represent the ratio of the L3–L4 intervein sector divided by the L2–L4 intervein sector area. NS, not significant, Mann–Whitney U-test.
Figure 6
Figure 6
Genetic variation for hINSC96Y-induced degeneration in the adult eye and notum. (A) Variation in eye area in F1 adults from crosses between the GMR»hINSC96Y tester strain and 38 DGRP lines described in Materials and Methods. (B) Variation in bristle number in F1 adults from crosses between the ap»hINSC96Y tester strain and 38 DGRP lines. (C and D) Eye area and bristle number. The data are displayed from left to right by decreasing severity of phenotypes. Eye area (mean ± SE) for a wild-type control (GMR-Gal4 × w1118) is shown on the far right in solid circles (in C, only male wild-type eye areas are shown). (E) Correlation between bristle loss and eye area reduction (male, Spearman’s rank correlation ρ = −0.23, P = 0.16; female, ρ = −0.17, P = 0.30).
Figure 7
Figure 7
Genetic variation for eye area reduction in F1 adults from crosses between GMR>>hINSC96Y, Drop, or Lobe and 38 DGRP lines. (A) Range of phenotypes in F1 adults in both sexes. (B) Deviation (in units of within-line SD) of each line mean from the overall mean within each of the three sets of crosses. (C) Correlation of eye area reduction between hINSC96Y and Dr (open circles) or L (solid circles) × DGRP F1 males. (D) Box plots showing the unscaled distribution of phenotypes in the three sets of crosses [thick line, median; box, 25th and 75th percentiles; whisker, 1.5 interquartile range (IQR); circles, data outside the 1.5 IQR].

References

    1. Ayroles J. F., Carbone M. A., Stone E. A., Jordan K. W., Lyman R. F., et al. , 2009. Systems genetics of complex traits in Drosophila melanogaster. Nat. Genet. 41: 299–307. - PMC - PubMed
    1. Bedell M. A., Jenkins N. A., Copeland N. G., 1997a Mouse models of human disease. Part I: techniques and resources for genetic analysis in mice. Genes Dev. 11: 1–10. - PubMed
    1. Bedell M. A., Largaespada D. A., Jenkins N. A., Copeland N. G., 1997b Mouse models of human disease. Part II: recent progress and future directions. Genes Dev. 11: 11–43. - PubMed
    1. Bell G. I., Swain W. F., Pictet R., Cordell B., Goodman H. M., et al. , 1979. Nucleotide sequence of a cDNA clone encoding human preproinsulin. Nature 282: 525–527. - PubMed
    1. Benjamini Y., Hochberg Y., 1995. Controlling the false discovery rate: a practical and powerful approach to multiple testing. J Roy. Statist. Soc. Ser. B 57: 289–300.

Publication types

MeSH terms

Associated data