. 2014;13(3):482-90.
doi: 10.4161/cc.27275. Epub 2013 Nov 26.

Silencing of RB1 and RB2/P130 during adipogenesis of bone marrow stromal cells results in dysregulated differentiation

Affiliations

Silencing of RB1 and RB2/P130 during adipogenesis of bone marrow stromal cells results in dysregulated differentiation

Stefania Capasso et al. Cell Cycle. 2014.

Erratum in

  • Correction.
    [No authors listed] [No authors listed] Cell Cycle. 2020 Aug;19(16):2081. doi: 10.1080/15384101.2020.1795491. Epub 2020 Jul 17. Cell Cycle. 2020. PMID: 32677534 Free PMC article. No abstract available.

Abstract

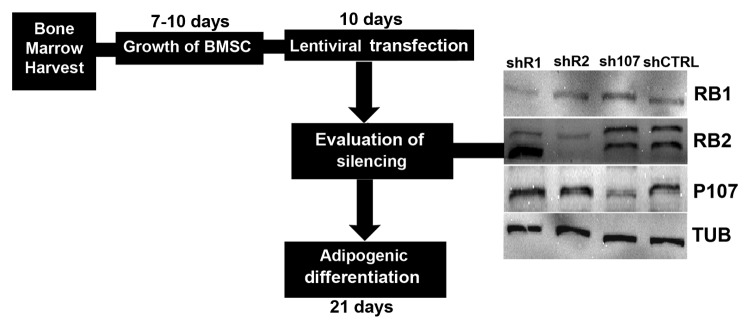
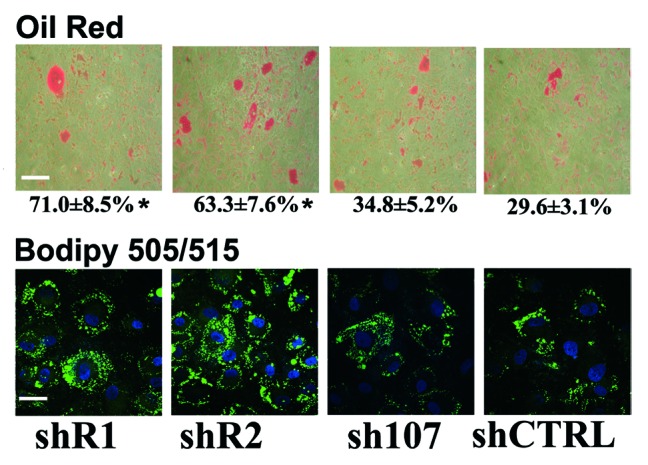
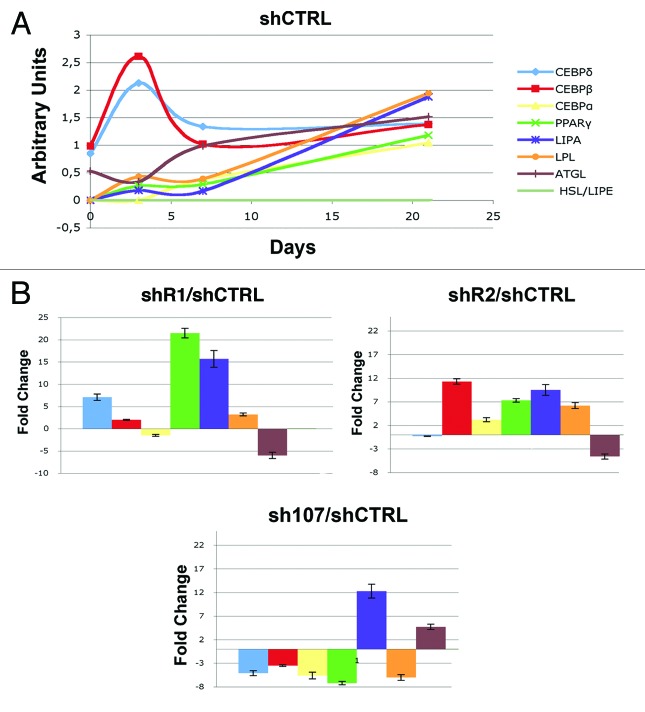
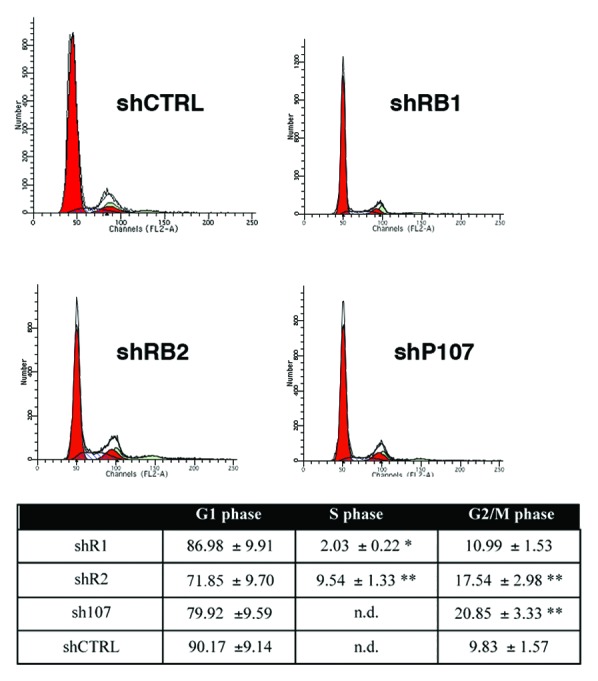
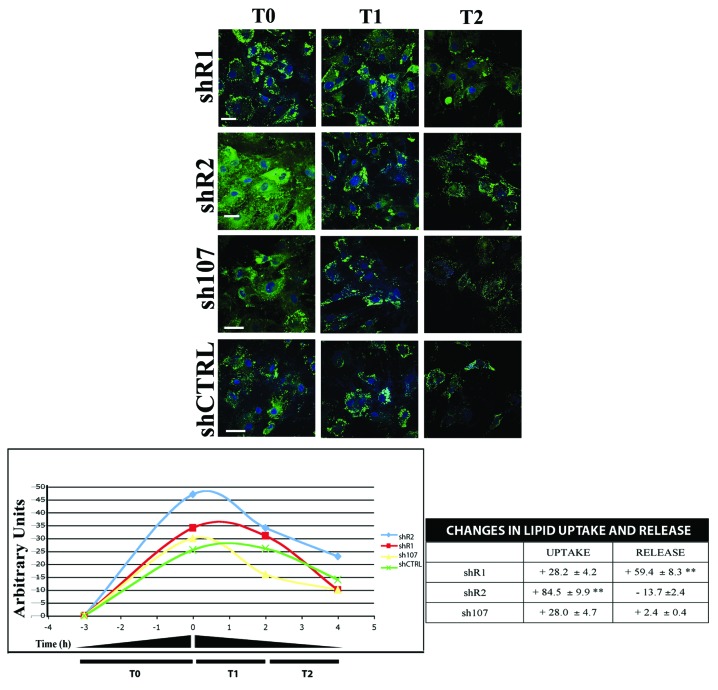
Bone marrow adipose tissue (BMAT) is different from fat found elsewhere in the body, and only recently have some of its functions been investigated. BMAT may regulate bone marrow stem cell niche and plays a role in energy storage and thermogenesis. BMAT may be involved also in obesity and osteoporosis onset. Given the paramount functions of BMAT, we decided to better clarify the human bone marrow adipogenesis by analyzing the role of the retinoblastoma gene family, which are key players in cell cycle regulation. Our data provide evidence that the inactivation of RB1 or RB2/P130 in uncommitted bone marrow stromal cells (BMSC) facilitates the first steps of adipogenesis. In cultures with silenced RB1 or RB2/P130, we observed an increase of clones with adipogenic potential and a higher percentage of cells accumulating lipid droplets. Nevertheless, the absence of RB1 or RB2/P130 impaired the terminal adipocyte differentiation and gave rise to dysregulated adipose cells, with alteration in lipid uptake and release. For the first time, we evidenced that RB2/P130 plays a role in bone marrow adipogenesis. Our data suggest that while the inactivation of retinoblastoma proteins may delay the onset of last cell division and allow more BMSC to be committed to adipocyte, it did not allow a permanent cell cycle exit, which is a prerequisite for adipocyte terminal maturation.

Keywords: adipocytes; bone marrow; differentiation; marrow stromal stem cells; retinoblastoma gene family.


Figures

None
Figure 1. Experimental plan. Bone marrows were collected from healthy patients, and mononuclear cell fractions were used to have bone marrow stromal cultures containing MSC. Cultures were propagated for 7–10 d. Then cultures were transduced with lentivirures carrying shRNAs targeting Retinoblastoma gene family. Cultures were then incubated in adipogenic differentiation media for 21 d and the differentiation process was evaluated. In the picture is shown western blot analysis of BMSC that were tested for RB1, RB2/P130, and P107 knockdown after lentiviral transductions and puromycin selection. Cell expressing shRNAs against RB1, RB2/P130, and P107 were indicated as shR1, shR2, and sh107, respectively. Cells expressing scrambled shRNAs were indicated as shCTRL. The RB2 lane shows 2 bands, which correspond to hyperphosphorylated inactivated form (upper band) and active form (lower band). The protein levels were normalized with respect to α-tubulin, the loading control.
None
Figure 2. BMSC differentiation into adipose cells. The picture shows representative microscopic fields of BMSC induced to differentiate into adipocytes and stained with Oil Red O or with Bodipy 505/515. Scale bar: 80 µM The percentage of Oil Red O-positive cells is indicated. Data are expressed as mean values with standard deviations (*P < 0.05). shR1, shR2, shP107 are cells with silenced RB1, RB2/P130, and P107, respectively. Control cultures are indicated as shCTRL. Scale bar: 30 µM.
None
Figure 3. RT-PCR expression analysis of early and late adipocyte differentiation markers. (A) The graph represents the expression follow-up of differentiation markers of BMSC induced to differentiate into adipocytes. mRNA levels were normalized with respect to GAPDH, which was chosen as an internal control. Data are expressed as arbitrary units. (B) In cells expressing either shR1, shR2, or sh107, the mRNA levels of genes under analysis were normalized with respect to GAPDH, chosen as internal control. The histogram shows the ratio of gene expression between treated and control cells (shCTRL). The mean expression values (± SD, n = 3; * P < 0.05) of each gene are presented. Data are expressed as arbitrary units.
None
Figure 4. Flow cytometry analysis. The table shows the percentage of differentiated BMSC in different cell cycle phases. Mean expression values of flow cytometry analysis are reported for cells expressing either shR1, shR2, sh107, shCTRL (± SD, n = 3; * P < 0.05; ** P < 0.01). n.d. means not detected. A representative flow cytometry analysis is shown for each experimental condition.
None
Figure 5. Uptake and release of FFAs Differentiated BMSC were serum-starved for 16 h, then cells were treated with 10 µM BODIPY FL C16 for 3 h (T0 starting point). Subsequently, cultures were incubated for 2 and 4 h (T1 and T2) with complete medium (α-MEM containing 10%FBS and bFGF) in presence of 3 µg/mL of ritrodrine chlorohydrate. The picture shows representative fields of BMSC containing fluorescent palmitate (BODIPY FL C16) at different time points. The graph shows the uptake levels of palmitate in different experimental conditions. Data are expressed as arbitrary units. The table shows the percentage of released palmitate that was calculated as the ratio between the BODIPY level at 2 or 4 h and the starting point (T1/T0 or T2/T0). Scale bar: 30 µM.

Comment in

References

    1. Devlin MJ. Why does starvation make bones fat? Am J Hum Biol. 2011;23:577–85. doi: 10.1002/ajhb.21202. - DOI - PMC - PubMed
    1. Rosen CJ, Ackert-Bicknell C, Rodriguez JP, Pino AM. Marrow fat and the bone microenvironment: developmental, functional, and pathological implications. Crit Rev Eukaryot Gene Expr. 2009;19:109–24. doi: 10.1615/CritRevEukarGeneExpr.v19.i2.20. - DOI - PMC - PubMed
    1. Kawai M, de Paula FJ, Rosen CJ. New insights into osteoporosis: the bone-fat connection. J Intern Med. 2012;272:317–29. doi: 10.1111/j.1365-2796.2012.02564.x. - DOI - PMC - PubMed
    1. Beyer Nardi N, da Silva Meirelles L. Mesenchymal stem cells: isolation, in vitro expansion and characterization. Handb Exp Pharmacol 2006:249-82. - PubMed
    1. Pittenger MF, Mackay AM, Beck SC, Jaiswal RK, Douglas R, Mosca JD, Moorman MA, Simonetti DW, Craig S, Marshak DR. Multilineage potential of adult human mesenchymal stem cells. Science. 1999;284:143–7. doi: 10.1126/science.284.5411.143. - DOI - PubMed

Publication types

Substances

LinkOut - more resources