. 2014 Jan 10;4(1):109-16.
doi: 10.1534/g3.113.007922.

Suppression of expression between adjacent genes within heterologous modules in yeast

Affiliations

Suppression of expression between adjacent genes within heterologous modules in yeast

Tae J Lee et al. G3 (Bethesda). .

Abstract

Recent studies have shown that proximal arrangement of multiple genes can have complex effects on gene expression. For example, in the case of heterologous gene expression modules, certain arrangements of the selection marker and the gene expression cassette may have unintended consequences that limit the predictability and interpretability of module behaviors. The relationship between arrangement and expression has not been systematically characterized within heterologous modules to date. In this study, we quantitatively measured gene expression patterns of the selection marker (KlURA3 driven by the promoter, pKlURA) and the gene expression cassette (GFP driven by the galactose-inducible GAL1 promoter, pGAL1) in all their possible relative arrangements in Saccharomyces cerevisiae. First, we observed that pKlURA activity depends strongly on the relative arrangement and the activity of pGAL1. Most notably, we observed transcriptional suppression in the case of divergent arrangements: pKlURA activity was reduced when pGAL1 was inactive. Based on our nucleosome occupancy data, we attribute the observed transcriptional reduction to nucleosome repositioning. Second, we observed that pGAL1 activity also depends on the relative arrangement of pKlURA. In particular, strains with divergent promoters showed significantly different pGAL1 activation patterns from other strains, but only when their growth was compromised by lack of uracil. We reasoned that this difference in pGAL1 activation patterns arises from arrangement-dependent pKlURA activity that can affect the overall cell physiology (i.e., cell growth and survival in the uracil-depleted condition). Our results underscore the necessity to consider ramifications of promoter arrangement when using synthetic gene expression modules.

Keywords: bidirectional promoter; coexpression; heterologous gene expression; nucleosome positioning.


Figures

Figure 1
Figure 1
Construction of all pairwise arrangements of heterologous gene expression modules. Our heterologous modules consist of two functionally unrelated genes: the KlURA3 gene from K. lactis with its own promoter (pKlURA) driving the downstream protein coding region (represented by the red box) with the native flanking region (represented by the red line) and the GAL1 promoter (pGAL1) driving the expression of GFP (represented by the green box) with the ADH1 terminator signal (represented by the green line). The length of each element (in bp) is indicated. These genes are adjacently placed in various arrangements: bidirectional (transcribing away from each other), serial (transcribing in the same direction), and convergent (transcribing in the opposite direction). The control strains consist of only the KlURA3 gene. These modules were integrated in both 5′ to 3′ (top row) and 3′ to 5′ directions (bottom row) into the budding yeast genome.
Figure 2
Figure 2
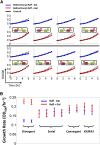
Modulation of pKlURA activity by galactose induction. After 24 hr of growth without uracil in the Gal or Gal+ condition, a small portion of cells were moved to fresh media on a 96-well plate and their growth at steady state was measured for 6 hr at 30-min intervals with a plate reader. (A) Growth curves, as measured by OD600, of the designated strains. Control strains grown in either condition are plotted as black lines with square boxes for comparison. The growth curves in the GAL or GAL+ conditions are denoted by blue or red lines with square boxes, respectively. A representative set of experiments is shown here. Additional set of growth experiments can be found in Figure S3. The top and bottom panels differ in the direction of genome integration. The growth curves reflect “raw” OD600 measurements on a plate reader and are not corrected by the baseline OD600. (B) Growth rates extracted from the growth curves. The error bars represent at least three independently measured growth rates. The growth rates in the Gal or Gal+ condition are denoted by blue or red squares, respectively.
Figure 3
Figure 3
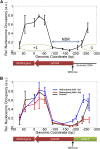
Repositioning of nucleosomes over pKlURA in the bidirectional strain. The standard nucleosome scanning assay (Infante et al. 2012) with micrococcal nuclease was used to isolate and purify mononucleosomal DNA. This mononucleosomal DNA was used to measure the relative nucleosome occupancy at the designated genomic positions. (A) The nucleosome occupancy in the control strain over pKlURA in Gal condition is plotted. The nucleosome-depleted region (NDR) is indicated by the blue arrow. The green ovals denote strongly positioned nucleosomes (+1 and −1) around the NDR. The KlURA3 promoter region and the downstream protein-coding region are indicated by the red arrow and the red box, respectively. (B) The nucleosome occupancy in the bidirectional strain is mapped in Gal (red) and Gal+ (blue) conditions. The nucleosome occupancy in the control strain is overlaid for comparison (black). In both plots, the x-axis represents the genomic coordinate relative to the start codon (ATG) of the KlURA3 gene. The pGAL1 region is denoted by the green arrow. Error bars represent three independent measurements of relative nucleosome occupancy.
Figure 4
Figure 4
Unique GFP patterns in bidirectional strains. After 24 hr of growth in various galactose concentrations (0%, 0.05%, 0.2%, and 0.5%), cells were washed, fixed, and measured for their GFP intensity with flow cytometry. GFP histograms of the designated strains grown in the absence (top) or presence (bottom) of uracil are shown. Each histogram represents the GFP measurement of 50,000 cells.

References

    1. Acar M., Becskei A., Van Oudenaarden A., 2005. Enhancement of cellular memory by reducing stochastic transitions. Nature 435: 228–232. - PubMed
    1. Acar M., Pando B. F., Arnold F. H., Elowitz M. B., Van Oudenaarden A., 2010. A general mechanism for network-dosage compensation in gene circuits. Science 329: 1656–1660. - PMC - PubMed
    1. Adhya S., Gottesman M., 1982. Promoter occlusion: transcription through a promoter may inhibit its activity. Cell 29: 939–944. - PubMed
    1. Bae J. Y., Laplaza J., Jeffries T. W., 2008. Effects of gene orientation and use of multiple promoters on the expression of XYL1 and XYL2 in Saccharomyces cerevisiae. Appl. Biochem. Biotechnol. 145: 69–78. - PubMed
    1. Batada N. N., Urrutia A. O., Hurst L. D., 2007. Chromatin remodelling is a major source of coexpression of linked genes in yeast. Trends Genet. 23: 480–484. - PubMed

Publication types

MeSH terms

LinkOut - more resources