. 2013 Dec 10;110(50):E4821-30.
doi: 10.1073/pnas.1320101110. Epub 2013 Nov 26.

Characterization of the human ESC transcriptome by hybrid sequencing

Affiliations

Characterization of the human ESC transcriptome by hybrid sequencing

Kin Fai Au et al. Proc Natl Acad Sci U S A. .

Abstract

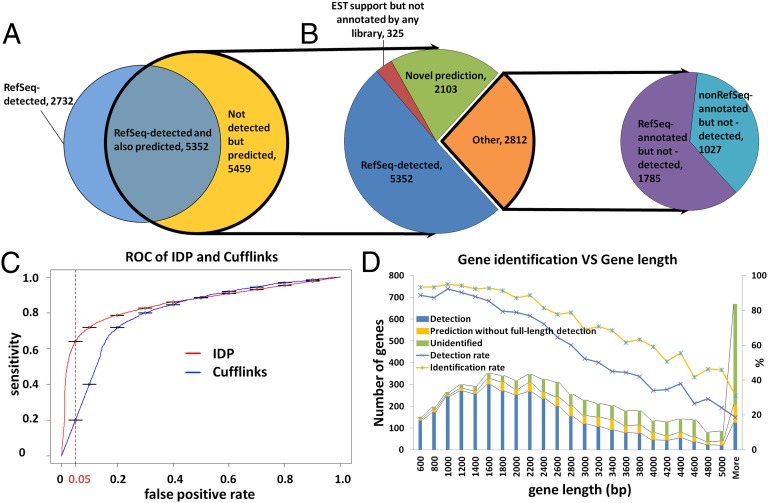
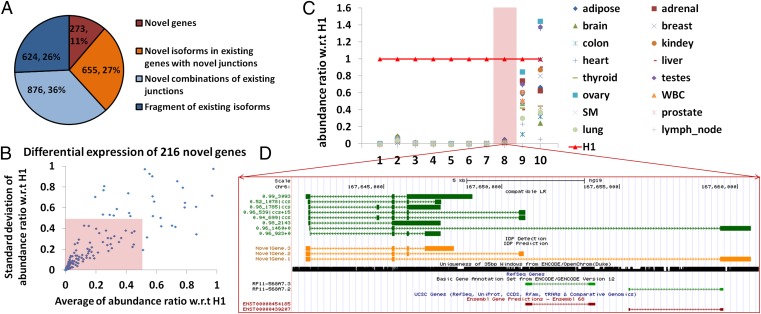
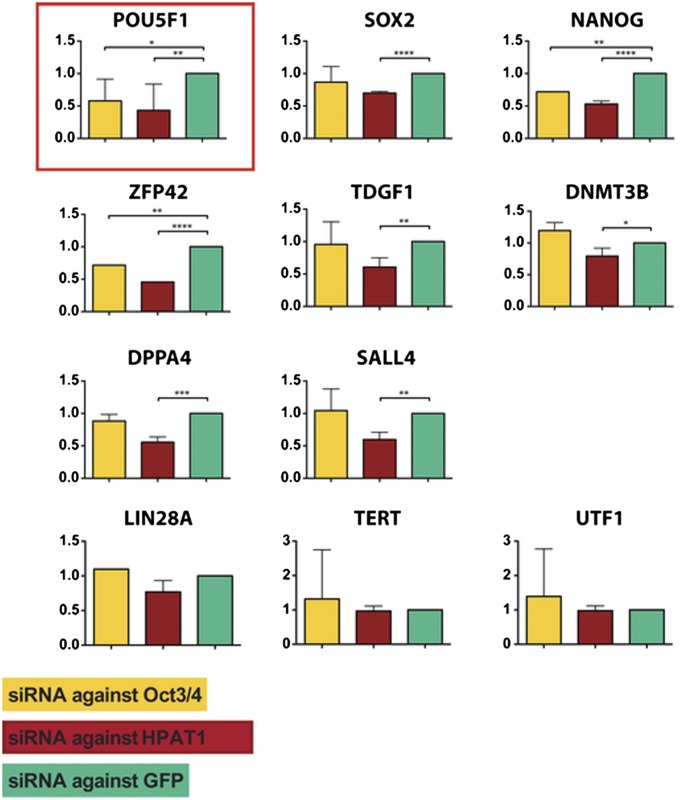
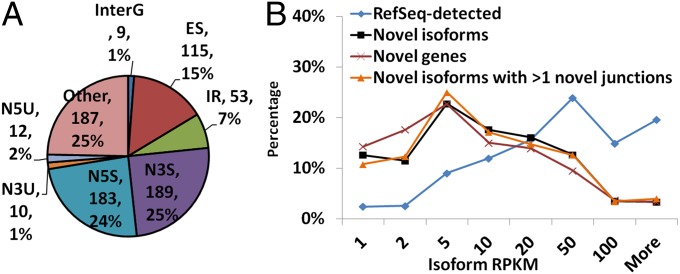
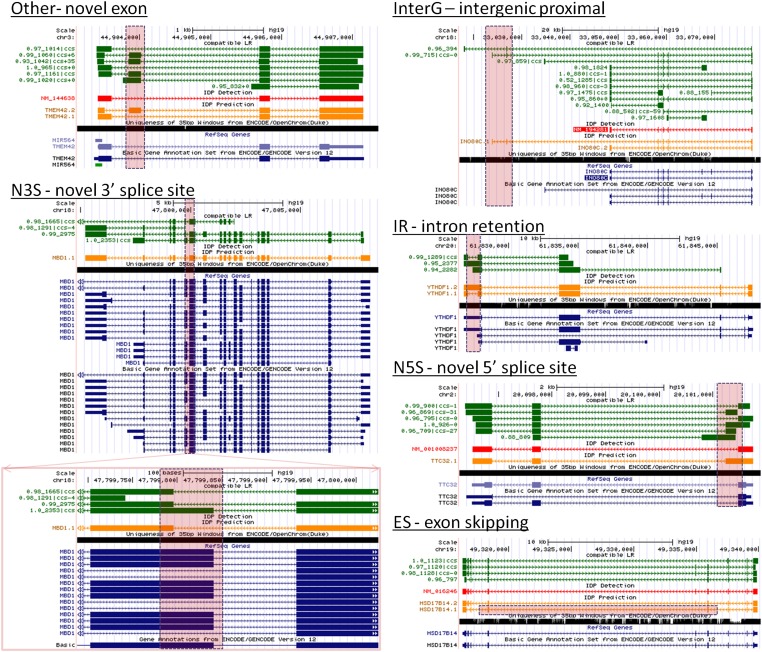
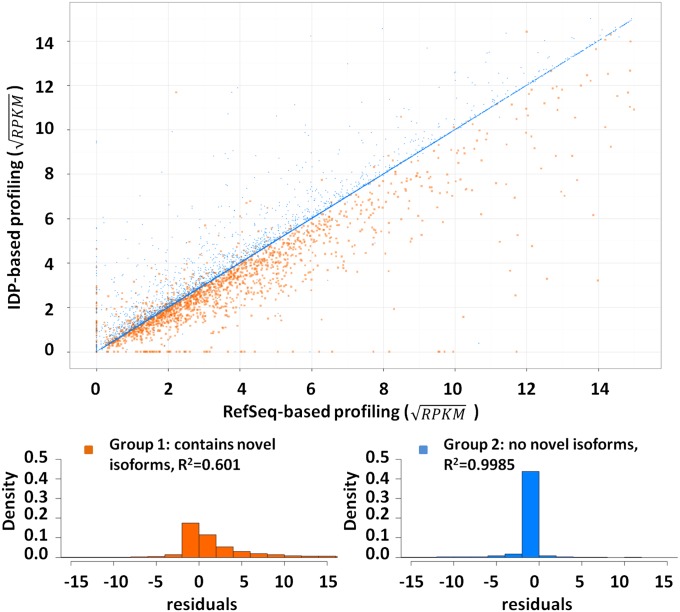
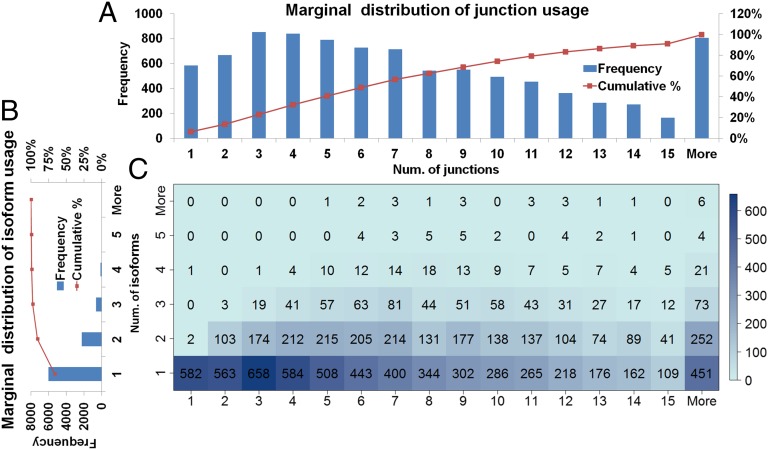
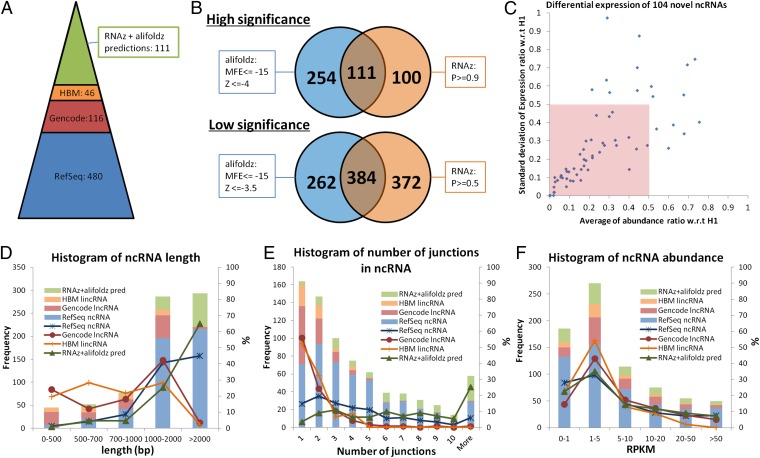
Although transcriptional and posttranscriptional events are detected in RNA-Seq data from second-generation sequencing, full-length mRNA isoforms are not captured. On the other hand, third-generation sequencing, which yields much longer reads, has current limitations of lower raw accuracy and throughput. Here, we combine second-generation sequencing and third-generation sequencing with a custom-designed method for isoform identification and quantification to generate a high-confidence isoform dataset for human embryonic stem cells (hESCs). We report 8,084 RefSeq-annotated isoforms detected as full-length and an additional 5,459 isoforms predicted through statistical inference. Over one-third of these are novel isoforms, including 273 RNAs from gene loci that have not previously been identified. Further characterization of the novel loci indicates that a subset is expressed in pluripotent cells but not in diverse fetal and adult tissues; moreover, their reduced expression perturbs the network of pluripotency-associated genes. Results suggest that gene identification, even in well-characterized human cell lines and tissues, is likely far from complete.

Keywords: PacBio; alternative splicing; hESC transcriptome; isoform discovery; lncNRA.


Conflict of interest statement

The authors declare no conflict of interest.

Figures

Fig. 1.
Fig. 1.
Gene isoform detection and prediction of hESCs (H1 cell line) by IDP. (A) Venn diagram of IDP detections and predictions (see introductory section for definition of detection and prediction). A total of 8,084 RefSeq isoforms are detected and highlighted in blue. A total of 10,811 predictions are highlighted in yellow and outlined with a thick black line. A total of 5,352 detections of RefSeq isoforms are also predicted by IDP. (B). Pie chart of annotated isoforms and novel isoforms in IDP predictions. IDP predictions rescue 1,785 RefSeq-annotated isoforms (in purple) that cannot be detected directly at full length. In addition, there are 1,027 predictions that are not annotated in RefSeq but are found in Ensembl, Known Genes, or GENCODE (cyan). Finally, 2,428 novel isoforms (green and red) are identified, 325 of which have EST support (red). (C) ROC performance analysis of IDP and Cufflinks. IDP predictions have much higher sensitivity in the acceptable FPR range from 5% to 10%. When FPR is controlled to 5%, the IDP prediction sensitivity is as high as ∼62%, whereas the corresponding Cufflinks sensitivity is only about 20%. (D) RefSeq gene identification rate decreases with the gene length. Combining detections and predictions, the overall identification rate by IDP is ∼73% (yellow line with blue star markers). IDP prediction rescues a significant number of isoforms from long genes that are not directly detected.
Fig. 2.
Fig. 2.
Novel gene identifications. (A) A total of 2,428 novel isoforms are categorized according to the use of the annotated junctions. A total of 273 isoforms from 216 novel genes are observed (in brown). A total of 655 novel isoforms use at least one junction from annotated genes (in orange). A total of 876 novel isoforms are novel combinations of annotated junctions. Six hundred twenty-four are fragments of annotated isoforms. (B) Differential expression of 216 novel genes in H1. The abundance ratio of a novel gene in a given tissue is defined as its abundance in this tissue divided by its abundance in H1. One hundred forty-six novel genes (68%, inside the pink box) have an averaged abundance (among 16 human tissues) ratio smaller than 0.5 with SD smaller than 0.5. (C) Relative expression levels of the top 10 novel genes (10 highest expressions in hESCs) in 16 human tissues. The reference expression levels are expressions in hESCs (highlighted in red line with triangles). Eight novel genes have high expression specifically in hESCs (example 8 in D) whereas the other 2 have significant expression across many different tissues. The gene structure of the eighth novel gene is visualized in D. (D) Novel gene at chr6:167,641,267–167,660,912. The dark green track shows the nonredundant long reads, each of which represents an alignment. The arrow refers to the alignment of the read relative to the reference (i.e., aligned to reference or to reverse complement of reference) and is not the direction of transcription. The naming of nonredundant long reads is A_B|ccs ± D, where A is the percentage identity of BLAT alignment, B is the length of alignment, and D is the distance between the mappable part of the long read and the polyA/polyT detection (“+” is the forward strand and downstream whereas “−” is the reverse strand and upstream). PacBio circular consensus sequence (CCS) reads are labeled with “ccs”. The orange track shows IDP predictions. The 35-bp mappability of this locus is in black. The light green track is GENCODE annotation and the brown one is Ensembl. RefSeq (light purple track) and UCSC Genes are also displayed but they have no annotated genes in this locus and thus no IDP detections (referenced to RefSeq, red track) are displayed either. The track display settings of other figures are the same.
Fig. 3.
Fig. 3.
Gene expression validation of HPAT. (A) Gene expression analysis by qPCR was performed on two hESC samples (H1 and H9), one iPSC line (RIPSC.HUF1), and a collection of cDNAs from fetal and adult tissues. (B) Gene expression profiling of HPAT genes in single blastomeres of eight-cell embryos and blastocysts. E1 and E2 denote the embryos from which blastomeres were isolated. (C) Reactivation of genes during the reprogramming process. Cells were analyzed at different time points of mRNA-mediated iPSCs derivation.
Fig. 4.
Fig. 4.
Functional effect of down-regulation of HPAT genes. Gene expression analysis by qPCR of different pluripotency-associated genes after down-regulation of GFP (negative control, in green), OCT4 (positive control, in yellow), and HPAT1 (in red). siRNAs for GFP and HPAT1 were derived by in vitro dicer-mediated digestion of the corresponding double-stranded mRNAs; siRNAs for OCT4 were designed in silico. Analysis was performed 24 h after the transfection.
Fig. 5.
Fig. 5.
Novel isoform identifications. (A) Pie chart of different novel junction types in 655 novel isoforms of existing genes. N5U, novel 5′-UTR; N3U, novel 3′-UTR; N5S, novel 5′-splice site; N3S, novel 3′-splice site; IR, intron retention; ES, exon skipping; InterG, intergenic proximal. Examples are in Fig. 6. (B) Abundance distributions of novel isoform predictions and annotated detections. Approximately 35% novel isoforms have RPKM >10.
Fig. 6.
Fig. 6.
Novel isoforms of existing genes with six different types of novel junctions. The genome browser setting is the same as in Fig. 2D. The GENCODE annotation is in the dark blue track. The novel junction uses are highlighted by a pink dashed box and are not reported by existing annotations but are supported by both long reads and short reads. Other: a novel exon in novel isoform TMEM142.2 is detected with two novel flanking junctions that are categorized in the “Other” group in Fig. 2C. InterG: A novel junction in novel isoform INO80C.1 is categorized as “intergenic proximal” junctions from annotated genes, but is a 3′-end junction of a novel isoform of INO80C (note that this gene is in the reverse strand). IR: A novel junction in novel isoform YTHDF1.1 indicates a splice within an annotated exon; i.e., the RefSeq annotation has a retained intron relative to YTHDF1.1. N3S: A novel junction in novel isoform MBD1.1 has a novel 3′-splice site (note that this gene is in the reverse strand). N5S: A novel junction in novel isoform TTC32.1 has a novel 5′-splice site (note that this gene is in the reverse strand). ES: Novel isoform HSD17B14.1 contains a novel junction that skips an annotated exon.
Fig. 7.
Fig. 7.
Isoform abundance estimation by IDP-identified hESC transcriptome and RefSeq annotation. The gene abundances of “common isoforms” (main text) are rescaled by a square-root transformation. The genes without novel isoforms (group 2) have stable abundance estimation and have high R2 of 0.9985 in linear regression (blue dots). In contrast, novel isoforms found in existing genes lead to a large range of abundance corrections. The residuals of linear regression show different distributions between the two groups. Group 1 (genes with novel isoforms) is highlighted in orange and group 2 in blue. The residuals of group 2 concentrate around 0, which indicates a small difference between two computations. However, group 1 has a heavy tail at the positive range. That is, most abundances of group 1 are corrected to lower values because the SGS reads must be shared with novel isoforms.
Fig. 8.
Fig. 8.
(A) Marginal distributions of numbers of junction use. (B) Marginal distributions of numbers of isoform use. (C) Joint distribution displayed as heat map of number of genes by number of junctions and number of isoforms. The numbers of genes are given in each bin. Most genes express only one to two isoforms. Note that the number of junctions and the number of expressed isoforms within a gene have no significant correlation.
Fig. 9.
Fig. 9.
Noncoding RNA identification: the distributions of length, number of junctions, and abundance. (A) Annotated ncRNA identifications and novel ncRNA predictions. A total of 480 multiexon RefSeq-annotated ncRNAs are identified from H1. After filtering out RefSeq isoforms, the remaining IDP output contains 116 GENCODE-annotated lncRNAs. After filtering out RefSeq and GENCODE isoforms, 46 HBM lincRNAs are identified. The intersection of high-significance RNAz and alifoldz predictions of the remaining novel isoforms contains 111 putative ncRNAs. (B) RNAz and alifoldz are used to identify the ncRNA from 2,428 isoform predictions. Two stringency levels are suggested by the developers. For all subsequent analyses, we use the intersection of the high-stringency outputs from the two methods as our predicted ncRNAs. (C) Differential expressions of 104 novel ncRNAs w.r.t. H1. Seven of 111 novel ncRNA predictions are not included, because of insufficient short-read coverage in H1. Fifty novel ncRNAs (inside the pink box) have an averaged abundance ratio smaller than 0.5 with SD smaller than 0.5. (D) Length distribution of IDP-identified isoforms of RefSeq ncRNA, GENCODE lncRNA, HBM lincRNA, and RNAz/alifoldz predictions. (E) Distribution of number of junctions of IDP-identified isoforms of RefSeq ncRNA, GENCODE lncRNA, HBM lincRNA, and RNAz/alifoldz predictions. (F) Abundance distribution of IDP-identified isoforms of RefSeq ncRNA, GENCODE lncRNA, HBM lincRNA, and RNAz/alifoldz predictions.

Similar articles

Cited by

References

    1. Mortazavi A, Williams BA, McCue K, Schaeffer L, Wold B. Mapping and quantifying mammalian transcriptomes by RNA-Seq. Nat Methods. 2008;5(7):621–628. - PubMed
    1. Wang Z, Gerstein M, Snyder M. RNA-Seq: A revolutionary tool for transcriptomics. Nat Rev Genet. 2009;10(1):57–63. - PMC - PubMed
    1. Ingolia NT, Ghaemmaghami S, Newman JRS, Weissman JS. Genome-wide analysis in vivo of translation with nucleotide resolution using ribosome profiling. Science. 2009;324(5924):218–223. - PMC - PubMed
    1. Mitchell JA, et al. Nuclear RNA sequencing of the mouse erythroid cell transcriptome. PLoS ONE. 2012;7(11):e49274. - PMC - PubMed
    1. Li M, et al. Widespread RNA and DNA sequence differences in the human transcriptome. Science. 2011;333(6038):53–58. - PMC - PubMed

Publication types

MeSH terms

Substances

Associated data