. 2013 Nov 25;8(11):e80823.
doi: 10.1371/journal.pone.0080823. eCollection 2013.

A potential benefit of albinism in Astyanax cavefish: downregulation of the oca2 gene increases tyrosine and catecholamine levels as an alternative to melanin synthesis

Affiliations

A potential benefit of albinism in Astyanax cavefish: downregulation of the oca2 gene increases tyrosine and catecholamine levels as an alternative to melanin synthesis

Helena Bilandžija et al. PLoS One. .

Abstract

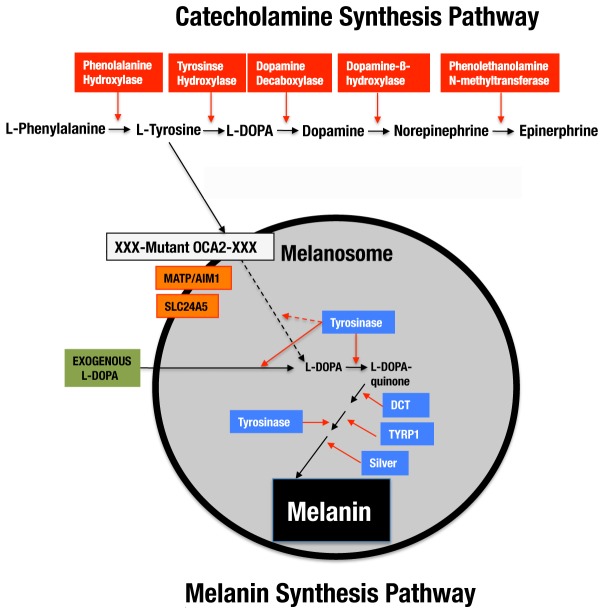
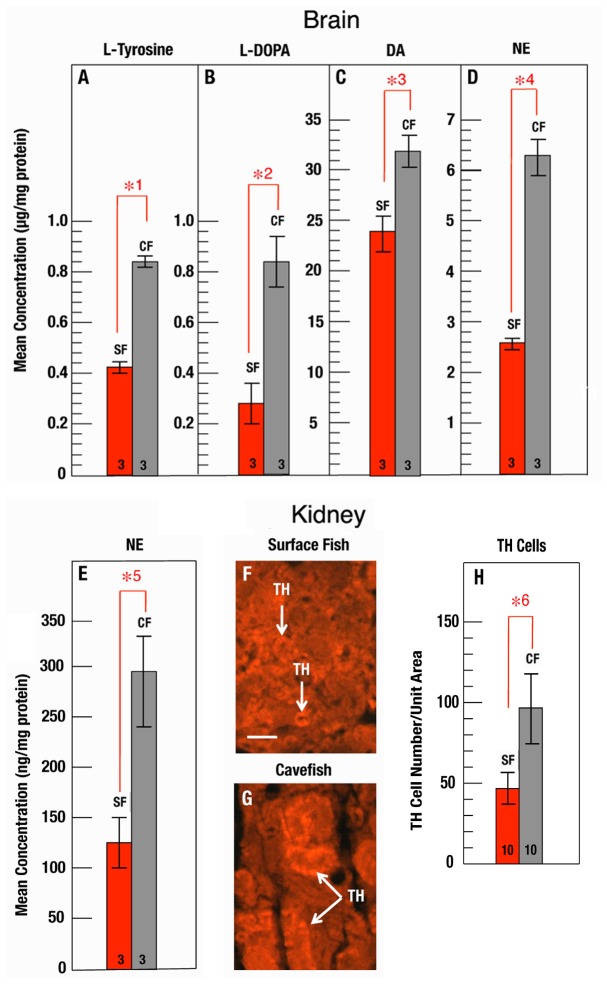
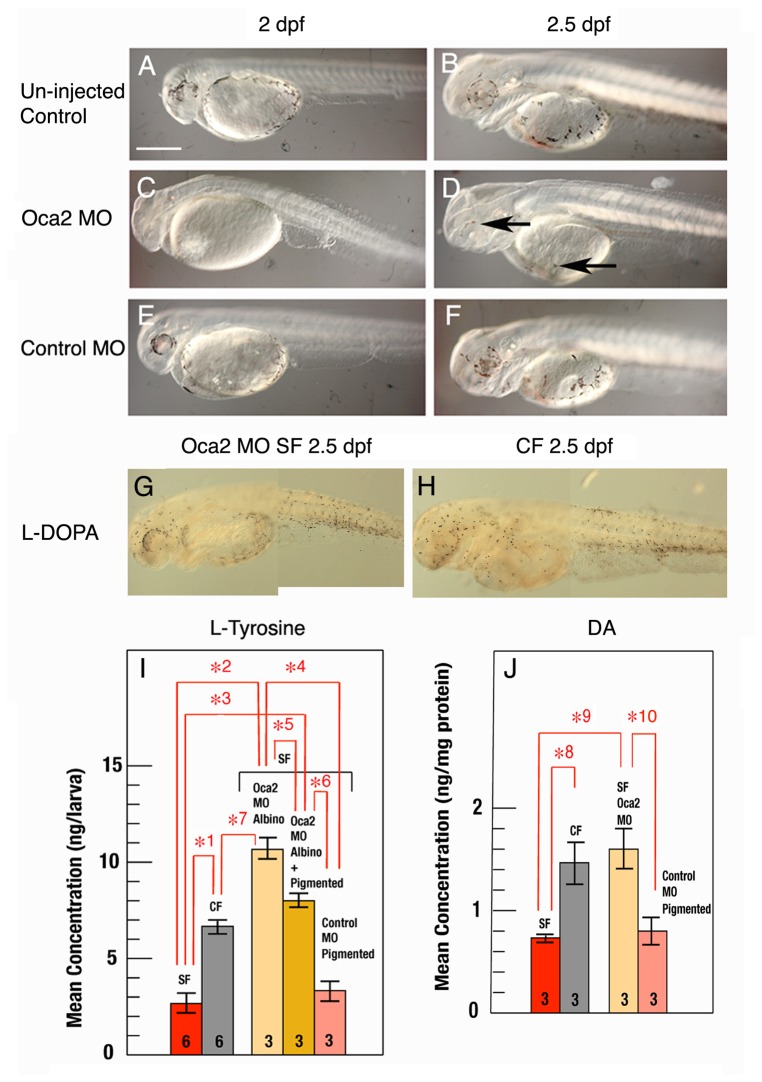
Albinism, the loss of melanin pigmentation, has evolved in a diverse variety of cave animals but the responsible evolutionary mechanisms are unknown. In Astyanax mexicanus, which has a pigmented surface dwelling form (surface fish) and several albino cave-dwelling forms (cavefish), albinism is caused by loss of function mutations in the oca2 gene, which operates during the first step of the melanin synthesis pathway. In addition to albinism, cavefish have evolved differences in behavior, including feeding and sleep, which are under the control of the catecholamine system. The catecholamine and melanin synthesis pathways diverge after beginning with the same substrate, L-tyrosine. Here we describe a novel relationship between the catecholamine and melanin synthesis pathways in Astyanax. Our results show significant increases in L-tyrosine, dopamine, and norepinephrine in pre-feeding larvae and adult brains of Pachón cavefish relative to surface fish. In addition, norepinephrine is elevated in cavefish adult kidneys, which contain the teleost homologs of catecholamine synthesizing adrenal cells. We further show that the oca2 gene is expressed during surface fish development but is downregulated in cavefish embryos. A key finding is that knockdown of oca2 expression in surface fish embryos delays the development of pigmented melanophores and simultaneously increases L-tyrosine and dopamine. We conclude that a potential evolutionary benefit of albinism in Astyanax cavefish may be to provide surplus L-tyrosine as a precursor for the elevated catecholamine synthesis pathway, which could be important for adaptation to the challenging cave environment.


Conflict of interest statement

Competing Interests: The authors have declared that no competing interests exist.

Figures

Figure 1
Figure 1. The relationship between the catecholamine and melanin synthesis pathways in Astyanax cavefish.
The combined pathways begin with the essential amino acid L-phenylalanine, which is converted to L-tyrosine by phenylalanine hydroxylase. L-tyrosine is then converted to L-DOPA either in the catechoamine synthesis pathway (above) or the melanin synthesis pathway (below). The melanin synthesis pathway begins after transport of L-tyrosine into the melanosome (gray sphere) and involves several enzymes (blue boxes) and other gene products (orange boxes) coding for putative transporter proteins essential for melanin synthesis. In albino cavefish, a mutated oca2 gene (white box with XXX) affects the first step of the pathway prior to tyrosinase function and prevents melanin synthesis. The defect caused by oca2 loss of function can be rescued by exogenous L-DOPA (green box) [14]. Solid lines: steps that occur in surface fish and in cavefish after L-DOPA rescue of melanogenesis. Dashed lines: steps that are absent in cavefish.
Figure 2
Figure 2. L-tyrosine, L-DOPA and CAT levels in surface fish and cavefish.
A-H. L-tyrosine (A, E), L-DOPA (B, F), dopamine (DA; C, G), and norepinephrine (NE; D, H) levels were determined by HPLC at 10 (A-D) and 30 (E-H) dpf in surface fish (red bars) and cavefish (gray bars). The histograms show the mean concentration per larva or adult in lysates (N at base of each bar) each containing 50 animals. Error bars: standard deviation. Red brackets with numbered asterisks indicate significant differences. Statistical analysis was done using Student’s t text. *1: p = 0.000. * 2: p = 0.014. *3: p = 0.001, and *4: p = 0.000. Bars without red brackets and asterisks indicate no significant differences. I. Summary of larval and adult L-tyrosine, DA, and NE levels shown on the same scale.
Figure 3
Figure 3. L-Tyrosine, L-DOPA, and CAT levels in adult brains and kidneys.
A-D. L-tyrosine (A), L-DOPA (B), DA (C), and NE (D) levels were determined by HPLC of lysates prepared from isolated surface fish (red bars) and cavefish (gray bars) brains. E. NE levels were determined by ELISA of lysates prepared from isolated surface fish (red bar) and cavefish (gray bar) kidneys. Immunostaining of sectioned surface fish (F) and cavefish (G) kidneys with TH antibody shows NE containing cells (arrows) in cavefish and surface fish. Scale bar: 10µm. H. Quantification of TH-staining cells in sections of surface fish (red bar) and cavefish (gray bar) kidneys. N is shown at the base of each bar. Errors bars: standard deviation. Statistical analysis was done using Student’s t text with significant differences depicted by red brackets with numbered asterisks. *1: p = 0.000. * 2: p = 0.011. *3: p = 0.021. *4: p = 0.000. *5: p = 0.003, and *6: p = 0.000.
Figure 4
Figure 4. Expression and localization of oca2 mRNA during early Astyanax development.
A. Downregulation of oca2 transcript levels in cavefish (CF) relative to surface fish (SF) at 40 hours post-fertilization determined by RT-PCR amplification of a 975 bp sequence in the middle of the oca2 coding region. B-W. Localization of oca2 mRNA in surface fish embryos and larvae (B-P) and oca2 mRNA downregulation in cavefish embryos and larvae (Q-W) determined by in situ hybridization. B-I. Surface fish embryos viewed from the lateral (B, D, F, H) and dorsal-rostral (C, E, G, I) sides showing oca2 expression located bilaterally in cells adjacent to the dorsal midline at 12 (B, C), 13.5 (D, E), 14 (F, G) and 22 (H, I) hpf. J-N. Embryos viewed from the lateral side at 25 (J, K) and 60 (M, N) hpf. Diagonal line in K represents the approximate location of the section shown in L. M. A 60 hpf embryo raised in PTU with arrows showing from left to right oca2 expression in eyes, otic and pharyngeal regions, yolk sac, trunk dorsal region, and trunk ventral region respectively. N. Higher resolution image of an oca2 stained 60 hpf embryo showing the pigmented eye. O. Section through a 60 hpf oca2 stained embryo showing pigmentation in the RPE. P. Section through a 60 hpf PTU treated embryo showing oca2 staining in the unpigmented RPE. Q-W. Cavefish embryos viewed from a lateral side at 10 (Q), 13 (R), 13.5 (S), 14 (T), 28 (U), and 40 (V, W) hpf. Arrows in L, M, O, P and W show cells expressing oca2 mRNA. Scale bar in B is 250 µm; magnification is the same in B-J, M, and Q-W. K and W represent 2X magnifications of J and V respectively. Scale bar in L is 125 µm. Scale bars in N and O are 250 µm: magnification is the same in O and P.
Figure 5
Figure 5. Knockdown of oca2 affects melanophore development and increases L-tyrosine and DA in surface fish.
A-F. The effects of morpholino (MO) mediated oca2 knockdown on melanophore development in surface fish. A, B. In un-injected embryos eye and body pigmentation is present at 2 and 2.5 dpf. C, D. In embryos injected with 400 pg oca2 MO, pigmented melanophores are absent at 2 dpf (C) and in most larvae at 2.5 dpf; D shows a morphant larva in which lightly colored melanophores (arrows) have started to appear in a small subset of oca2 MO injected morphants at 2.5 dpf. E, F. In embryos injected with 400 pg control MO, melanophore development was similar to un-injected embryos. G, H. Composite photographs showing melanin synthesis rescue by L-DOPA in oca2 morphant embryos (G) and in cavefish at 2.5 dpf (H). Scale bar in A is 500 µm; magnification is the same in A-H. I. HPLC analysis of L-tyrosine levels in lysates containing 50 3.5 dpf surface fish larvae (red bar), cavefish larvae (gray bar), pure albino oca2 morphant larvae (pale yellow bar; oca2 MO albino), a mixture of albino and a small number of lightly pigmented oca2 morphant larvae (see D) (gold bar; oca2 MO albino + pigmented), and pigmented control morphant larvae (pink bar: control MO pigmented). J. ELISA analysis of DA levels in lysates containing 50-100 2.5 dpf surface fish (red bar), cavefish (gray bar), albino oca2 morphant larvae (pale yellow bar), and pigmented control morphant larvae (pink bar) at 2.5 dpf. N is shown by the numbers at the base of each bar. Error bars: standard deviation. Statistical analysis was done by the One Way ANOVA test. Significant differences are indicated by red brackets with numbered asterisks: *1,*2, *3, *4, *6, *7: p = < 0.001; *5 p < 0.01: *8, *9, *10 p = < 0.05.

References

    1. Sugumaran M (2002) Comparative biochemistry of eumelanogenesis and the protective roles of phenoloxidase and melanin in insects. Pigment Cell Res 15: 2–9. doi: 10.1034/j.1600-0749.2002.00056.x. PubMed: 11837452. - DOI - PubMed
    1. Protas ME, Patel NH (2008) Evolution of coloration patterns. Annu Rev Cell Dev Biol 24: 425–446. doi: 10.1146/annurev.cellbio.24.110707.175302. PubMed: 18593352. - DOI - PubMed
    1. Baldwin E, Beatty RA (1941) The pigmentation of cavernicolous animals I. The pigments of some isopod crustacea. J Exp Biol 18: 136–143.
    1. Jeffery WR (2006) Regressive evolution of pigmentation in the cavefish Astyanax . ISR J Ecol Evol 52: 405–422. doi: 10.1560/IJEE_52_3-4_405. - DOI
    1. Protas M, Jeffery WR (2012) Evolution and development in cave animals: from fish to crustaceans. Wiley Interdiscip. Rev Dev Biol 1: 823–845. - PMC - PubMed

Publication types

Supplementary concepts

LinkOut - more resources