Review
. 2011 Dec;1(1):57-70.
doi: 10.3978/j.issn.2223-3652.2011.09.03.

QCA, IVUS and OCT in interventional cardiology in 2011

Affiliations
Review

QCA, IVUS and OCT in interventional cardiology in 2011

Johan H C Reiber et al. Cardiovasc Diagn Ther. 2011 Dec.

Abstract

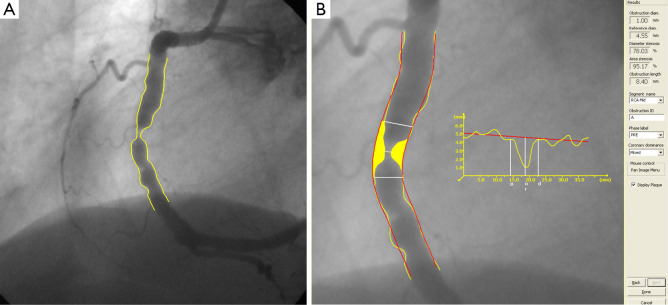
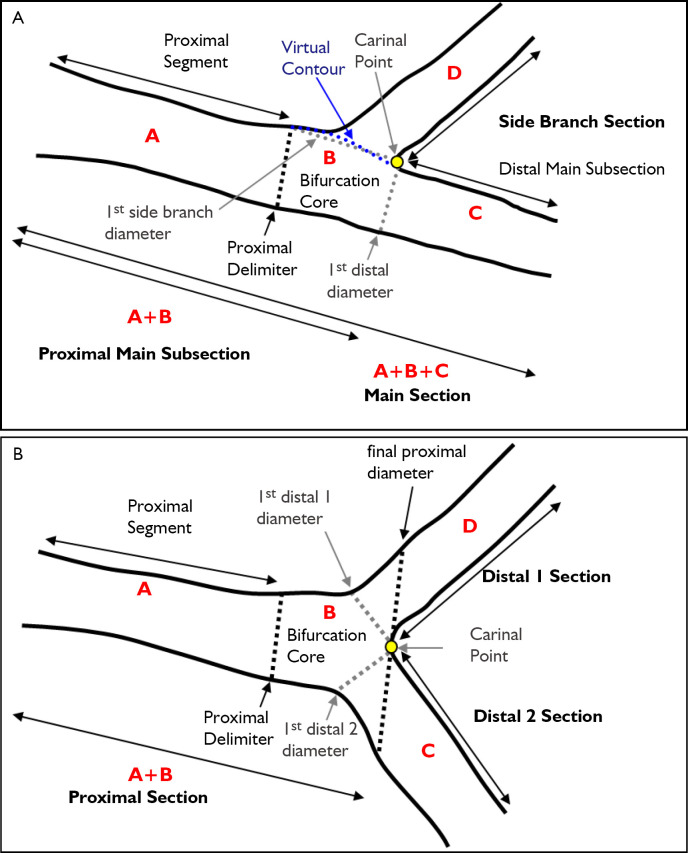
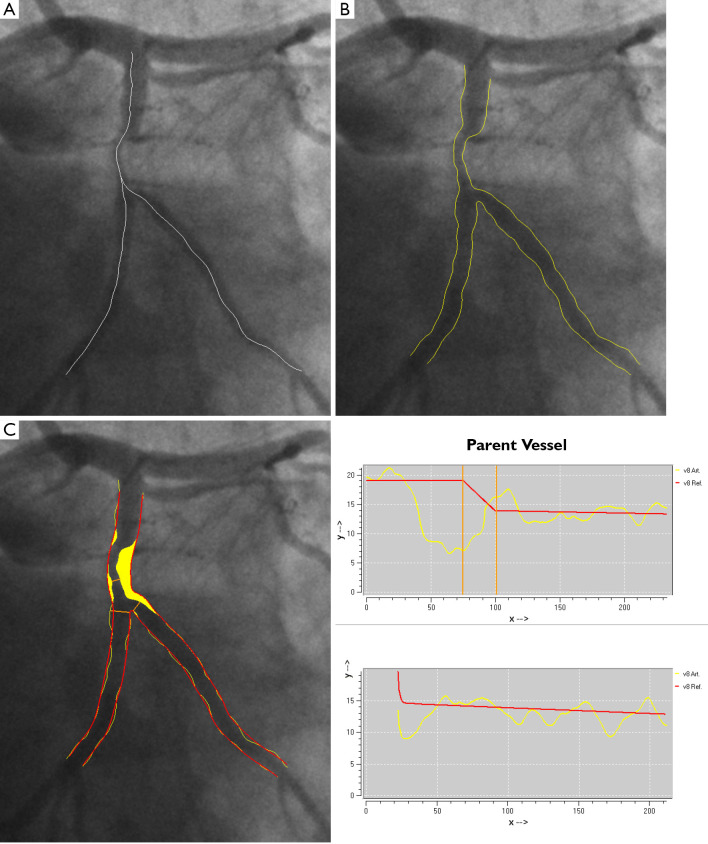
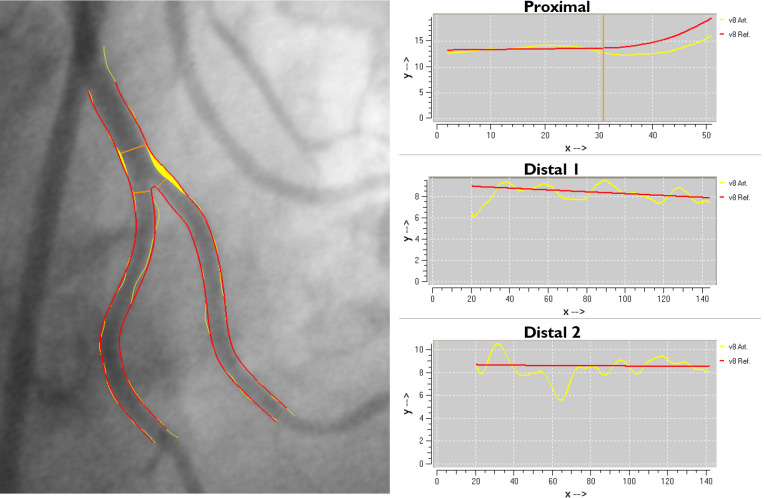
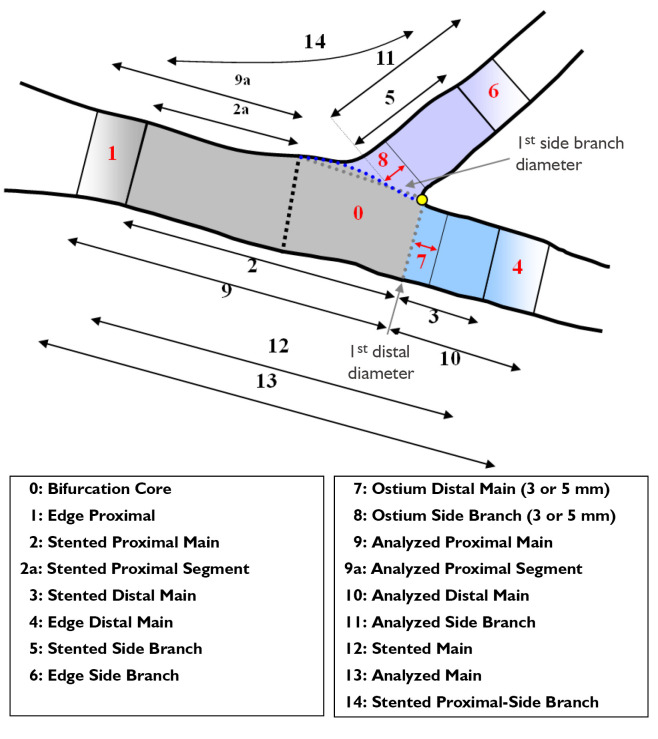
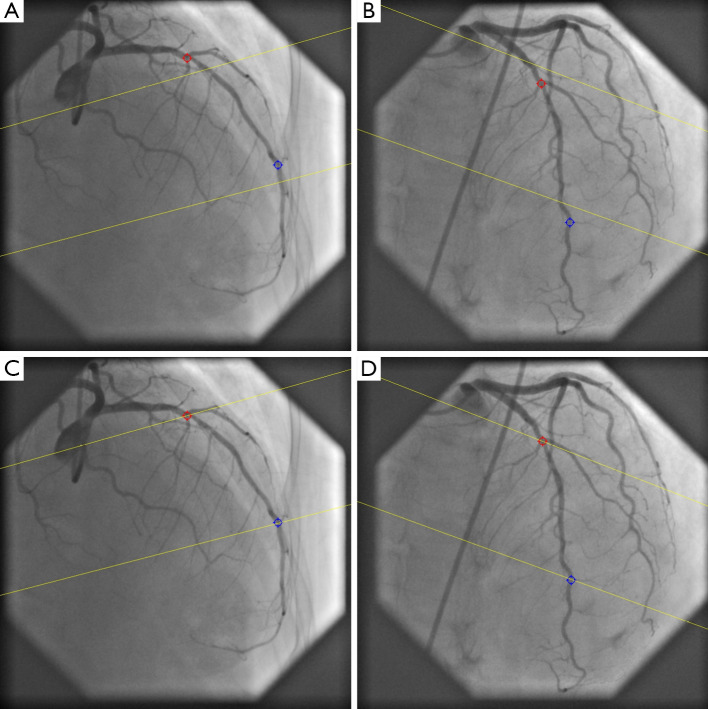
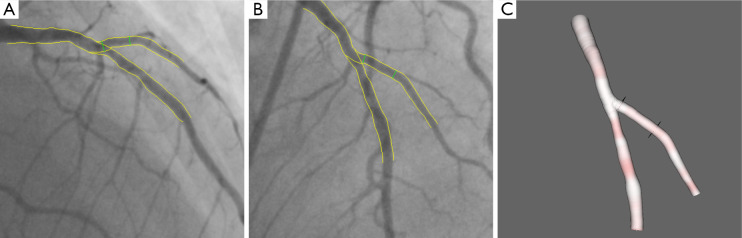
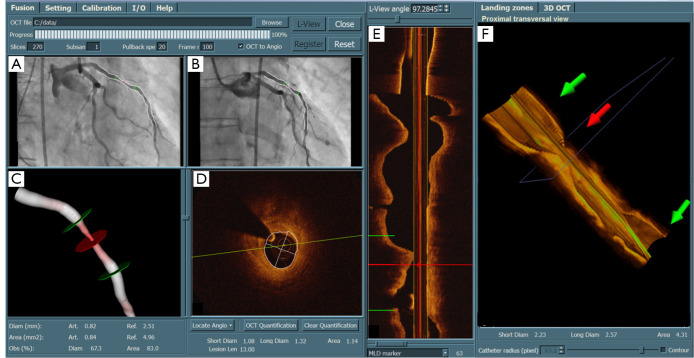
Over the past 30 years, quantitative coronary arteriography (QCA) has been used extensively as an objective and reproducible tool in clinical research to assess changes in vessel dimensions as a result of interventions, but also as a tool to provide evidence to the interventionalist prior to and after an intervention and at follow-up when necessary. With the increasing complexities of bifurcation stenting, corresponding analytical tools for bifurcation analysis have been developed with extensive reporting schemes. Although intravascular ultrasound (IVUS) has been around for a long time as well, more recent radiofrequency analysis provides additional information about the vessel wall composition; likewise optical coherence tomography (OCT) provides detailed information about the positions of the stent struts and the quality of the stent placement. Combining the information from the X-ray lumenogram and the intravascular imaging devices is mentally a challenging task for the interventionalist. To support the registration of these intravascular images with the X-ray images, 3D QCA has been developed and registered with the IVUS or OCT images, so that at every position along the vessel of interest the luminal data and the vessel wall data by IVUS or the stent strut data by OCT can be combined. From the 3D QCA the selection of the optimal angiographic views can also be facilitated. It is the intention of this overview paper to provide an extensive description of the techniques that we have developed and validated over the past 30 years.

Keywords: 3D reconstruction; Coronary artery disease; IVUS; OCT; QCA; registration.


Figures

Figure 1
Figure 1
Example of a QCA straight analysis of a right coronary artery (RCA) mid segment. A. The arterial contours; B. The analysis results
Figure 2
Figure 2
Schemes of the T-shape model and Y-shape model explaining the segments, proximal delimiter, interpolated contour and sections terminology. For each model, four segments that represent the building blocks of the models are generated by the software. A. In the T-shape model the bifurcation core is delineated by the proximal delimiter in the proximal main subsection and the carinal point (yellow point), which is flanked at one side by the first diameter of the distal main subsection, and at the other side by the interpolated contour between the proximal segment and the distal main subsection. Using this model, the arterial and reference diameters of the ostium of the side branch and the whole main section (including the transition within the carinal segment) can be accurately determined; B. In the Y-shape model the bifurcation core is delineated by the proximal delimiter in the proximal section and the carinal point (yellow point). Using this model, the arterial and reference diameters up to the carinal point and in the distal 1 and 2 segments can be determined accurately
Figure 3
Figure 3
An example of the T-shape model of the bifurcation analysis. A. The two detected bifurcation pathlines, which are overlapping in the proximal segment; B. The detected arterial contours; C. The final analysis contours, plaque filling and the two corresponding diameter functions of the Main (a.k.a. Parent Vessel) and the Side Branch sections
Figure 4
Figure 4
An example of the Y-shape model of the bifurcation analysis. The final analysis contours, plaque filling and the three corresponding diameter functions of the Proximal, Distal 1 and Distal 2 sections, respectively
Figure 5
Figure 5
Aschematic overview of the (sub) segments of the bifurcation analysis with edge segments
Figure 6
Figure 6
Automated correction of system distortions in the image geometry for the 3D angiographic reconstruction. A and B are the two angiographic views (31 RAO, 33 Cranial and 31 LAO, 30 Cranial) selected for the 3D reconstruction. Before the correction, the two epipolar lines did not go through their corresponding reference points, being the red and blue landmarks; C and D show the results after the automated correction of the system distortion. The two epipolar lines now go right through their corresponding reference points in both projection views
Figure 7
Figure 7
Three-dimensional coronary bifurcation reconstruction. A and B show the two angiographic views with lumen contours superimposed on the LAD/Diagonal bifurcation; C shows the 3D reconstructed bifurcation at optimal viewing angle (40 LAO, 56 Cranial)
Figure 8
Figure 8
Three-dimensional quantitative coronary angiography (3D QCA) and its registration with 3D optical coherence tomography (OCT). A and B are the two angiographic views; C is the reconstructed vessel segment in color-coded fashion; D. is the OCT cross-sectional view corresponding to the middle (red) marker; E is the OCT longitudinal view; and F is the 3D OCT image. After the registration, the corresponding markers in different views (A, B, C, D, and F) were synchronized, allowing the assessment of lumen dimensions from both imaging modalities at every corresponding position along the vessel segment

Similar articles

Cited by

References

    1. Reiber JH, Serruys PW, Kooijman CJ, et al. Assessment of short-, medium-, and long-term variations in arterial dimensions from computer-assisted quantitation of coronary cineangiograms. Circulation 1985;71:280-8. - PubMed
    1. Reiber JH, van der Zwet PM, Koning G, et al. Accuracy and precision of quantitative digital coronary arteriography: observer-, short-, and medium-term variabilities. Cathet Cardiovasc Diagn 1993;28:187-98. - PubMed
    1. Reiber JHC, Tuinenburg JC, Koning G, et al. Quantitative coronary arteriography. In: Coronary Radiology 2nd Revised Edition, Oudkerk M, Reiser MF (Eds.), Series: Medical Radiology, Sub series: Diagnostic Imaging, Baert AL, Knauth M, Sartor K (Eds.). Springer-Verlag, Berlin-Heidelberg 2009:41-65.
    1. Lansky A, Tuinenburg J, Costa M, et al. ; European Bifurcation Angiographic Sub-Committee. Quantitative angiographic methods for bifurcation lesions: a consensus statement from the European Bifurcation Group. Catheter Cardiovasc Interv 2009;73:258-66. - PubMed
    1. Janssen JP, Rares A, Tuinenburg JC, et al. New approaches for the assessment of vessel sizes in quantitative (cardio-)vascular X-ray analysis. Int J Cardiovasc Imaging 2010;26:259-71. - PMC - PubMed