. 2013 Nov 28:11:252.
doi: 10.1186/1741-7015-11-252.

Containing the accidental laboratory escape of potential pandemic influenza viruses

Affiliations

Containing the accidental laboratory escape of potential pandemic influenza viruses

Stefano Merler et al. BMC Med. .

Abstract

Background: The recent work on the modified H5N1 has stirred an intense debate on the risk associated with the accidental release from biosafety laboratory of potential pandemic pathogens. Here, we assess the risk that the accidental escape of a novel transmissible influenza strain would not be contained in the local community.

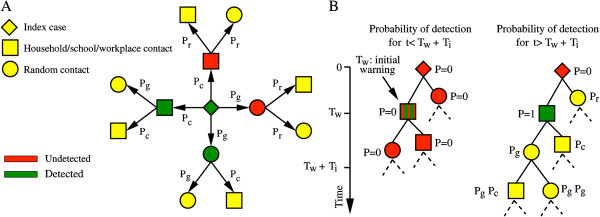
Methods: We develop here a detailed agent-based model that specifically considers laboratory workers and their contacts in microsimulations of the epidemic onset. We consider the following non-pharmaceutical interventions: isolation of the laboratory, laboratory workers' household quarantine, contact tracing of cases and subsequent household quarantine of identified secondary cases, and school and workplace closure both preventive and reactive.

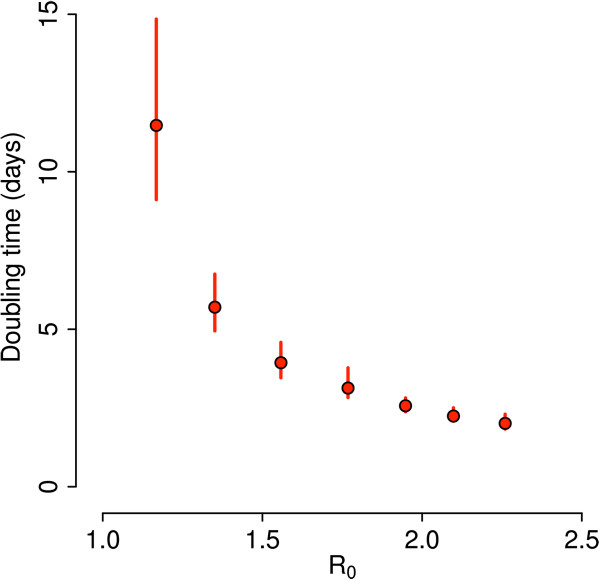
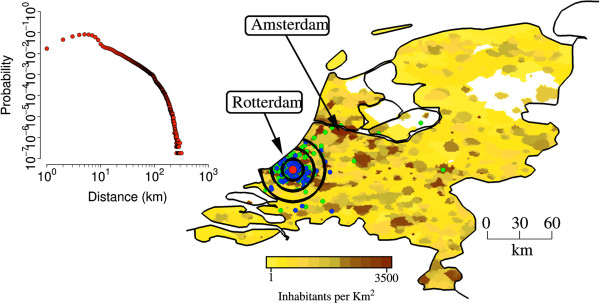
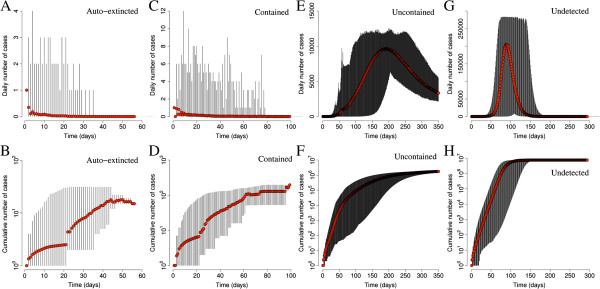
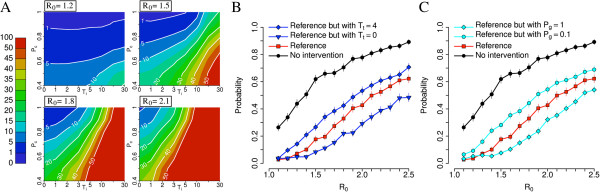
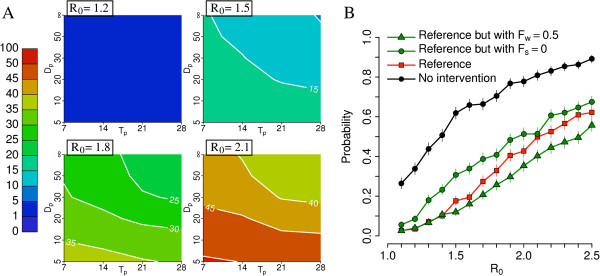
Results: Model simulations suggest that there is a non-negligible probability (5% to 15%), strongly dependent on reproduction number and probability of developing clinical symptoms, that the escape event is not detected at all. We find that the containment depends on the timely implementation of non-pharmaceutical interventions and contact tracing and it may be effective (>90% probability per event) only for pathogens with moderate transmissibility (reproductive number no larger than R₀ = 1.5). Containment depends on population density and structure as well, with a probability of giving rise to a global event that is three to five times lower in rural areas.

Conclusions: Results suggest that controllability of escape events is not guaranteed and, given the rapid increase of biosafety laboratories worldwide, this poses a serious threat to human health. Our findings may be relevant to policy makers when designing adequate preparedness plans and may have important implications for determining the location of new biosafety laboratories worldwide.


Figures

Figure 1
Figure 1
Doubling time. Average doubling time (dots) and 95% CI (vertical lines) as a function of R0. For each value of R0 results were obtained by analyzing 100 uncontrolled (no intervention) simulated epidemics.
Figure 2
Figure 2
Study area. The map shows population density of the Netherlands (colors from yellow to dark brown indicate increasing densities, from 1 to 3,500 inhabitants per km2), the location of the laboratory in a randomly chosen simulation (in Rotterdam, red point), the location of the workers houses (blue points), the location of workplaces and schools attended by household members of laboratory workers (green). Black concentric circles indicate distances of 10 km, 20 km, 30 km from the laboratory. The inset shows the probability of commuting to (at) a certain distance by laboratory workers.
Figure 3
Figure 3
Contact tracing. (A) Probabilities of detecting first and second generation cases (the latter conditioned to the detection of first generation cases) triggered by a traced index case. (B) Example of network of cases triggered by the initial infected laboratory worker (undetected in this example; the initial warning is triggered by a secondary case in the laboratory), and probability of case detection at time of intervention (Tw + Ti).
Figure 4
Figure 4
Reference scenario. (A) Probability of outbreak for different values of R0 by assuming no intervention scenario (uncontrolled epidemics) and reference scenario. (B) Probability of undetected epidemics for different values of R0 by assuming reference scenario (in red) and reference scenario with different values of Pc. (C) Upper panel: overall number of cases in contained outbreaks by assuming reference scenario and R0 = 1.5 (not considering autoextinct epidemics). Middle panel: as upper panel but for the number of traced cases. Lower panel: as upper panel but for the number of isolated individuals (including the laboratory’s contact network). A total of 1,000 simulations were undertaken for each parameter set to produce the results shown.
Figure 5
Figure 5
Epidemic timing. (A) Average number of daily cases as observed in autoextinct simulated epidemics (red points) with R0 = 1.5. Vertical lines represent minimum and maximum daily incidence. (B) As in (A) but for the average cumulative number of cases. (C,D) As (A) and (B) but for contained epidemics by assuming reference interventions. (E,F) As (A) and (B) but for uncontained epidemics by assuming reference interventions. (G,H) As (A) and (B) but for undetected epidemics. A total of 1,000 simulations were undertaken to produce the results shown.
Figure 6
Figure 6
Sensitivity analysis: contact tracing. (A) Probability (×100) of outbreak for different values of R0 by assuming reference scenario and by varying Ti and Pc. (B) Probability of outbreak for different values of R0 by assuming no intervention scenario, reference scenario, and reference scenarios with different delays in the isolation of traced cases. (C) Probability of outbreak for different values of R0 by assuming no intervention scenario, reference scenario, and reference scenarios with different probabilities of identifying cases in the general community. A total of 1,000 simulations were undertaken for each parameter set to produce the results shown.
Figure 7
Figure 7
Sensitivity analysis: school and workplace closure. (A) Probability (×100) of outbreak for different values of R0 by assuming reference scenario with additional workplaces closure (Fw = 0.5) and by varying Dp and Tp. (B) Probability of outbreak for different values of R0 by assuming no intervention scenario, reference scenario, and reference scenarios with different policies regulating school and workplaces closure. A total of 1,000 simulations were undertaken for each parameter set to produce the results shown.
Figure 8
Figure 8
Geographical variability. (A) Ratio between probability of outbreak in different urban areas and probability of outbreak in Rotterdam (The Netherlands) for different values of R0 by assuming reference scenario. (B) Ratio between probability of outbreak in urban and rural areas in different countries for different values of R0 by assuming reference scenario. Urban areas as in (A); rural areas are low population density areas in Wales (UK, 80 km north of Cardiff), Uppland (SE, 100 km north of Uppsala), Sardinia island (IT, 50 km east of Sassari), Andalusia - Castile la Mancha (ES, 50 km northeast of Cordoba), Centre-Burgundy (France, 80 km southeast of Orleans). Note that the reported value of R0 refers to that of simulations carried out for Rotterdam (The Netherlands); comparative results for other countries are obtained by assuming the same transmission rates in the different social contexts (that is the same probability of infection transmission given a contact in a certain setting) as in Rotterdam. A total of 1,000 simulations were undertaken for each parameter set to produce the results shown.

Similar articles

Cited by

References

    1. Alberts B. H5N1. Science. 2012;336:1521. doi: 10.1126/science.336.6088.1521. - DOI - PubMed
    1. Fauci AS, Collins FS. Benefits and risks of influenza research: lessons learned. Science. 2012;336:1522–1523. doi: 10.1126/science.1224305. - DOI - PMC - PubMed
    1. Herfst S, Schrauwen EJA, Linster M, Chutinimitkul S, de Wit E, Munster VJ, Sorrell EM, Bestebroer TM, Burke DF, Smith DJ, Rimmelzwaan GF, Osterhaus ADME, Fouchier RAM. Airborne transmission of influenza A/H5N1 virus between ferrets. Science. 2012;336:1534–1541. doi: 10.1126/science.1213362. - DOI - PMC - PubMed
    1. Imai M, Watanabe T, Hatta M, Das SC, Ozawa M, Shinya K, Zhong G, Hanson A, Katsura H, Watanabe S, Li C, Kawakami E, Yamada S, Kiso M, Suzuki Y, Maher EA, Neumann G, Kawaoka Y. Experimental adaptation of an influenza H5 HA confers respiratory droplet transmission to a reassortant H5HA/H1N1 virus in ferrets. Nature. 2012;486:420–428. - PMC - PubMed
    1. Federation of American Scientists. Biosafety level 4 Labs and BSL information. http://www.fas.org/programs/bio/biosafetylevels.html.

Publication types