

doi: 10.1056/NEJMms1215400.
Contagious diseases in the United States from 1888 to the present
Affiliations
- PMID: 24283231
- PMCID: PMC4175560
- DOI: 10.1056/NEJMms1215400
Item in Clipboard
Contagious diseases in the United States from 1888 to the present
N Engl J Med.
.
No abstract available
Figures
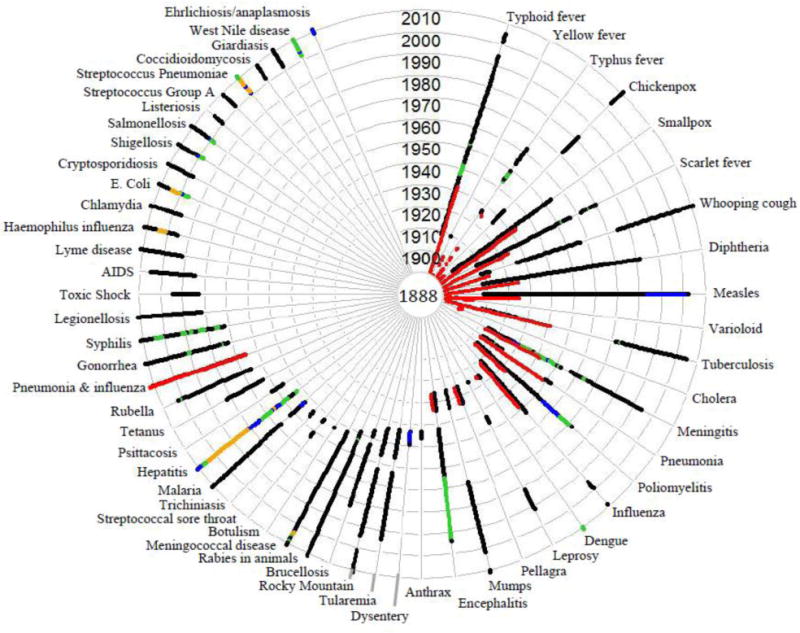
Availability of Weekly Counts of Cases of Reported Diseases from Any U.S. Location, 1888–2011. Each concentric circle represents a decade, starting with 1888 in the center. No single disease was reported weekly throughout the entire period, and for many diseases, the type of reports changed over time, as represented by different colors: red represents mortality reports and black, green, blue, and orange represent reporting of cases for 1, 2, 3, or more than 3 disease subcategories, respectively.
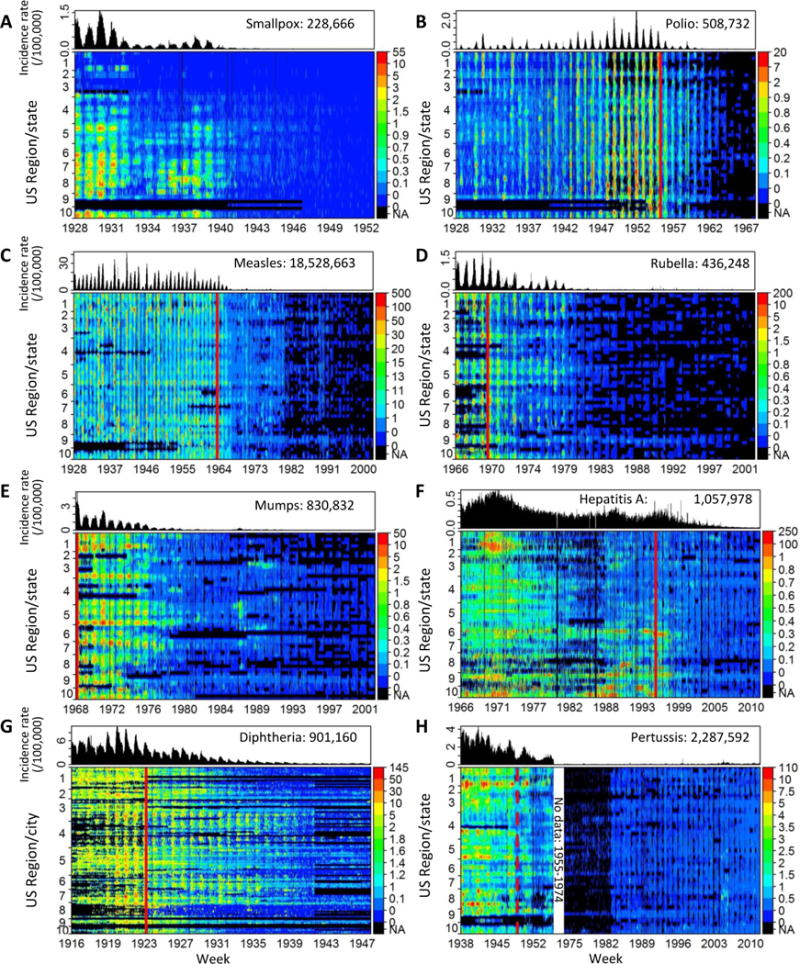
Snapshots of Disease Elimination in the United States. Weekly incidence rates per 100,000 population are displayed for the entire country (top of each panel) and per state (for all diseases except diphtheria) or city (for diphtheria) grouped by US epidemiological region in the following order: region 1= Connecticut, Maine, Massachusetts, New Hampshire, Rhode Island, Vermont; 2= New Jersey, New York; 3= Delaware, District of Columbia, Maryland, Pennsylvania, Virginia, West Virginia; 4= Alabama, Florida, Georgia, Kentucky, Mississippi, North Carolina, South Carolina, Tennessee; 5= Illinois, Indiana, Michigan, Minnesota, Ohio, Wisconsin; 6= Arkansas, Louisiana, New Mexico, Oklahoma, Texas; 7= Iowa, Kansas, Missouri, Nebraska; 8= Colorado, Montana, North Dakota, South Dakota, Utah, Wyoming; 9= Arizona, California, Hawaii, Nevada; 10= Alaska, Idaho, Oregon, Washington. The year of vaccine licensure is indicated by a vertical red line, and the total number of cases displayed is listed for each disease. The smallpox vaccine was introduced in the United States around 1800. Weekly reports for pertussis were unavailable from 1955 to 1974 (white space), and an approximate year of vaccine licensure was used (dashed line). NA denotes data not available (i.e. not included in weekly reports).
References
-
- Roush SW, Murphy TV. Historical comparisons of morbidity and mortality for vaccine-preventable diseases in the United States. JAMA. 2007;298:2155–63. - PubMed
-
- Ten great public health achievements–United States, 2001–2010. MMWR Morb Mortal Wkly Rep. 2011;60:619–23. - PubMed
-
- Hinman AR, Orenstein WA, Schuchat A. Vaccine-preventable diseases, immunizations, and MMWR–1961–2011. MMWR Surveill Summ. 2011;60(Suppl 4):49–57. - PubMed
-
- Cherry JD. Epidemic pertussis in 2012–the resurgence of a vaccine-preventable disease. N Engl J Med. 2012;367:785–7. - PubMed
-
- Centers for Disease Control and Prevention. Notifiable Diseases and Mortality Tables. Morbidity and Mortality Weekly Report. 2012;61:ND-663–ND-76.
Publication types
MeSH terms
Grants and funding
LinkOut - more resources
Full Text Sources
Other Literature Sources
Medical