. 2014 Jan;141(1):124-35.
doi: 10.1242/dev.098640. Epub 2013 Nov 27.

Adaptation of the length scale and amplitude of the Bicoid gradient profile to achieve robust patterning in abnormally large Drosophila melanogaster embryos

Affiliations

Adaptation of the length scale and amplitude of the Bicoid gradient profile to achieve robust patterning in abnormally large Drosophila melanogaster embryos

David Cheung et al. Development. 2014 Jan.

Abstract

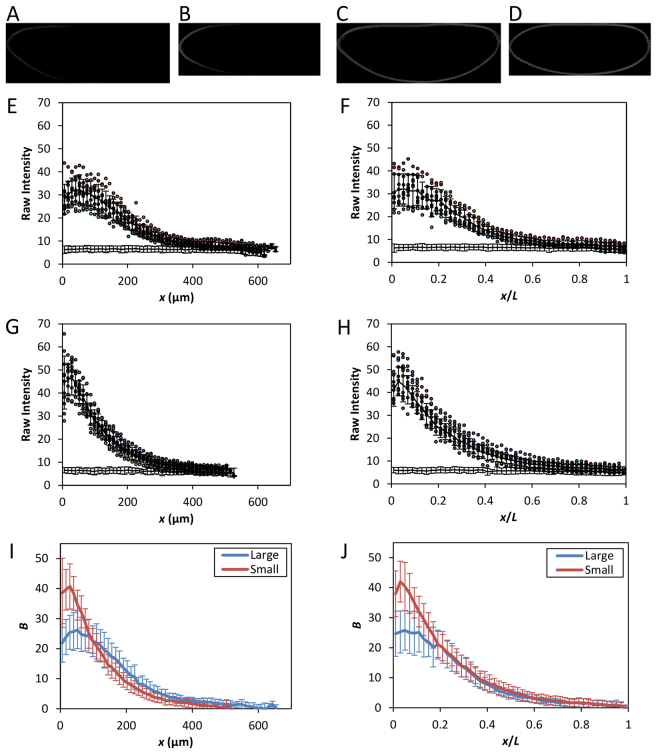
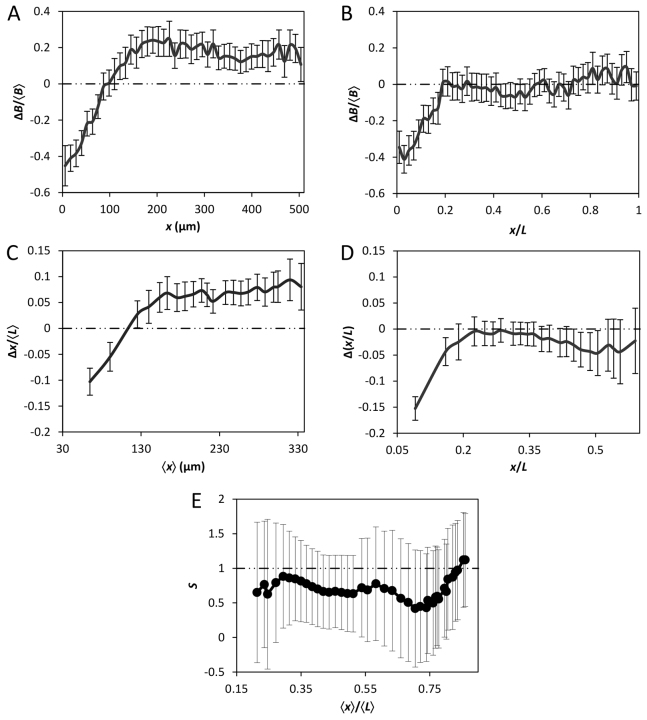
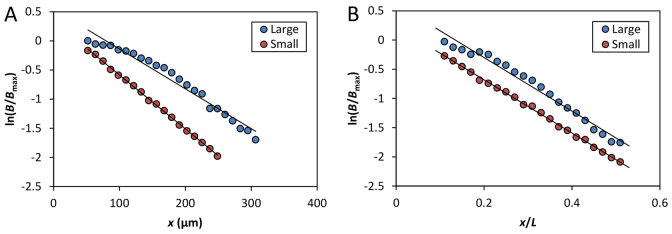
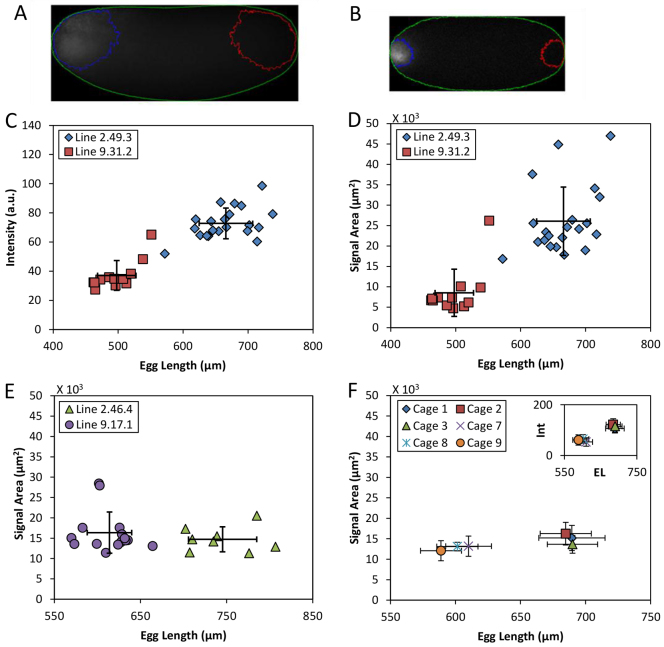
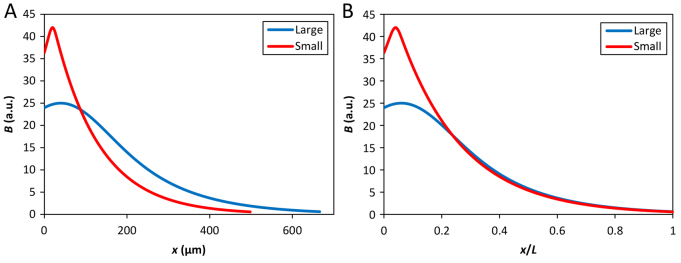
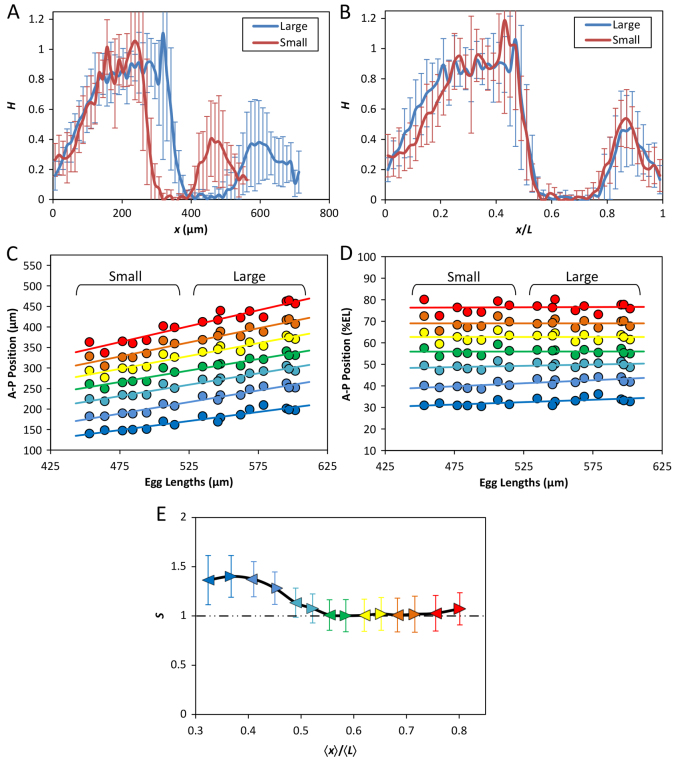
The formation of patterns that are proportional to the size of the embryo is an intriguing but poorly understood feature of development. Molecular mechanisms controlling such proportionality, or scaling, can be probed through quantitative interrogations of the properties of morphogen gradients that instruct patterning. Recent studies of the Drosophila morphogen gradient Bicoid (Bcd), which is required for anterior-posterior (AP) patterning in the early embryo, have uncovered two distinct ways of scaling. Whereas between-species scaling is achieved by adjusting the exponential shape characteristic of the Bcd gradient profile, namely, its length scale or length constant (λ), within-species scaling is achieved through adjusting the profile's amplitude, namely, the Bcd concentration at the anterior (B0). Here, we report a case in which Drosophila melanogaster embryos exhibit Bcd gradient properties uncharacteristic of their size. The embryos under investigation were from a pair of inbred lines that had been artificially selected for egg size extremes. We show that B0 in the large embryos is uncharacteristically low but λ is abnormally extended. Although the large embryos have more total bcd mRNA than their smaller counterparts, as expected, its distribution is unusually broad. We show that the large and small embryos develop gene expression patterns exhibiting boundaries that are proportional to their respective lengths. Our results suggest that the large-egg inbred line has acquired compensating properties that counteract the extreme length of the embryos to maintain Bcd gradient properties necessary for robust patterning. Our study documents, for the first time to our knowledge, a case of within-species Bcd scaling achieved through adjusting the gradient profile's exponential shape characteristic, illustrating at a molecular level how a developmental system can follow distinct operational paths towards the goal of robust and scaled patterning.

Keywords: Bicoid; Canalization; Length constant; Morphogen gradient; Robust patterning; Size scaling.


Figures

Fig. 1.
Fig. 1.
Bcd gradient properties uncharacteristic of embryo size. (A-D) Shown are midsagittal images of embryos from the large-egg line 2.49.3 (A,C) and the small-egg line 9.31.2 (B,D), detecting either Bcd (A,B) or nuclei (C,D). The intensities in the images shown were adjusted for presentational purposes only. (E-H) Extracted fluorescence intensities are plotted as a function of either x (E,G) or x/L (F,H). n=10 and 11 for lines 2.49.3 (E,F) and 9.31.2 (G,H), respectively. Mean intensity is shown as black line; error bars are s.d. Also shown are the relevant portions of the mean intensity (and s.d.) from bcdE1 embryos. (I-J) Mean Bcd profiles from the large (blue) and small (red) embryos as a function of x (I) or x/L (J). Error bars are s.d.
Fig. 2.
Fig. 2.
Quantitative evaluation of Bcd gradient scaling. (A,B) Shown are Bcd intensity differences, ΔB, between the large and small embryos as a function of x (A) or x/L (B). ΔB is calculated by subtracting the mean B of line 9.31.2 from the mean B of line 2.49.3, and normalizing to averaged B, ⟨B⟩. (C,D) Shown are differences in positions, Δx, at which mean Bcd gradient profiles cross given thresholds, plotted as a function of x (C) or x/L (D). For panel C, Δx is normalized to the average length of both embryos ⟨L⟩, and ⟨x⟩ denotes averaged position at which the mean profiles cross a threshold. Interpolated mean profiles were used to obtain x at arbitrary B thresholds chosen. Error bars are s.d. of the difference between the sample means (Cheung et al., 2011). (E) Scaling coefficient S as a function of AP position in the large and small embryos. This analysis was performed as described previously (de Lachapelle and Bergmann, 2010; Cheung et al., 2011). Error bars shown represent 95% confidence intervals from linear regression (Cheung et al., 2011).
Fig. 3.
Fig. 3.
Evaluation of the relationship between Bcd profile’s length constant and embryo length. (A,B) Shown are semi-log scatter plots of mean B from the indicated embryos as a function of x (A) or x/L (B). B is normalized to their respective maximal mean intensity, Bmax. The x/L range of 0.1-0.5 was used to reduce effects of experimental errors in posterior and non-exponential shape in anterior. Linear fits (shown as solid black lines) in A are: y=-0.0071x + 0.60 (R2=0.97) and y=-0.0092x + 0.34 (R2=0.99) for the large and small embryos, respectively. In B, they are: y=-4.58x + 0.62 (R2=0.97) and y=-4.55x + 0.23 (R2=0.99), respectively.
Fig. 4.
Fig. 4.
Quantification of bcd mRNA in early embryos. (A,B) Immunofluorescence images of embryos detecting bcd mRNA, showing embryo masking (green) and contour outlines for specific signals (blue) or background subtraction (red). Intensities in images shown were adjusted for presentational purposes only. (C) Scatter plot of fluorescence intensities (see Materials and methods) against L for the large (blue) and small (red) embryos under current investigation. (D-F) Scatter plots of the areas containing specific signals against L. Data are from the large (blue) and small (red) embryos under current investigation (D), or embryos from our previously published lines 2.46.4 (green) and 9.17.1 (purple) shown in panel E, and population cages shown in panel F. Inset in F shows mean intensities against mean L. Error bars are s.d.
Fig. 5.
Fig. 5.
Evaluating the impact of bcd RNA distribution on Bcd gradient formation in a theoretical model. (A,B) Bcd profiles of the large (blue) and small (red) embryos as steady-state concentrations (a.u.) based on equation 14 in Dalessi et al. (Dalessi et al., 2012), plotted as a function of x (A) or x/L (B). In the Dalessi et al. model, the ‘spread’ of a normally distributed source is characterized by σ (in units of L). σ=0.12 and 0.01 was used for the large and small embryos, respectively. The respective ‘center’ locations of the source (in units of L) were assigned as 0.06 and 0.04, and experimental estimates of L=666 μm and 498 μm, and λ/L=0.22 (for both embryos) were used. The production rates for the large and small embryos (in units of their respective decay rates) were estimated according to the observed Bmax ratio (′25:42). The ratio of the detected bcd mRNA intensities in the large and small embryos (7.27:3.70) allowed the calculation of the ratios of both the diffusion constants (3.2) and decay rates (1.8). The results shown were based on an analysis by Sascha Dalessi and Sven Bergmann and the computer code that they had generated (personal communication).
Fig. 6.
Fig. 6.
Robust expression patterns of hunchback and even-skipped. (A,B) Mean profiles (with s.d.) of FISH intensities detecting hb mRNA as a function of x (A) or x/L (B). n=10 and 7 for the large and small embryos, respectively. See supplementary material Fig. S3 for data from individual embryos. (C,D) Scatter plots of detected eve expression boundary positions against L. Either absolute (C) or relative (D) AP positions of the anterior boundaries of each of the seven stripes are shown. Linear regression is shown for each boundary. (E) Scaling coefficient profiles of eve expression boundaries in the large and small embryos. For this analysis, both the anterior and posterior boundaries (shown as arrowheads) of each eve stripe were used, with color code being the same as in C and D. Error bars represent 95% confidence intervals from linear regression (Cheung et al., 2011).

References

    1. Baena-Lopez L. A., Nojima H., Vincent J. P. (2012). Integration of morphogen signalling within the growth regulatory network. Curr. Opin. Cell Biol. 24, 166–172 - PubMed
    1. Ben-Zvi D., Shilo B. Z., Barkai N. (2011). Scaling of morphogen gradients. Curr.Opin. Genet. Dev. 21, 704–710 - PubMed
    1. Bergmann S., Sandler O., Sberro H., Shnider S., Schejter E., Shilo B. Z., Barkai N. (2007). Pre-steady-state decoding of the Bicoid morphogen gradient. PLoS Biol. 5, e46 - PMC - PubMed
    1. Berleth T., Burri M., Thoma G., Bopp D., Richstein S., Frigerio G., Noll M., Nüsslein-Volhard C. (1988). The role of localization of bicoid RNA in organizing the anterior pattern of the Drosophila embryo. EMBO J. 7, 1749–1756 - PMC - PubMed
    1. Chahda J. S., Sousa-Neves R., Mizutani C. M. (2013). Variation in the dorsal gradient distribution is a source for modified scaling of germ layers in Drosophila. Curr. Biol. 23, 710–716 - PMC - PubMed

Publication types

LinkOut - more resources