. 2014 Jan;141(1):17-27.
doi: 10.1242/dev.089078. Epub 2013 Nov 27.

FOXD1 promotes nephron progenitor differentiation by repressing decorin in the embryonic kidney

Affiliations

FOXD1 promotes nephron progenitor differentiation by repressing decorin in the embryonic kidney

Jennifer L Fetting et al. Development. 2014 Jan.

Abstract

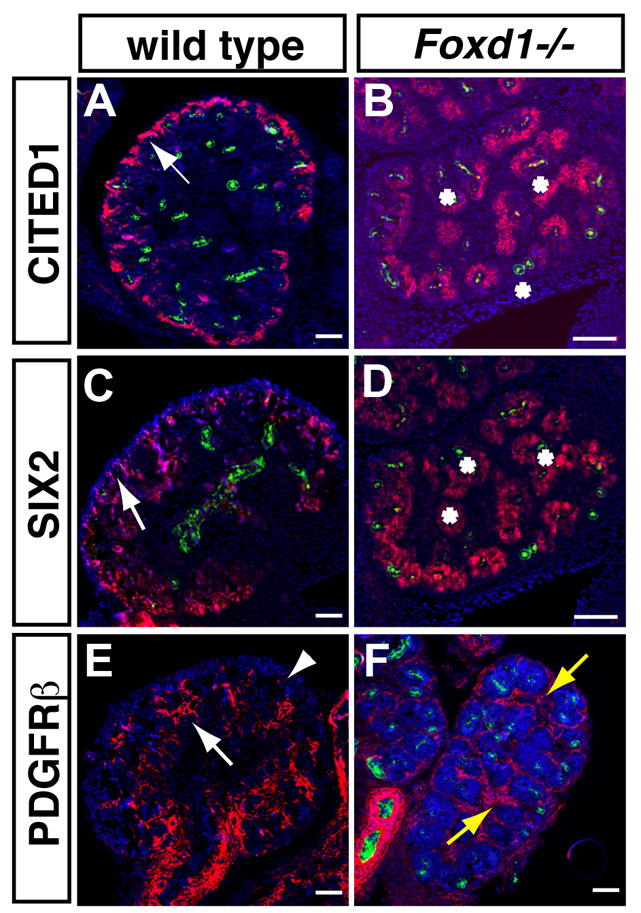
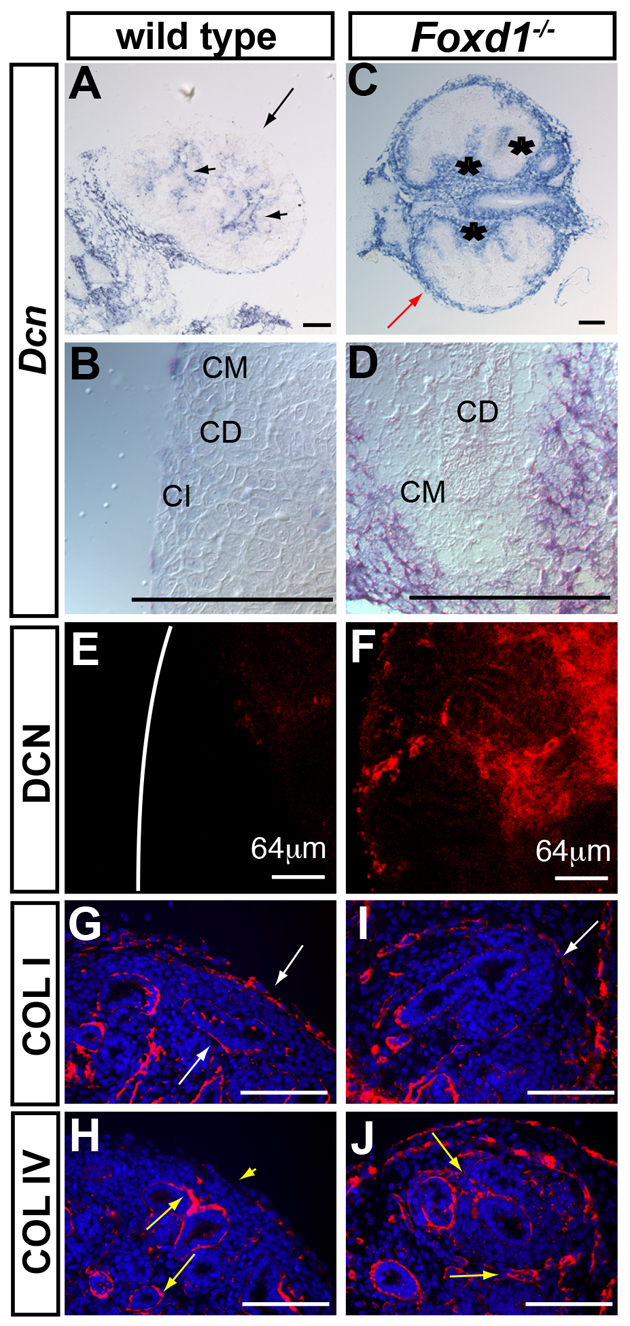
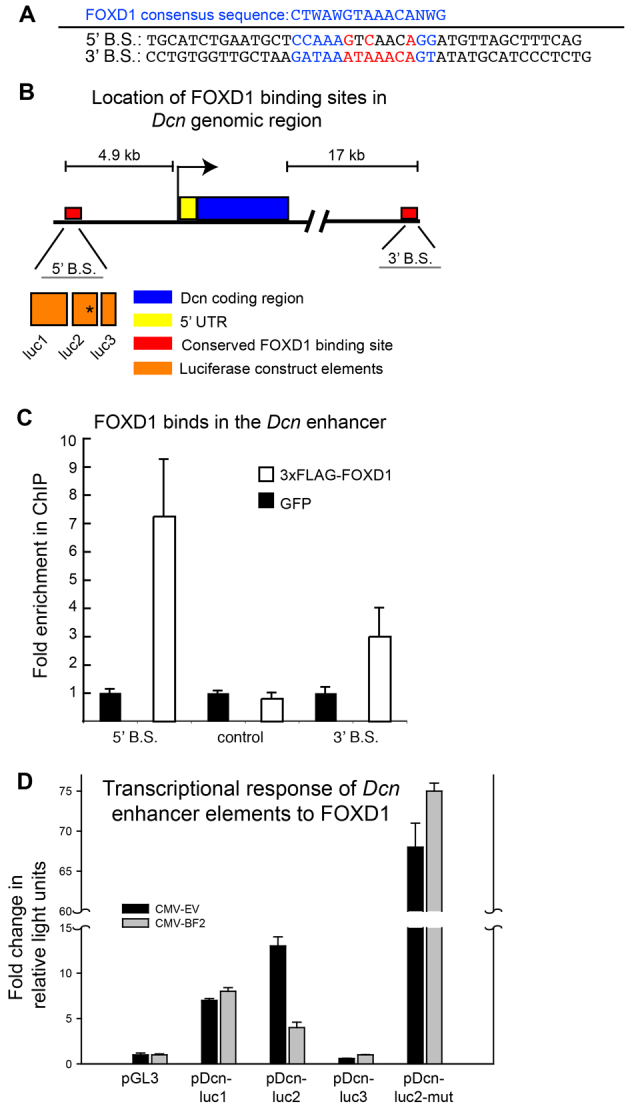
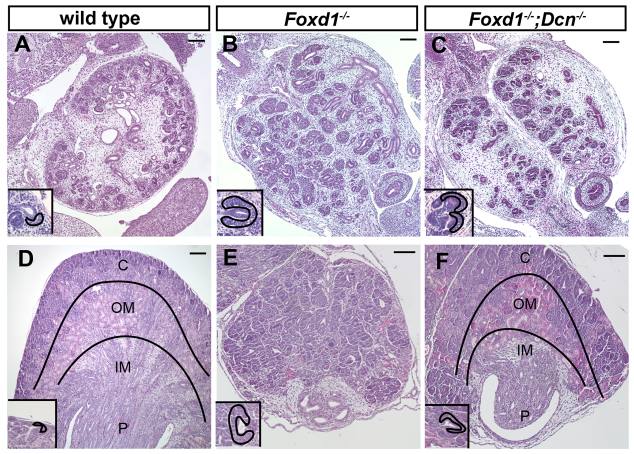
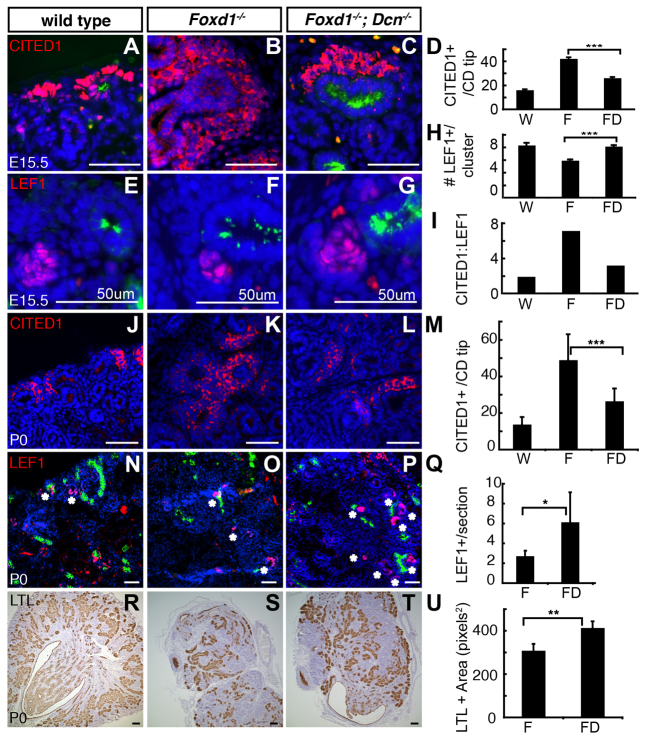
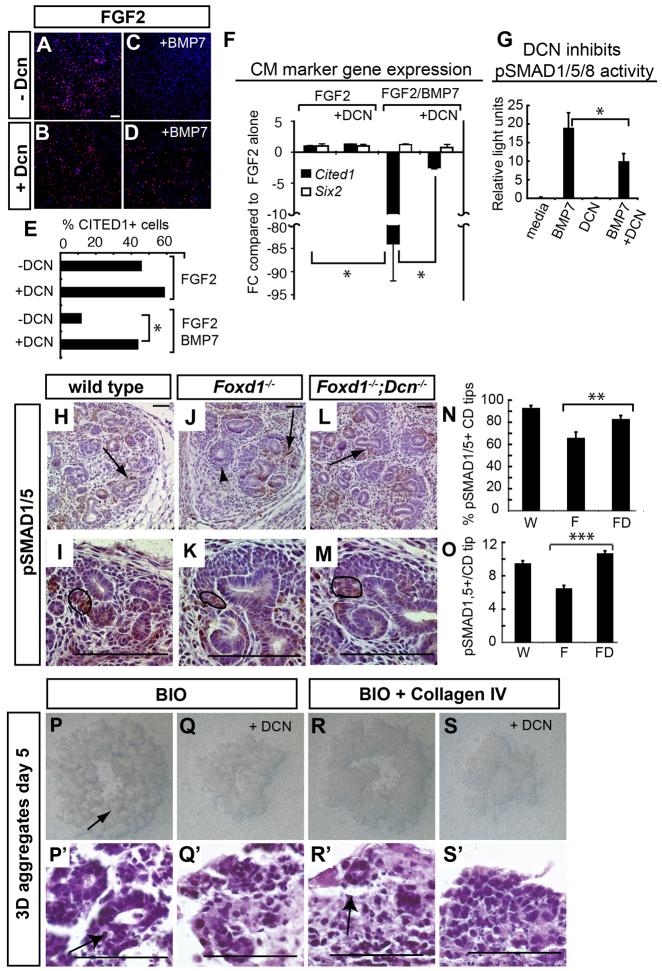
Forkhead transcription factors are essential for diverse processes in early embryonic development and organogenesis. Foxd1 is required during kidney development and its inactivation results in failure of nephron progenitor cell differentiation. Foxd1 is expressed in interstitial cells adjacent to nephron progenitor cells, suggesting an essential role for the progenitor cell niche in nephrogenesis. To better understand how cortical interstitial cells in general, and FOXD1 in particular, influence the progenitor cell niche, we examined the differentiation states of two progenitor cell subtypes in Foxd1(-/-) tissue. We found that although nephron progenitor cells are retained in a primitive CITED1-expressing compartment, cortical interstitial cells prematurely differentiate. To identify pathways regulated by FOXD1, we screened for target genes by comparison of Foxd1 null and wild-type tissues. We found that the gene encoding the small leucine-rich proteoglycan decorin (DCN) is repressed by FOXD1 in cortical interstitial cells, and we show that compound genetic inactivation of Dcn partially rescues the failure of progenitor cell differentiation in the Foxd1 null. We demonstrate that DCN antagonizes BMP/SMAD signaling, which is required for the transition of CITED1-expressing nephron progenitor cells to a state that is primed for WNT-induced epithelial differentiation. On the basis of these studies, we propose a mechanism for progenitor cell retention in the Foxd1 null in which misexpressed DCN produced by prematurely differentiated interstitial cells accumulates in the extracellular matrix, inhibiting BMP7-mediated transition of nephron progenitor cells to a compartment in which they can respond to epithelial induction signals.

Keywords: Interstitial cell; Kidney development; Mouse; Organogenesis; Progenitor niche.


Figures

Fig. 1.
Fig. 1.
Marker analysis in the E15.5 Foxd1-/- kidney. (A,B) In wild-type kidneys (A), CITED1 (red) localizes to cortical cap mesenchyme cells, whereas Foxd1-/- kidneys (B) contain large interior CITED1+ clusters. (C,D) SIX2 (red) localization recapitulates CITED1 staining in both wild-type (C) and Foxd1-/- (D) kidneys. (E) Wild-type kidneys contain PDGFRβ+ (red) cells in the medullary interstitium and mesangial cells and exclude PDGFRβ from cortical interstitial cells (arrowhead). (F) Foxd1-/- interstitial cells are PDGFRβ+. In all panels, green labels DBA+ CDs and blue labels DAPI+ nuclei. White arrows depict wild-type localization, asterisks depict mislocalized progenitors, and yellow arrows depict aberrant expression in interstitial cells. Scale bars: 100 μm.
Fig. 2.
Fig. 2.
Screen for candidate FOXD1 targets. (A) Microarray validation. Black bars represent the fold change (FC) in a random selection of differentially expressed genes from the microarray. Gray bars represent average qRT-PCR fold change values in Foxd1-/- whole kidney tissue relative to wild-type tissue. qRT-PCR values are normalized to Gapdh. (B) Dataset comparisons used to identify target genes. Red text denotes targets with conserved FOXD1-binding sites. CI, cortical interstitium; MI, medullary interstitium; WT, wild type. (C) qRT-PCR of target gene expression in MES13 cells after CMV-BF2 transfection. Bars represent average fold change values in transfected cells, normalized to Gapdh, relative to pCX-eGFP transfected cells. Asterisks reflect statistically significant fold changes (P<0.05) as determined by Student’s t-test. Error bars represent s.d.
Fig. 3.
Fig. 3.
Extracellular matrix protein mislocalization in E15.5 Foxd1-/- kidneys. (A-D) In situ hybridization with a probe against Dcn in wild-type (A,B) and Foxd1-/- (C,D) kidneys. Black arrows and arrowheads depict wild-type cortical and medullary expression, respectively. Red arrows and black asterisks denote aberrant cortical and medullary interstitial expression, respectively. CD, collecting duct; CI, cortical interstitium; CM, cap mesenchyme. (E,F) Optical sections through wild-type (E) and Foxd1-/- (F) kidneys. DCN protein (red) localizes to the cortex in Foxd1-/- (F). (G,H) In wild-type kidneys, collagen I (red) associates with tubule basement membranes and cortical interstitium (white arrows) (G) and collagen IV (red) associates solely with tubule basement membranes (yellow arrows) and is excluded from cortical interstitium (yellow arrowhead) (H). (I,J) In Foxd1-/- kidneys, collagen I localizes to the same compartments as in wild type (white arrow) (I), whereas collagen IV expression is widespread in Foxd1-/- interstitium (yellow arrows) (J). Scale bars: 100 μm (A-D,G-J).
Fig. 4.
Fig. 4.
FOXD1 directly represses Dcn. (A) Conserved 5′ and 3′ FOXD1-binding sites with flanking genomic sequence. Blue script denotes consensus FOXD1 sequence. Red script indicates forkhead core sequence. Black script indicates mutated bases in pDcn-luc2-mut. (B) Schematic of species-conserved FOXD1-binding sites adjacent to the Dcn locus and enhancer element location. Black asterisk denotes 5′ FOXD1-binding site. (C) Graph of ChIP results. Black bars indicate fold change enrichment from 3xFLAG-FOXD1 samples relative to GFP samples. B.S., binding site. (D) Luciferase assay demonstrating FOXD1-binding site functionality. Bars represent average fold change in relative light units from five replicates compared with PGL3-promoter control. Black and gray bars indicate co-transfection with an empty CMV expression construct and CMV-BF2, respectively. Error bars represent standard error.
Fig. 5.
Fig. 5.
Genetic ablation of Dcn partially rescues the Foxd1-/- phenotype. (A-C) Hematoxylin and Eosin (H&E)-stained level-matched sagittal paraffin E15.5 kidneys sections depicting overall kidney organization from wild-type (A), Foxd1-/- (B) and Foxd1-/-;Dcn-/- (C) littermates. Insets show nephrogenic units with cap mesenchymes outlined in black. (D-F) Representative sections from five H&E-stained medial transverse paraffin sections from P0 wild-type (D), Foxd1-/- (E) and Foxd1-/-;Dcn-/- (F) littermates. Black lines indicate organization into discrete cortical, outer medulla and inner medulla regions. C, cortex; OM, outer medulla; IM, inner medulla; P, papilla. Scale bars: 100 μm.
Fig. 6.
Fig. 6.
Genetic ablation of Dcn increases nephrogenesis in the Foxd1-/- kidney. (A-C) CITED1 (red) staining in E15.5 wild-type (A), Foxd1-/- (B) and Foxd1-/-;Dcn-/- (C) nephrogenic units. (D) Quantification of the average number of CITED1+ cells/CD tip with a reduction in the number of CITED1+ cells in Foxd1-/-;Dcn-/- kidneys compared with Foxd1-/-. P<2.8×10-47 for wild type versus Foxd1-/-, P<4.3×10⁻²⁵ for wild type versus Foxd1-/-;Dcn-/-, and P<3.3×10⁻³² for Foxd1-/-;Dcn-/- versus Foxd1-/-. ***P<10-32. n=50 CD tips/genotype. (E-G) LEF1 (red) localization in E15.5 wild-type (E), Foxd1-/- (F) and Foxd1-/-;Dcn-/- (G) nephrogenic units. (H) Quantification of the average number of LEF1+ cells/cluster. P<2.2×10⁻⁷ for wild type versus Foxd1-/-, P<0.68 for wild type versus Foxd1-/-;Dcn-/-, and P<5.8×10⁻¹⁷ for Foxd1-/- versus Foxd1-/-;Dcn-/-. ***P<10-17. n=50 CD tips/genotype. (I) Graph depicting ratio of CITED1+ cells:LEF1+ cells per CD tip. (J-L) CITED1 (red) localization in P0 wild-type (J), Foxd1-/- (K) and Foxd1-/-;Dcn-/- (L) nephrogenic units. (M) Quantification of the average number of CITED1+ cells/CD tip in each genotype. The number of CITED1+ cells decreases by half in the Foxd1-/-;Dcn-/- kidneys. P<9×10-25 for wild type versus Foxd1-/-, P<1.7×10⁻¹⁶ for wild type versus Foxd1-/-;Dcn-/-, and P<9×10-16 for Foxd1-/- versus Foxd1-/-;Dcn-/-. ***P<10-18. n=50 CD tips/genotype. (N-P) LEF1 (red) marks renal vesicles (white asterisks) in wild-type (N), Foxd1-/- (O) and Foxd1-/-;Dcn-/- (P) kidney sections. Asterisks indicate LEF1+ aggregates. (Q) Graph quantifying the number of LEF1+ structures in Foxd1-/- and Foxd1-/-;Dcn-/- kidneys, with a twofold increase seen in the latter. *P<0.001. n=3 sections from each of five kidneys per genotype. (R-T) Lotus lectin (LTL, brown) labels differentiated proximal tubules in wild-type (R), Foxd1-/- (S) and Foxd1-/-;Dcn-/- (T) kidney sections. (U) Graph depicting a 25% increase in the epithelialized area in Foxd1-/-;Dcn-/- kidneys compared with Foxd1-/- kidneys. *P<0.03. n=3 sections from each of five kidneys per genotype. W, wild type; F, Foxd1-/-; FD, Foxd1-/-;Dcn-/-. Throughout, green is DBA and blue is DAPI. Scale bars: 100 μm (A-C,J-T). In all graphs, error bars represent s.d. P values were determined using Student’s t-test. n=5 per genotype.
Fig. 7.
Fig. 7.
DCN antagonizes BMP-dependent transition of NZCs out of the CITED1+ compartment. (A-D) CITED1 (red) expression in renal NZC culture in response to treatment with FGF2 (A), FGF2 + DCN (B), FGF2 + BMP7 (C) or FGF2 + DCN + BMP7 (D). (E) Graph quantifying the number of CITED1+ cells in culture. Black bars represent the percentage of CITED1+ cells per DAPI+ nuclei. *P<0.05. (F) Quantitative RT-PCR of Cited1 and Six2 levels in NZCs after growth factor treatment. Bars represent average fold change (FC) values in cells with different treatments relative to FGF2 alone. Changes normalized to Gapdh. *P<0.005. (G) Luciferase assay showing transcriptional response of a BMP7-responsive expression construct. Black bars represent the average relative light units in response to treatment. *P<0.006. n=5 replicates. (H-M) Phospho-SMAD1/5 (brown) labeled wild-type (H,I), Foxd1-/- (J,K) and Foxd1-/-;Dcn-/- (L,M) kidney sections. Black arrows indicate pSMAD1/5+ clusters. Black arrowheads indicate pSMAD1/5-clusters. (N) Graph quantifying the percentage of CD tips associated with phospho-SMAD1/5+ depicting a 25% increase in phospho-SMAD1/5+ tips in Foxd1-/-;Dcn-/- sections compared with Foxd1-/-. **P<0.0007. n=400 CD tips per genotype. (O) Graph quantifying the average number of phospho-SMAD1/5+ cap mesenchyme cells from level-matched CD tips, indicating a significant increase in the number of phospho-SMAD1/5+ cells in Foxd1-/-;Dcn-/- kidneys compared with Foxd1-/- (***P<9.6×10⁻¹⁷). n=150 CD tips per genotype. (P-S) Representative light images of 5-day aggregates of CITED1+ cells treated with BIO alone (P), BIO + DCN (Q), BIO + collagen IV (R) or BIO, collagen IV and DCN (S). (P′-S′) Hematoxylin and Eosin (H&E)-stained sections through the aggregates. Arrows in P-S′ indicate epithelial tubes. n=3 for each treatment. W, wild type; F, Foxd1-/-; FD, Foxd1-/-;Dcn-/-. Scale bars: 100 μm. P values determined by Student’s t-test.
Fig. 8.
Fig. 8.
Model for FOXD1 regulation of nephron progenitor cell differentiation through control of Dcn expression. (A) In the wild type, FOXD1 represses Dcn in the cortical interstitium. Differentiation of adjacent CITED1+ SIX2+ nephron progenitors to the CITED1-SIX2+ (SIX2+) state that is susceptible to induction by canonical WNT signaling from the collecting duct (CD) requires phospho-SMAD1/5/8 signaling (pS1/5). (B) In the Foxd1 null, decorin (DCN) is expressed in cortical interstitium, inhibiting phospho-SMAD1/5/8 and preventing transition of CITED1+ SIX2+ cells to the CITED1-SIX2+ state.

Comment in

References

    1. Alexi X., Berditchevski F., Odintsova E. (2011). The effect of cell-ECM adhesion on signalling via the ErbB family of growth factor receptors. Biochem. Soc. Trans. 39, 568–573 - PubMed
    1. Ang S. L., Rossant J. (1994). HNF-3 beta is essential for node and notochord formation in mouse development. Cell 78, 561–574 - PubMed
    1. Barak H., Boyle S. C. (2011). Organ culture and immunostaining of mouse embryonic kidneys. Cold Spring Harb. Protoc. 2011, pdb prot5558 - PubMed
    1. Behr R., Sackett S. D., Bochkis I. M., Le P. P., Kaestner K. H. (2007). Impaired male fertility and atrophy of seminiferous tubules caused by haploinsufficiency for Foxa3. Dev. Biol. 306, 636–645 - PMC - PubMed
    1. Blank U., Brown A., Adams D. C., Karolak M. J., Oxburgh L. (2009). BMP7 promotes proliferation of nephron progenitor cells via a JNK-dependent mechanism. Development 136, 3557–3566 - PMC - PubMed

Publication types

MeSH terms