. 2013 Oct 24;18(11):13188-99.
doi: 10.3390/molecules181113188.

Following the mechanisms of bacteriostatic versus bactericidal action using Raman spectroscopy

Affiliations

Following the mechanisms of bacteriostatic versus bactericidal action using Raman spectroscopy

Silvie Bernatová et al. Molecules. .

Abstract

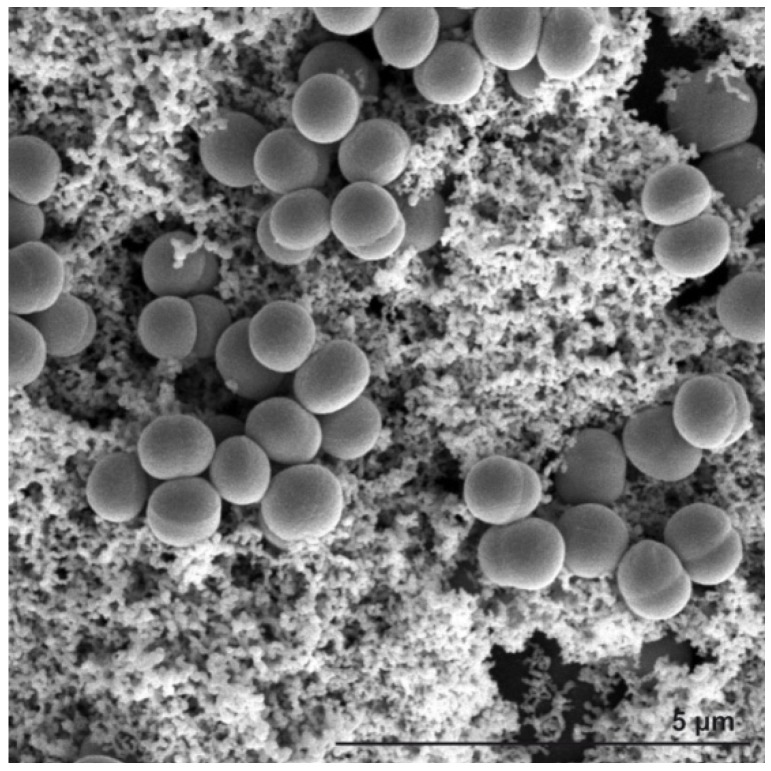
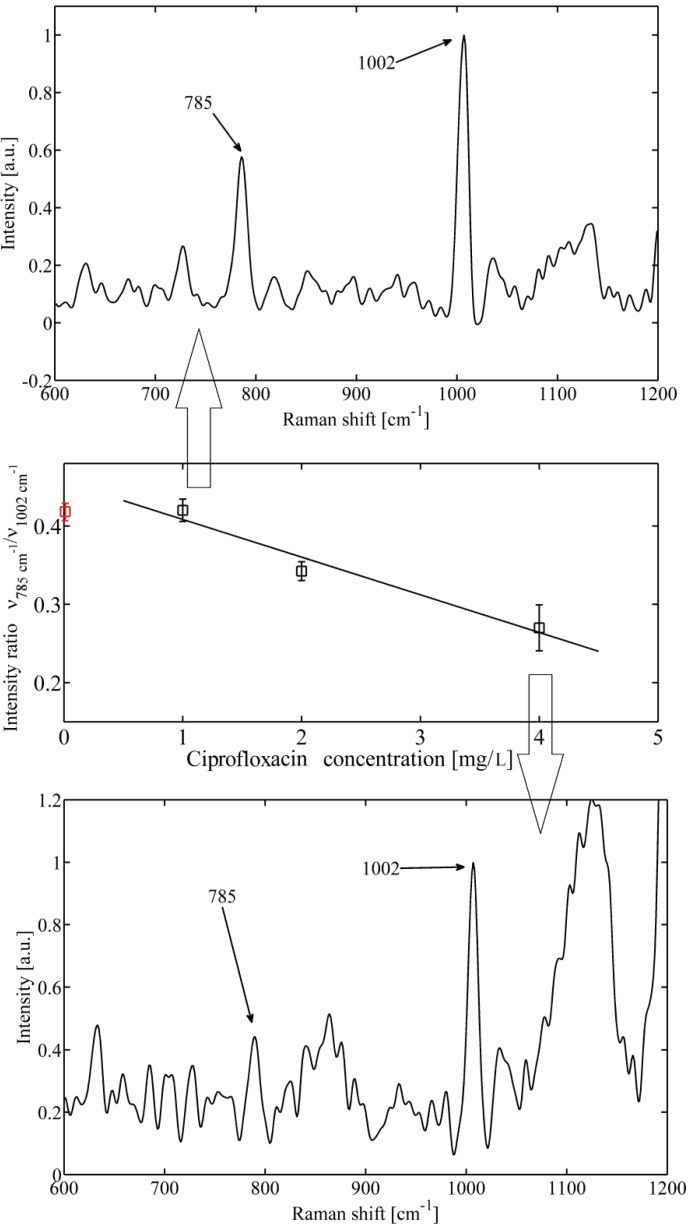
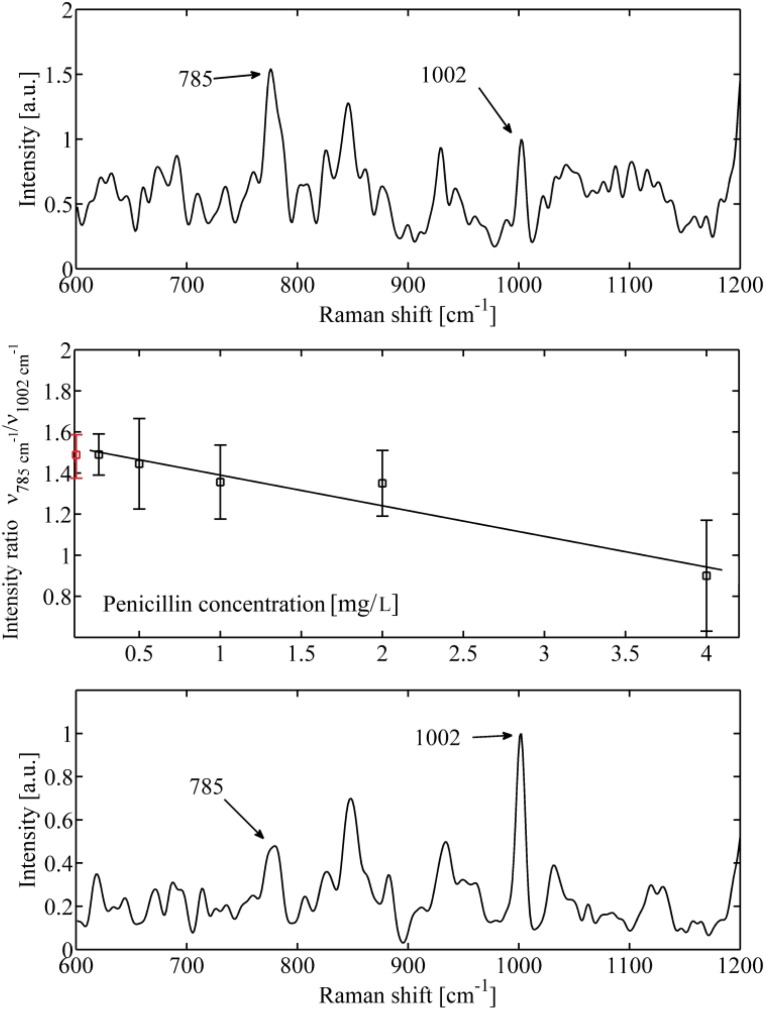
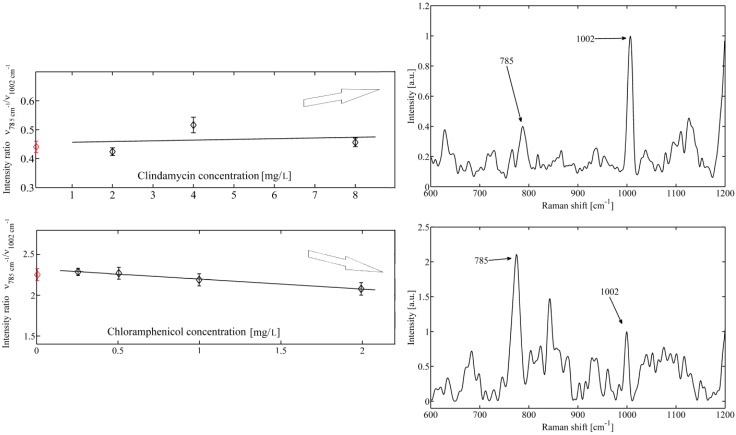
Antibiotics cure infections by influencing bacterial growth or viability. Antibiotics can be divided to two groups on the basis of their effect on microbial cells through two main mechanisms, which are either bactericidal or bacteriostatic. Bactericidal antibiotics kill the bacteria and bacteriostatic antibiotics suppress the growth of bacteria (keep them in the stationary phase of growth). One of many factors to predict a favorable clinical outcome of the potential action of antimicrobial chemicals may be provided using in vitro bactericidal/bacteriostatic data (e.g., minimum inhibitory concentrations-MICs). Consequently, MICs are used in clinical situations mainly to confirm resistance, and to determine the in vitro activities of new antimicrobials. We report on the combination of data obtained from MICs with information on microorganisms' "fingerprint" (e.g., DNA/RNA, and proteins) provided by Raman spectroscopy. Thus, we could follow mechanisms of the bacteriostatic versus bactericidal action simply by detecting the Raman bands corresponding to DNA. The Raman spectra of Staphylococcus epidermidis treated with clindamycin (a bacteriostatic agent) indeed show little effect on DNA which is in contrast with the action of ciprofloxacin (a bactericidal agent), where the Raman spectra show a decrease in strength of the signal assigned to DNA, suggesting DNA fragmentation.


Figures

Figure 1
Figure 1
SEM image of Staphylococcus epidermidis grown on a glass substrate. Biofilm (slime) formation is clearly visible throughout the sample filling the space between grape-like clusters of Staphylococcus colonies.
Figure 2
Figure 2
An example of Staphylococcus epidermidis response to bactericidal action of ciprofloxacin. (a) Top—Raman spectrum obtained for low antibiotic concentration (1 mg/L). The DNA peak at 785 cm−1 is clearly visible together with phenylalanine peak at 1002 cm−1, (b) Middle—mean value of ratio of maximum of Raman intensity at 785 cm−1 versus 1002 cm−1 for different concentration of applied ciprofloxacin measured from 10 different cells. Mean value of a control sample not exposed to antibiotic (red circle) is shown. (c) Bottom—Raman spectrum obtained for higher antibiotic concentration (4 mg/L). The DNA peak at 785 cm−1 disappeared which indicates fragmentation of DNA. Note that the two peaks shown here (around 1130 cm-1) could not be reliably determined from the analysis of the data.
Figure 3
Figure 3
An example of Staphylococcus epidermidis response to bactericidal action of penicillin. (a) Top—Raman spectrum obtained for low antibiotic concentration (0.2 mg/L). The DNA peak at 785 cm−1 is clearly visible together with phenylalanine peak at 1,002 cm−1. (b) Middle—mean value of ratio of maximum of Raman intensity at 785 cm−1 versus 1,002 cm−1 for different concentrations of applied penicillin measured from 10 different cells. Mean value of a control sample not exposed to antibiotic (red circle) is shown. (c) Bottom—Raman spectrum obtained for higher antibiotic concentration (4 mg/L). The DNA peak at 785 cm−1 nearly disappeared which, again, indicates damage of DNA.
Figure 4
Figure 4
Mean value of bacteria response to bacteriostatic action of (a) top–clindamycine and (b) bottom–chloramphenicol, on cells of Staphylococcus epidermidis. Constant intensity ratio indicates for both antibiotics no visible influence on bacterial DNA. Raman spectra for control samples are shown on the right (indicated with red circles).
Figure 5
Figure 5
Schematic diagram of the Raman tweezers setup where the same laser beam is used for optical trapping and Raman scattering. BF–band pass filter, D–dichroic mirror, Exp–beam expander, FM–flipping mirror, L1,2–lenses, NDF1,2–neutral density filters, NF1,2–notch filters, PBS–polarizing beam splitter, WP–lambda-half wave plate. Inset shows the detail of optically trapped bacterium near the focus the laser beam at the wavelength 785 nm.

References

    1. Samek O., Al-Marashi J.F.M., Telle H.H. The potential of Raman spectroscopy for the identification of biofilm formation by Staphylococcus epidermidis. Laser Phys. Lett. 2010;7:378–383. doi: 10.1002/lapl.200910154. - DOI
    1. Ruzicka F., Hola V., Votava M., Tejkalova R., Horvat R., Heroldova M., Woznicova V. Biofilm Detection and the Clinical Significance of Staphylococcus epidermidis Isolates. Folia Microbiol. 2004;49:596–600. - PubMed
    1. Kim J., Park H.-D., Chung S. Microfluidic Approaches to Bacterial Biofilm Formation. Molecules. 2012;17:9818–9834. - PMC - PubMed
    1. Maquelin K., Kirschner C., Choo-Smith L.-P., van den Braak N., Endtz H.P., Naumann D., Puppels G.J. Identification of medically relevant microorganisms by vibrational spectroscopy. J. Microbiol. Method. 2002;51:255–271. doi: 10.1016/S0167-7012(02)00127-6. - DOI - PubMed
    1. Nagels N., Hauchecorne D., Herrebout W.A. Exploring the C-X…π Halogen Bonding Motif: An Infrared and Raman Study of the Complexes of CF3X (X = Cl, Br and I) with the Aromatic Model Compounds Benzene and Toluene. Molecules. 2013;18:6829–6851. doi: 10.3390/molecules18066829. - DOI - PMC - PubMed

Publication types

MeSH terms

LinkOut - more resources