. 2014 Jan 30;505(7485):686-90.
doi: 10.1038/nature12861. Epub 2013 Nov 27.

Mutational and fitness landscapes of an RNA virus revealed through population sequencing

Affiliations

Mutational and fitness landscapes of an RNA virus revealed through population sequencing

Ashley Acevedo et al. Nature. .

Abstract

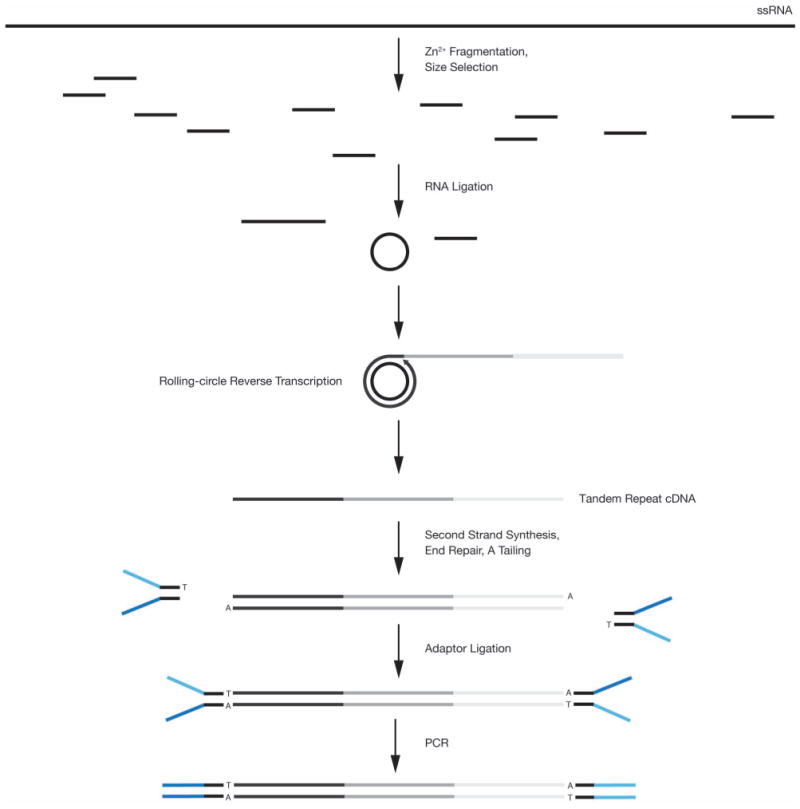
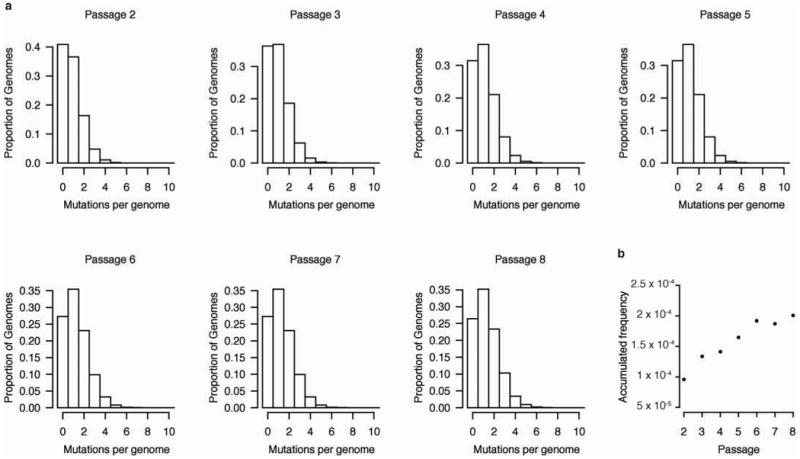
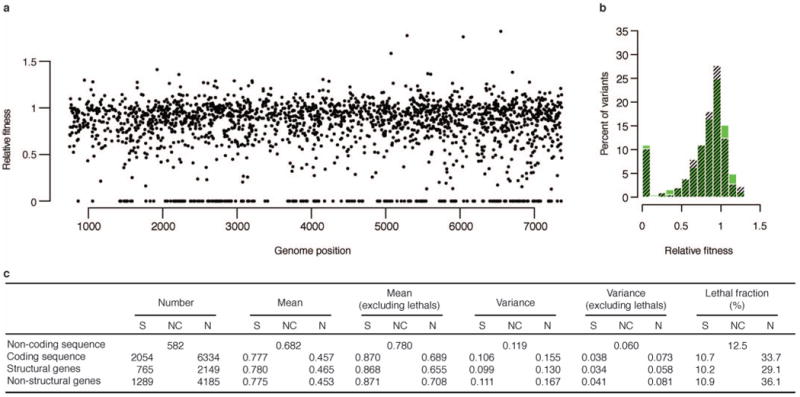
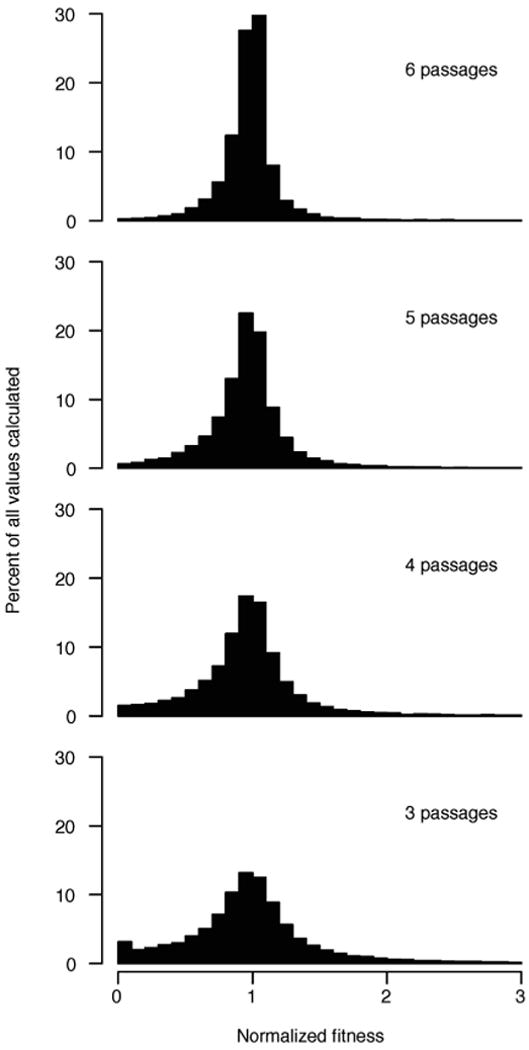
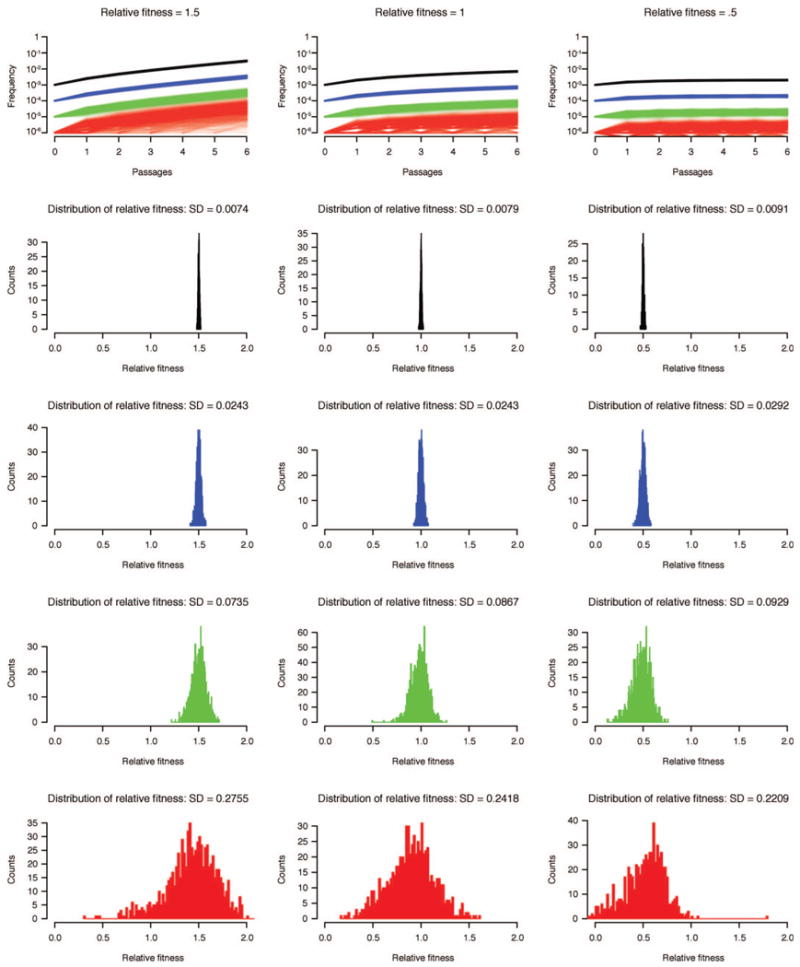
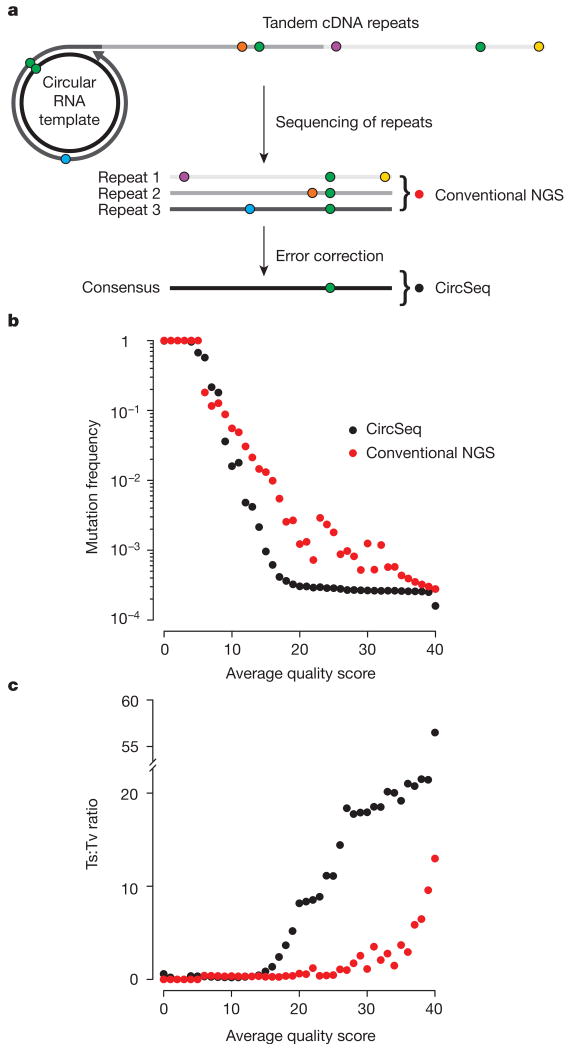
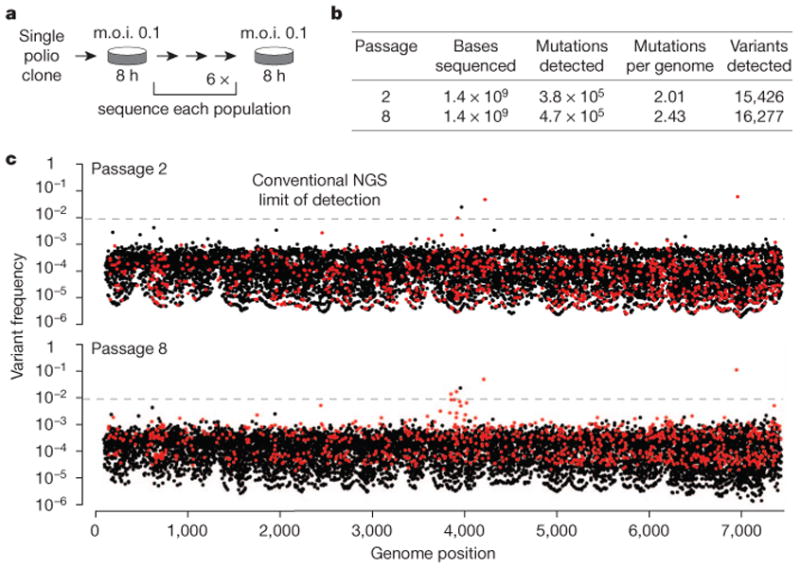
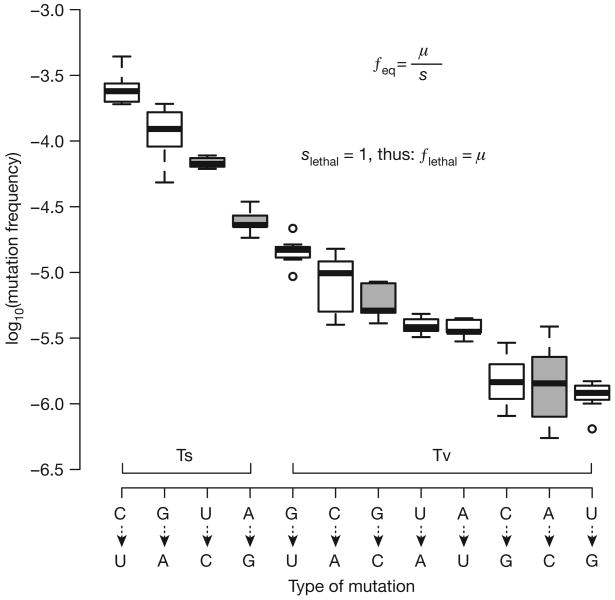
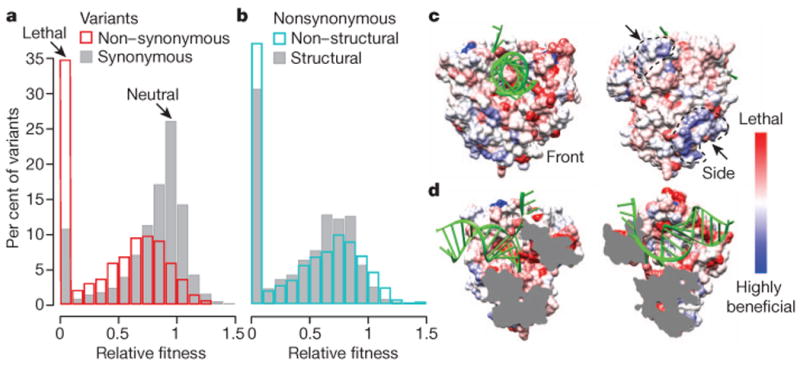
RNA viruses exist as genetically diverse populations. It is thought that diversity and genetic structure of viral populations determine the rapid adaptation observed in RNA viruses and hence their pathogenesis. However, our understanding of the mechanisms underlying virus evolution has been limited by the inability to accurately describe the genetic structure of virus populations. Next-generation sequencing technologies generate data of sufficient depth to characterize virus populations, but are limited in their utility because most variants are present at very low frequencies and are thus indistinguishable from next-generation sequencing errors. Here we present an approach that reduces next-generation sequencing errors and allows the description of virus populations with unprecedented accuracy. Using this approach, we define the mutation rates of poliovirus and uncover the mutation landscape of the population. Furthermore, by monitoring changes in variant frequencies on serially passaged populations, we determined fitness values for thousands of mutations across the viral genome. Mapping of these fitness values onto three-dimensional structures of viral proteins offers a powerful approach for exploring structure-function relationships and potentially uncovering new functions. To our knowledge, our study provides the first single-nucleotide fitness landscape of an evolving RNA virus and establishes a general experimental platform for studying the genetic changes underlying the evolution of virus populations.


Figures

Extended Data Figure 1
Extended Data Figure 1. CirSeq library preparation scheme
As described in Methods, purified populations of ssRNA viral RNA genomes are converted by a series of molecular cloning steps to a library compatible with Illumina sequencing. Illumina paired-end Y-adaptors are represented in blue.
Extended Data Figure 2
Extended Data Figure 2. Mutation frequencies of transitions and transversions
Because transitions (Ts) and transversion (Tv) occur at different rates, the overall frequencies of these types of mutations stabilize at different levels. The lower the mutation frequency, the longer it takes to stabilize, because smaller quantities of error can more dramatically impact their measured frequency. An important consideration for CirSeq is at what quality score to threshold data in order to minimize the contribution of error in the final output and maximize the total quantity of the data used.
Extended Data Figure 3
Extended Data Figure 3. Genome coverage per base
a, Coverage for sequenced passages. The coverage for each base for each library above the minimum quality threshold of average Q20 was mapped. On average, we obtained 204,205-fold coverage for our populations. The coverage profile is extremely consistent between libraries and experiments. b, Effect of RNA fragment size oncoverage bias. Use of fragments less than 80–90 bases in length results in over-representation of A-rich sequences. This bias is likely the result of inefficient priming of certain short templates by reverse transcriptase. Fragments should be at least 80–90 bases, which limits coverage bias to within approximately 10X, typical of RNA-seq.
Extended Data Figure 4
Extended Data Figure 4. Frequency measurement error
a, b, Error in measurement of mutation frequencies is determined by coverage depth and mutation frequency. A library prepared from 30 base fragments, which increases variability in the level of coverage (see Extended Data Fig. 3b) over different regions of the poliovirus genome, was broken into 10 million read sets (sets 1 and 2). The frequency of each variant for the two sets was mapped against each other to visualize their correlation. a, Measurement error can be estimated as the standard error of a binomial distribution. Per cent error is obtained by dividing this standard error by the variant frequency. Low measurement error corresponds to high correlation between variant frequencies measured in each set. b, Correlation between measured variant frequencies also corresponds to coverage, where greater coverage increases correlation. The amount of coverage required to obtain good correlation between measurements scales with variant frequency. c, Amplification bias. The distribution of frequencies of nonsense mutations generated by C > U mutation are shown for passages 2 and 3. In each case, frequencies are tightly distributed around the mean, ruling out PCR amplification bias in contributing substantially to measurement error of variant frequencies.
Extended Data Figure 5
Extended Data Figure 5. Inferred population structure and selection over seven passages
a, Simulation of population structure from sequencing data. The histograms display the proportion of genomes at each passage containing the given number of mutations (Hamming distance from the reference) after removing genomes containing lethal mutations from the population. The proportion of genomes containing single point mutations is relatively constant throughout the passages whereas the proportions of wild-type and multi-variant genomes decrease and increase, respectively. Theses proportions are based on a simulation where mutations are distributed randomly and all viable mutants have fitness equivalent to wild type. b, Accumulation of mutations by selection. The frequency of mutations accumulated as a result of selection, that is, after removing de novo mutations, is plotted for each passage. Mutations accumulate approximately linearly over the course of the experiment suggesting that selection is constant.
Extended Data Figure 6
Extended Data Figure 6. Analysis of mutational fitness effects
a, Spatial distribution of synonymous mutations by fitness effect. Synonymous mutations were binned by the magnitude of their fitness effect and plotted against their respective genome position. Each bin of fitness effects is well distributed across the genome, indicating that synonymous mutations with strong fitness effects map to discrete regions. b, The distributions of mutational fitness effects of synonymous mutations for structural (black) and non-structural (green) genes are similar. c, Summary of mutational fitness effects. Differences in variance are statistically significant between non-synonymous mutations in structural and non-structural genes both including and excluding lethal mutations (P < 0.001, one-sided F-test). Differences in variance are also statistically significant between non-synonymous and synonymous mutations the coding sequence both including and excluding lethal mutations (P < 0.001, one-sided F-test).
Extended Data Figure 7
Extended Data Figure 7. Number of passages used to calculate fitness affects accuracy
Fitness for each variant was calculated for varying numbers of serial passages and normalized to the fitness calculated using the full set of seven passages. As the number of passages used to calculate fitness increases, the variation in fitness decreases, indicating that the calculated fitness is more accurate.
Extended Data Figure 8
Extended Data Figure 8. Simulation of genetic drift and its impact on fitness measurement
Top row shows one thousand simulations of a mutation-selection-drift process in a population of 106 genomes are shown for mutations initiated at their mutation rate: 10−3 (black), 10−4 (blue), 10−5 (green) and 10−6 (red). Because of the low number of mutations in populations where the mutation rate was set to 10−6, it is common for the population to lose the mutant by drift. As frequency was plotted on alog scale,a frequency of 0 was representedas10−7. The histograms show fitness calculated using a simple mutation-selection model for each simulation. The standard deviation for each set of calculations is noted in the title of each set of simulations. The stronger drift experienced by low frequency variants reduces the accuracy of fitness measurements. To account for this effect, we have incorporated drift into our fitness model.
Figure 1
Figure 1. CirSeq substantially improves data quality
a, Schematic of the CirSeq concept. Circularized genomic fragments serve as templates for rolling-circle replication, producing tandem repeats. Sequenced repeats are aligned to generate a majority logic consensus (Methods). Green symbols represent true genetic variation. Other coloured symbols represent random sequencing error. NGS, next-generation sequencing. b, c, Comparison of overall mutation frequency (b) and transition:transversion ratio (c) for repeats analysed as three independent sequences (red circles) or as a consensus (black circles). High-quality scores indicate low error probabilities. Quality scores are represented as averages because the consensus quality score is the product of quality scores from each repeat. Data was obtained from a single passage.
Figure 2
Figure 2. CirSeq reveals the mutational landscape of poliovirus
a, Experimental evolution paradigm. A single plaque was isolated, amplified and then serially passaged at low multiplicity of infection (m.o.i.). Low m.o.i. passages were amplified to produce sufficient quantities of RNA for library preparation (Methods). b, Summary of population metrics obtained by CirSeq. c, Frequencies of variants detected using CirSeq are mapped to nucleotide position with the genome for passages 2 and 8. The conventional next-generation sequencing limit of detection (1%) is indicated by dashed lines. Each position contains up to three variants. Variants are coloured based on relative fitness, black indicating lethal or detrimental and red indicating beneficial. Sampling error can affect variant frequencies (see Methods and Extended Data Fig. 4a, b).
Figure 3
Figure 3. Determination of in vivo mutation rates of poliovirus
a, The frequency of deleterious mutations at mutation–selection balance is the mutation rate (μ) over the deleterious selection coefficient (s), see inset. For lethal mutations, s = 1, thus their frequencies equal the mutation rate. Nonsense mutations and catalytic site substitutions were used to obtain lethal mutation frequencies, and thus mutation rates, for each mutation type. Grey boxes were measured using only catalytic site mutants. n = 7 (biological replicates), whiskers represent the lowest and highest datum within 1.5 inner quartile range of the lower and upper quartile, respectively.
Figure 4
Figure 4. Fitness landscape defines structure–function relationships
a, b, Distributions of fitness for synonymous (grey) and non-synonymous (red) mutations (a) and for non-synonymous mutations in structural (grey) and non-structural (blue) genes (b). Fitness was determined as described in Methods. C > U and G > A transitions were excluded as we observed indications of hypermutation for these variants. The proportion of lethal variants for each group is likely higher, as not all possible variants were detected. Variants with fitness >1.5 are not shown. c, d, The most fit non-synonymous variant observed for each codon was mapped onto the viral polymerase (3OL6) using a red (lethal) to white (neutral) to blue (beneficial) scale. RNA is coloured green. Front and side views show two positively selected surfaces (marked by arrows) (c) and split view shows negative selection along active core and RNA binding sites (d).

Similar articles

Cited by

References

    1. Domingo E, Sabo D, Taniguchi T, Weissmann C. Nucleotide sequence heterogeneity of an RNA phage population. Cell. 1978;13:735–744. - PubMed
    1. Burch CL, Chao L. Evolvability of an RNA virus is determined by its mutational neighbourhood. Nature. 2000;406:625–628. - PubMed
    1. Vignuzzi M, Stone JK, Arnold JJ, Cameron CE, Andino R. Quasispecies diversity determines pathogenesis through cooperative interactions in a viral population. Nature. 2006;439:344–348. - PMC - PubMed
    1. Lou DI, et al. High-throughput DNA sequencing errors are reduced by orders of magnitude using circle sequencing. Proc Natl Acad Sci USA. in the press. - PMC - PubMed
    1. Sanjuán R, Nebot MR, Chirico N, Mansky LM, Belshaw R. Viral mutation rates. J Virol. 2010;84:9733–9748. - PMC - PubMed

Publication types