. 2014 Jan 30;505(7485):691-5.
doi: 10.1038/nature12862. Epub 2013 Nov 27.

Pan-viral specificity of IFN-induced genes reveals new roles for cGAS in innate immunity

Affiliations

Pan-viral specificity of IFN-induced genes reveals new roles for cGAS in innate immunity

John W Schoggins et al. Nature. .

Erratum in

  • Corrigendum: Pan-viral specificity of IFN-induced genes reveals new roles for cGAS in innate immunity.
    Schoggins JW, MacDuff DA, Imanaka N, Gainey MD, Shrestha B, Eitson JL, Mar KB, Richardson RB, Ratushny AV, Litvak V, Dabelic R, Manicassamy B, Aitchison JD, Aderem A, Elliott RM, García-Sastre A, Racaniello V, Snijder EJ, Yokoyama WM, Diamond MS, Virgin HW, Rice CM. Schoggins JW, et al. Nature. 2015 Sep 3;525(7567):144. doi: 10.1038/nature14555. Epub 2015 Jul 8. Nature. 2015. PMID: 26153856 Free PMC article. No abstract available.

Abstract

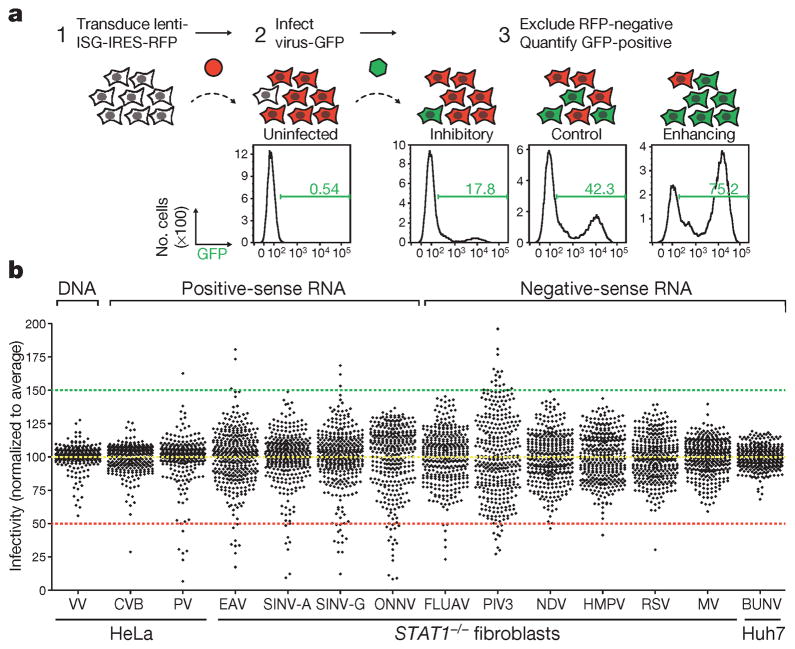
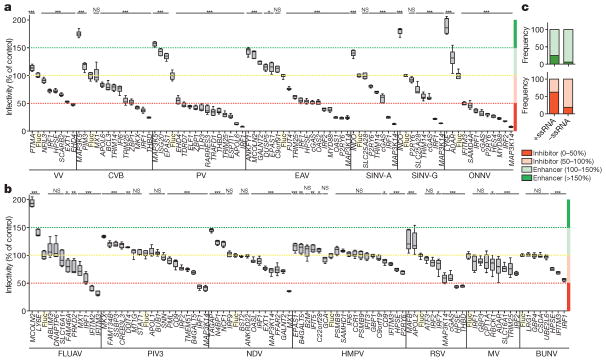
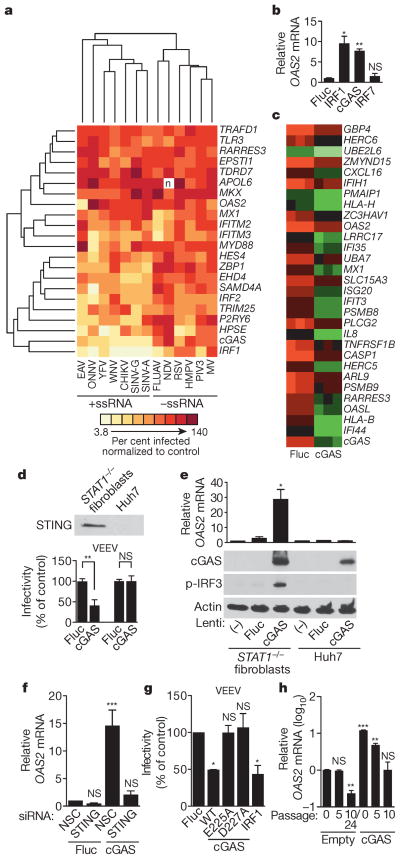
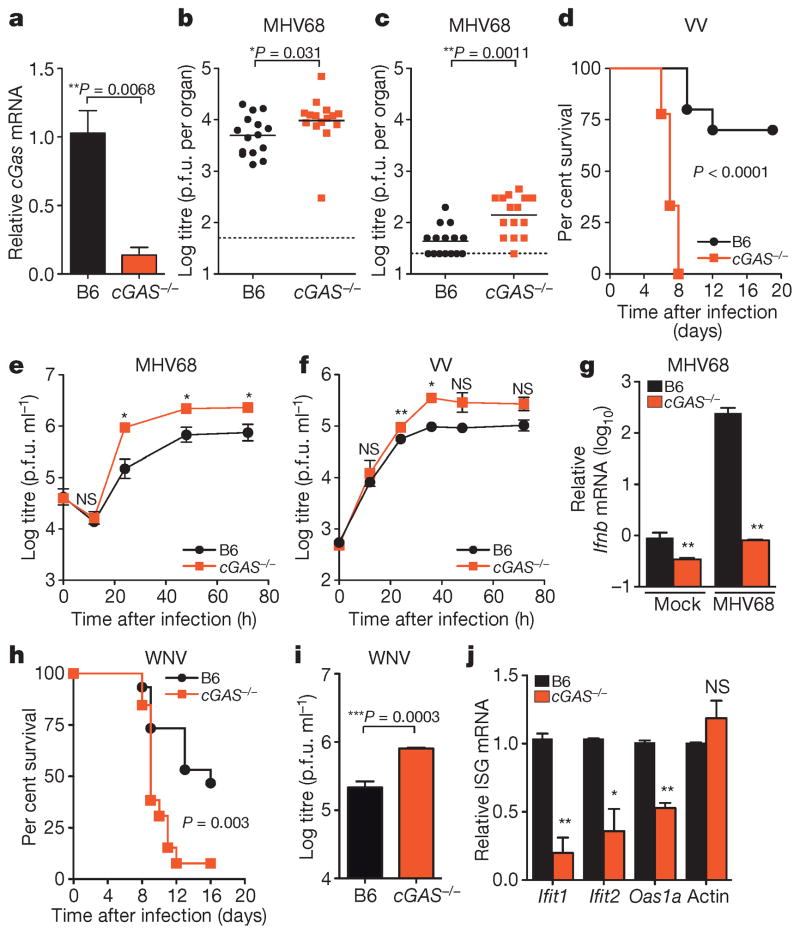
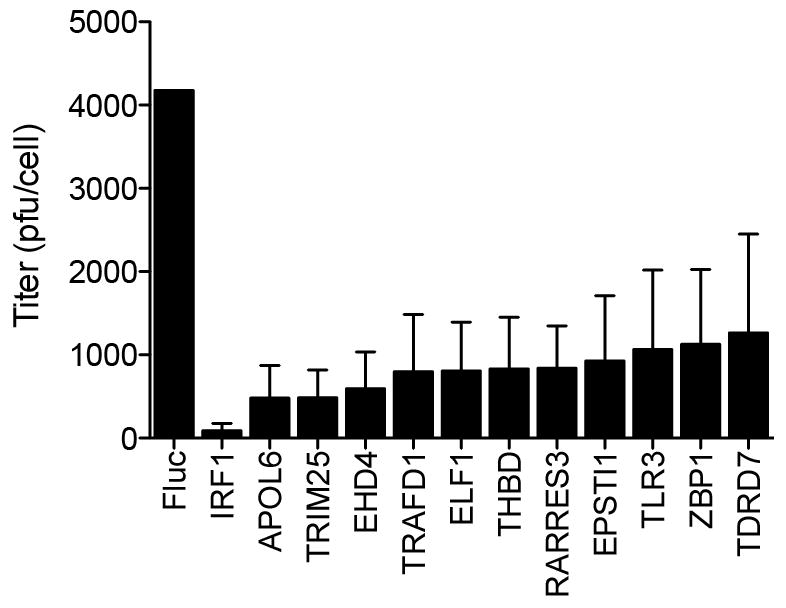
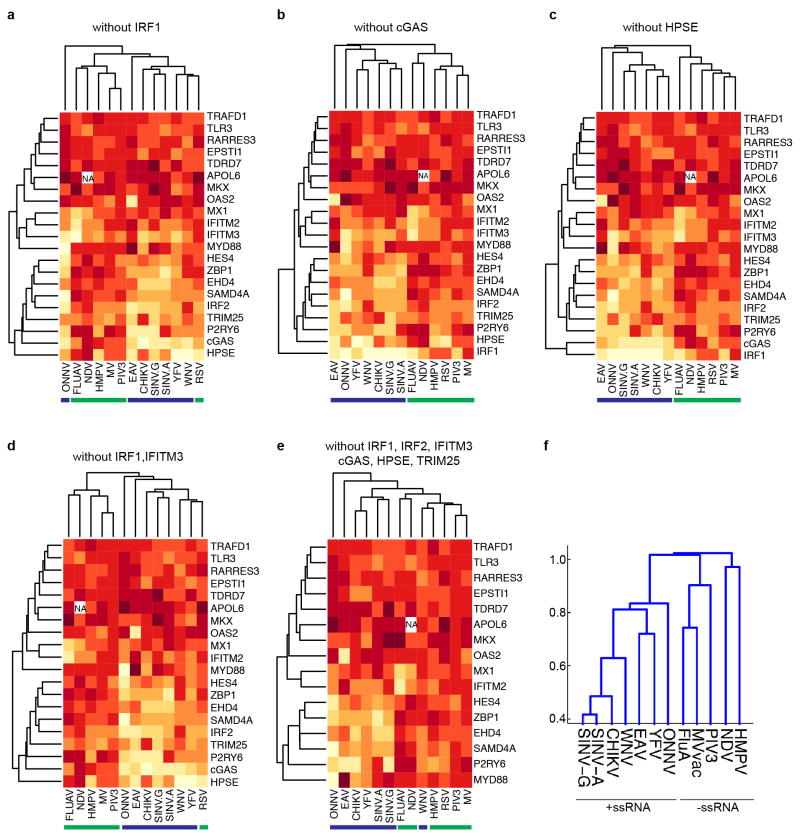
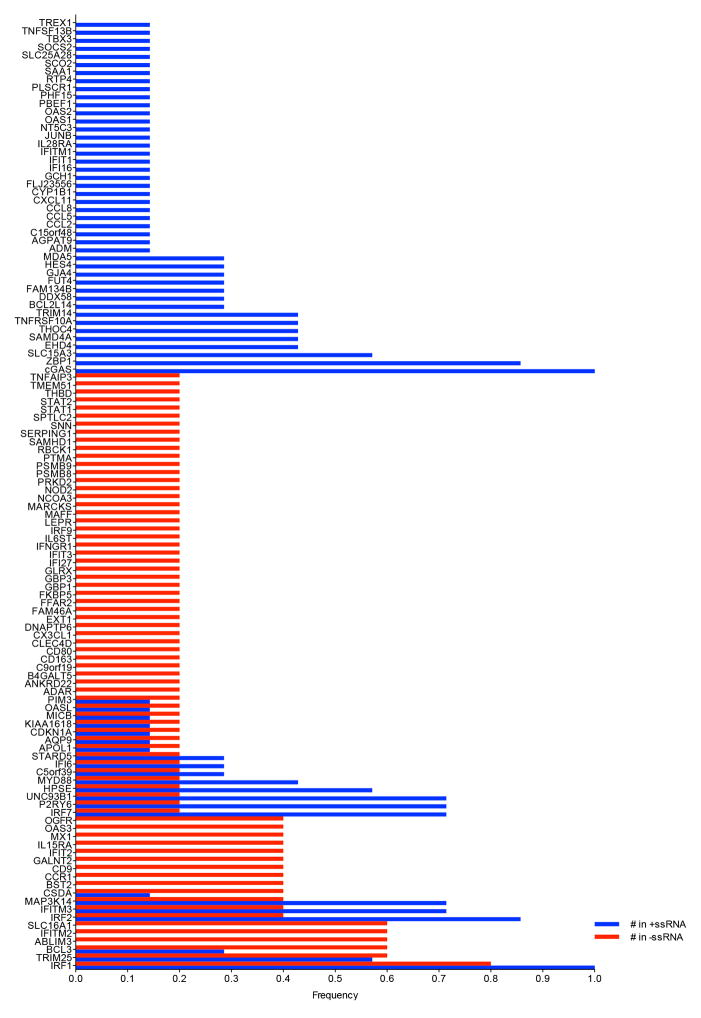
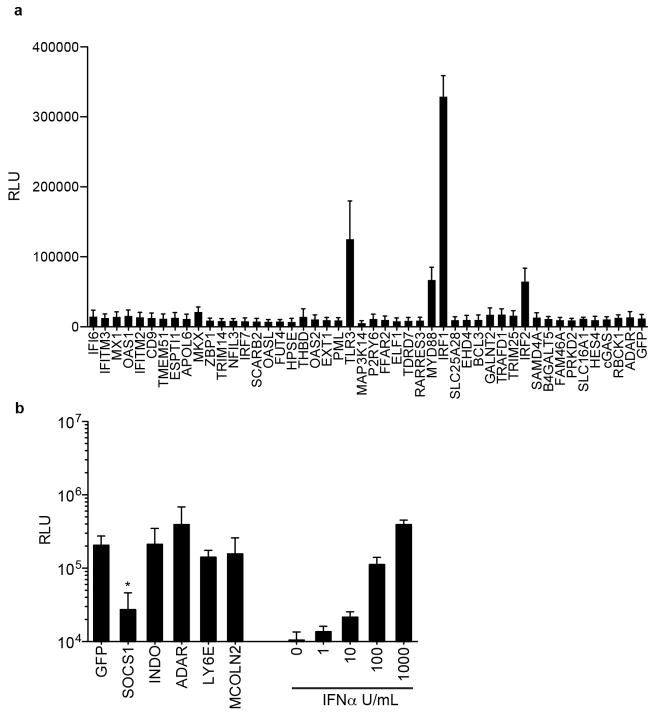
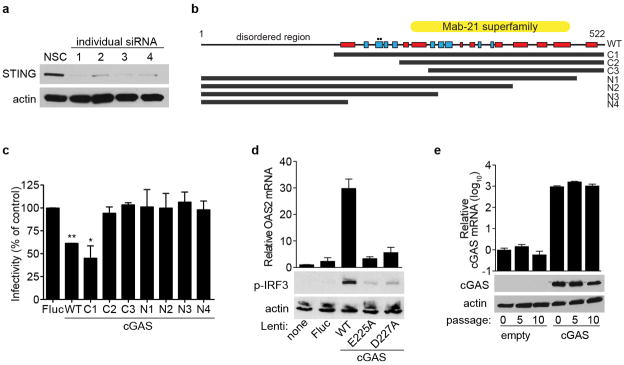
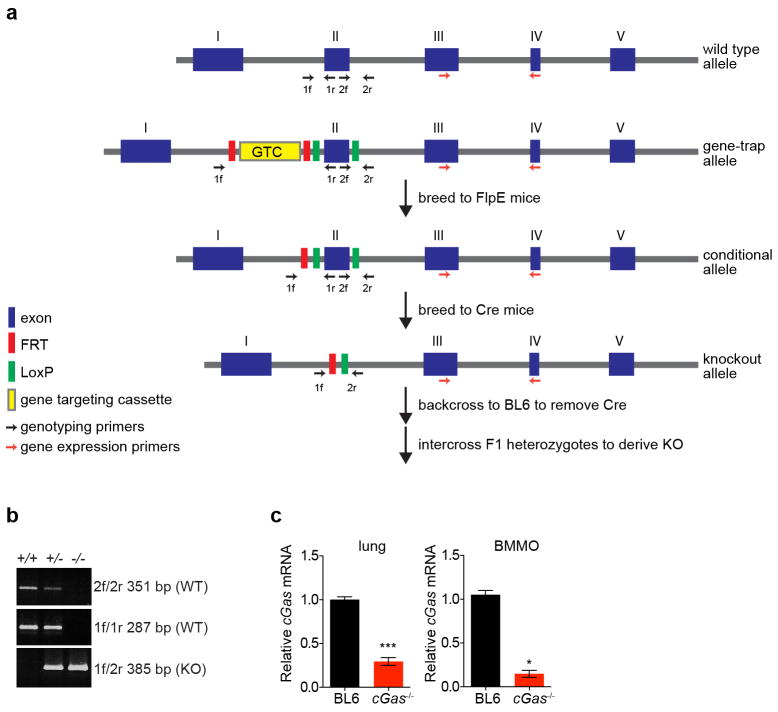
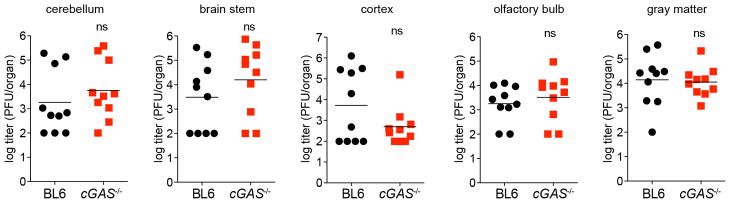
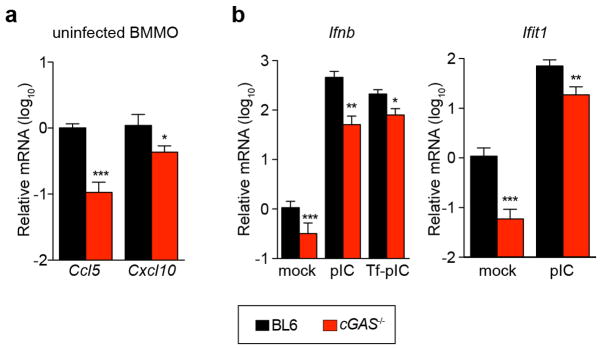
The type I interferon (IFN) response protects cells from viral infection by inducing hundreds of interferon-stimulated genes (ISGs), some of which encode direct antiviral effectors. Recent screening studies have begun to catalogue ISGs with antiviral activity against several RNA and DNA viruses. However, antiviral ISG specificity across multiple distinct classes of viruses remains largely unexplored. Here we used an ectopic expression assay to screen a library of more than 350 human ISGs for effects on 14 viruses representing 7 families and 11 genera. We show that 47 genes inhibit one or more viruses, and 25 genes enhance virus infectivity. Comparative analysis reveals that the screened ISGs target positive-sense single-stranded RNA viruses more effectively than negative-sense single-stranded RNA viruses. Gene clustering highlights the cytosolic DNA sensor cyclic GMP-AMP synthase (cGAS, also known as MB21D1) as a gene whose expression also broadly inhibits several RNA viruses. In vitro, lentiviral delivery of enzymatically active cGAS triggers a STING-dependent, IRF3-mediated antiviral program that functions independently of canonical IFN/STAT1 signalling. In vivo, genetic ablation of murine cGAS reveals its requirement in the antiviral response to two DNA viruses, and an unappreciated contribution to the innate control of an RNA virus. These studies uncover new paradigms for the preferential specificity of IFN-mediated antiviral pathways spanning several virus families.


Figures

Figure 1
Figure 1. Flow cytometry-based screens for identifying inhibitory or enhancing ISGs against 14 viruses
a, Schematic of the ectopic expression screen showing cells transduced with lentiviral vectors expressing an inhibitory ISG (IFITM3) and red fluorescent protein (RFP), a control (Fluc), or an enhancing ISG (MCOLN2). Cells were infected with influenza A virus expressing GFP, and GFP-positive cells were quantified by flow cytometry. b, Dot plots of virus infectivity in the presence of expressed ISGs. Data sets were normalized to the average of each screen, which is indicated by a yellow dotted line. The 50% inhibitory and 150% enhancing effects are denoted by red and green dotted lines, respectively. Bunyamwera virus, BUNV; Coxsackie B virus, CVB; equine arterivirus, EAV; influenza A virus, FLUAV; human metapneumovirus, HMPV; measles virus, MV; Newcastle disease virus, NDV; o’nyong-nyong virus, ONNV; human parainfluenza virus type 3, PIV3; poliovirus, PV; respiratory syncytial virus, RSV; Sindbis virus AR86, SINV-A; Sindbis virus Girdwood, SINV-G.
Figure 2
Figure 2. Confirmatory assays for selected inhibitory and enhancing ISGs
a, b, Independent confirmatory assays against DNA and +ssRNA viruses (a) and –ssRNA viruses (b) were carried out using new lentivirus stocks. Data were normalized to a Fluc control, highlighted in a yellow box and by dotted line. Data are presented as box and whisker plots; whiskers extend to show the highest and lowest values. Data represent six technical replicates to control for intra-assay variability. Statistical significance was determined by one-way analysis of variance (ANOVA) (*P <0.05, **P <0.01, ***P <0.001; NS, not significant). The 50% inhibitory and 150% enhancing effects are denoted by red and green dotted lines, respectively. c, Comparative analysis showing the frequency with which confirmed inhibitory or enhancing ISGs targeted +ssRNA or –ssRNA viruses.
Figure 3
Figure 3. cGAS activates an IRF3-driven antiviral program independently of canonical IFN/STAT1 signalling
a, Hierarchical clustering analysis of 22 ISGs and 13 viruses screened in STAT1−/− fibroblasts. CHIKV, chikungunya virus; YFV, yellow fever virus. b, OAS2 gene expression in STAT1−/− fibroblasts transduced with lentiviruses expressing IRF7, IRF1, cGAS and Fluc. Data represent one of two experiments performed in duplicate. c, Microarray analysis of STAT1−/− fibroblasts transduced with lentiviruses expressing Fluc or cGAS. Data show a subset of genes (green) induced 2.5-fold with P <0.05, n = 3 (using Benjamini–Hochberg false discovery rate correction). Data represent one of two independent experiments. d, Top, western blot of STING expression in STAT1−/− fibroblasts and Huh7 cells. Bottom, infectivity of Venezuelan equine encephalitis virus (VEEV) in STAT1−/− fibroblasts and Huh7 cells transduced with lentivirus expressing Fluc or cGAS. Virus infectivity was normalized to Fluc control. e, OAS2 mRNA expression (top) and western blots (bottom) of cGAS, phosphorylated IRF3 (p-IRF3) and control actin in STAT1−/−fibroblasts and Huh7 cells transduced with lentiviruses expressing Fluc or cGAS. f, Antiviral gene expression in STAT1−/− fibroblasts that were depleted of STING by siRNA (Extended Data Fig. 5a) before transduction with lentiviruses expressing Fluc or cGAS. NSC, non-silencing siRNA control. g, Infectivity of VEEV in STAT1−/− fibroblasts transduced with Fluc control, wild type (WT) or point mutant (E225A, D227A) cGAS, or IRF1. Virus infectivity was normalized to Fluc control. h, OAS2 mRNA induction in STAT1−/−fibroblasts stably expressing cGAS or an empty cassette. RNA samples were processed at the indicated cell passage number. In dg, data represent the means of two or three independent experiments performed in triplicate. In h, data represent one of two independent experiments with similar results. Error bars represent s.d. Statistical significance was determined by t-test or one-way ANOVA (*P <0.05, **P <0.01, ***P <0.001; NS, not significant).
Figure 4
Figure 4. Requirement for cGAS in controlling viral infection in vivo
a, Quantitative PCR with reverse transcription (qRT–PCR) of relative cGas expression in spleens of wild-type (B6) and cGas−/− mice. n = 3 mice per group. Error bars represent s.e.m. Statistical significance was determined by t-test. b, c, Viral titres in spleen (b) and lungs (c) of wild-type and cGas−/− mice after infection with 106 plaque-forming units (p.f.u.) of MHV68, n = 15 mice per group. Statistical significance was determined by Mann–Whitney test. d, Survival curves of wild-type and cGas−/− mice infected with 8000 p.f.u. of VV, n = 10 (wild type), n = 9 (cGas−/−). Statistical significance was determined by log rank test. e, f, i, Viral titres from BMMO after infection with 10 multiplicity of infection (m.o.i.) MHV68 (e), 0.1 m.o.i. VV (f) or 0.1 m.o.i. WNV (i). Data represent three (e, f) or four (i) independent experiments performed in triplicate. Error bars represent s.e.m. Statistical significance was determined by t-test. g, qRT–PCR of relative Ifnb expression in BMMO infected with MHV68 for 6 h. Data represent means of three experiments performed in triplicate. Error bars represent s.d. Statistical significance was determined by t-test. h, Survival curves of wild-type and cGas−/− mice infected with 100 p.f.u. of WNV, n = 10 (wild type), n = 9 (cGas−/−). j, qRT–PCR of baseline gene expression (Ifnb, Ifit1, Ifit2, Oas1a, actin) in wild-type and cGas−/− BMMO. Data represent means of two experiments performed in triplicate. Error bars represent s.d. Statistical significance was determined by t-test. In all panels, *P <0.05, **P <0.01, ***P <0.001; NS, not significant.
Extended Data Figure 1
Extended Data Figure 1. Antiviral effects of ISGs on virus production of a non-GFP poliovirus
HeLa cells were transfected with plasmids encoding ISGs and 48 h later infected with P1M (10 m.o.i.) for 16 h. Lysates were collected and viral titres determined by plaque assay on HeLa cell monolayers, as described in Methods. Plaque assays were performed in duplicate. Data represent the average of three independent experiments. Error bars represent s.d.
Extended Data Figure 2
Extended Data Figure 2. Hierarchical clustering
a–e, Analyses were performed as described in Methods. In each cluster, one or more ISGs were removed from the analysis in Fig. 3a to determine whether virus clustering is driven by a subset of one or more dominant genes. Blue and green bars underscore +ssRNA and −ssRNA viruses, respectively. f, The top 30 ISG inhibitors from the primary screens were compiled as a gene list and transformed to a binarized vector for clustering using MATLAB Statistics Toolbox (see Methods). A dendrogram was generated from the clustering analysis to show how viruses relate to each other with respect to the ISGs that target them.
Extended Data Figure 3
Extended Data Figure 3. Co-occurrence of top 20 antiviral ISGs from primary screens
ISGs were assigned a frequency on the basis of the number of times the gene appeared in a list of the 20 most inhibitory genes from 7 +ssRNA or 5 −ssRNA virus screens. A frequency of 1 indicates an occurrence of 100% across all gene lists. Co-occurrence is reflected by adjacent red and blue bars.
Extended Data Figure 4
Extended Data Figure 4. Effects of ISGs on ISRE-dependent transcription
a, 293 cells were transduced with lentiviruses expressing ISGs, followed by transfection with an ISRE reporter plasmid expressing Fluc. Cells were assayed for Fluc activity 24 h after transfection. b, 293 cells were co-transfected with ISG-expressing plasmids and an ISRE reporter plasmid. The cells were then treated overnight with 1,000 U ml−1 interferon-α (IFN-α), followed by Fluc activity assay. Data represent the average of three independent experiments performed in triplicate. Error bars represent s.d. Statistical significance was determined by one-way ANOVA or t-test. *P <0.05, ***P <0.001.
Extended Data Figure 5
Extended Data Figure 5. cGAS mechanistic studies
a, STAT1−/− fibroblasts were transfected with individual siRNAs targeting STING. Cell lysates were processed 48 h after transfection for western blot with anti-STING- or anti-actin-specific antibodies. From these results, siRNA no. 1 was chosen for additional studies. b, Schematic of cGAS protein sequence and truncation mutants. Red box, α-helix; blue box, β-sheet. Circles denote catalytic residues E225A and D227A. c, STAT1−/− fibroblasts were transduced with lentivirus expressing control or cGAS (wild type and truncation mutants). Cells were infected 48 h after transduction with VEEV-GFP and infectivity was monitored by FACS. Data represent the mean of two independent experiments. Error bars represent s.d. Statistical significance was determined by one-way ANOVA. *P <0.05, **P <0.01. d, STAT1−/− fibroblasts were transduced with lentivirus expressing control or cGAS (wild type and mutants). Cells were collected 48 h after transduction and total RNA was analysed for OAS2 mRNA induction relative to RPS11 (top), or protein lysates were analysed for phospho-IRF3 and actin expression by western blot (bottom). e, STAT1−/− fibroblasts were transduced with a puromycin-selectable lentivirus expressing cGAS and placed under selection. At various passages, cells were collected and total RNA was analysed for OAS2 mRNA induction relative to RPS11 (top), or protein lysates were analysed for cGAS and actin expression by western blot (bottom). Western blot and cGAS mRNA data represent one of two independent experiments, each showing similar results. OAS2 mRNA data are presented as the average of two independent experiments, each performed in triplicate. Error bars represent s.d.
Extended Data Figure 6
Extended Data Figure 6. Gene-targeting strategy to create cGas knockout mice
a, Mice expressing a cGas exon 2 gene-trap cassette were crossed to FlpE-expressing mice to generate conditional knockouts. These mice were then crossed to Cre-expressing mice to generate the knockout allele with a deletion of exon 2, which contains the cGAS catalytic sites. Mice were backcrossed to remove Cre, and cGas+/− mice were intercrossed to derive cGas−/− mice. b, PCR products from genomic DNA of cGas+/+, cGas+/− and cGas−/− mice using primers outlined in a. c, qRT–PCR of relative cGas expression in lungs (left) or BMMO (right) from wild-type B6 and cGas−/− mice. Data from lung represent means of three mice per group. Data from BMMO were derived from two independent experiments performed in triplicate. Error bars represent s.e.m. Statistical significance was determined by t-test. *P <0.05, ***P <0.001.
Extended Data Figure 7
Extended Data Figure 7. Viral burden in mice infected with WNV
Wild-type or cGas−/− mice were infected with WNV and viral titres in several regions of the brain were determined by plaque assay. n = 10 mice per group. Statistical significance was determined by t-test.
Extended Data Figure 8
Extended Data Figure 8. Role for cGAS in BMMO activation
a, BMMO from wild-type and cGas−/− mice were analysed for baseline expression of chemokines Ccl5 and Cxcl10 by RT–PCR. b, BMMO from wild-type and cGas−/− mice were treated with polyIC (pIC) or transfected with polyIC (Tf-pIC) and Ifnb and Ifit1 levels were determined by qRT–PCR. In both panels, gene expression levels are relative to the housekeeping gene RPS29 and normalized to mock-treated wild-type cells. Data represent two experiments performed in triplicate. Error bars represent s.d. Statistical significance was determined by t-test. *P <0.05, **P <0.01, ***P <0.001.

Comment in

References

    1. Der SD, Zhou A, Williams BR, Silverman RH. Identification of genes differentially regulated by interferon α, β, or γ using oligonucleotide arrays. Proc Natl Acad Sci USA. 1998;95:15623–15628. - PMC - PubMed
    1. de Veer MJ, et al. Functional classification of interferon-stimulated genes identified using microarrays. J Leukoc Biol. 2001;69:912–920. - PubMed
    1. Schoggins JW, Rice CM. Interferon-stimulated genes and their antiviral effector functions. Curr Opin Virol. 2011;1:519–525. - PMC - PubMed
    1. Schoggins JW, et al. A diverse range of gene products are effectors of the type I interferon antiviral response. Nature. 2011;472:481–485. - PMC - PubMed
    1. Liu SY, Sanchez DJ, Aliyari R, Lu S, Cheng G. Systematic identification of type I and type II interferon-induced antiviral factors. Proc Natl Acad Sci USA. 2012;109:4239–4244. - PMC - PubMed

Publication types

MeSH terms

Associated data