. 2014 Feb 1;306(3):C263-78.
doi: 10.1152/ajpcell.00381.2012. Epub 2013 Nov 27.

Prostaglandin E2 induces chloride secretion through crosstalk between cAMP and calcium signaling in mouse inner medullary collecting duct cells

Affiliations

Prostaglandin E2 induces chloride secretion through crosstalk between cAMP and calcium signaling in mouse inner medullary collecting duct cells

Madhumitha Rajagopal et al. Am J Physiol Cell Physiol. .

Abstract

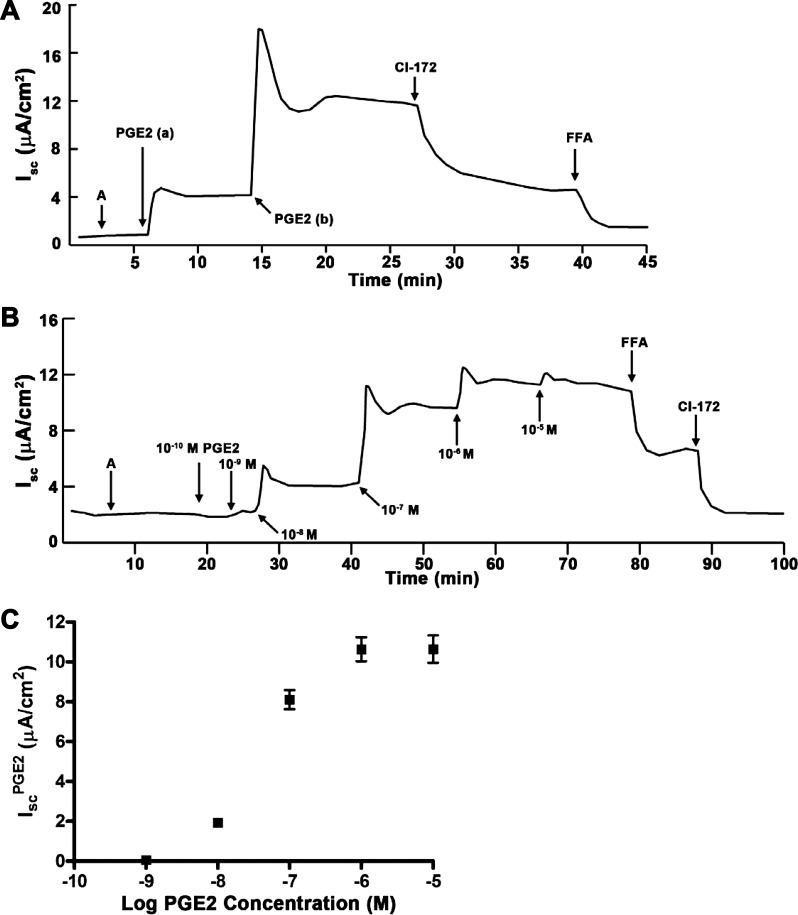
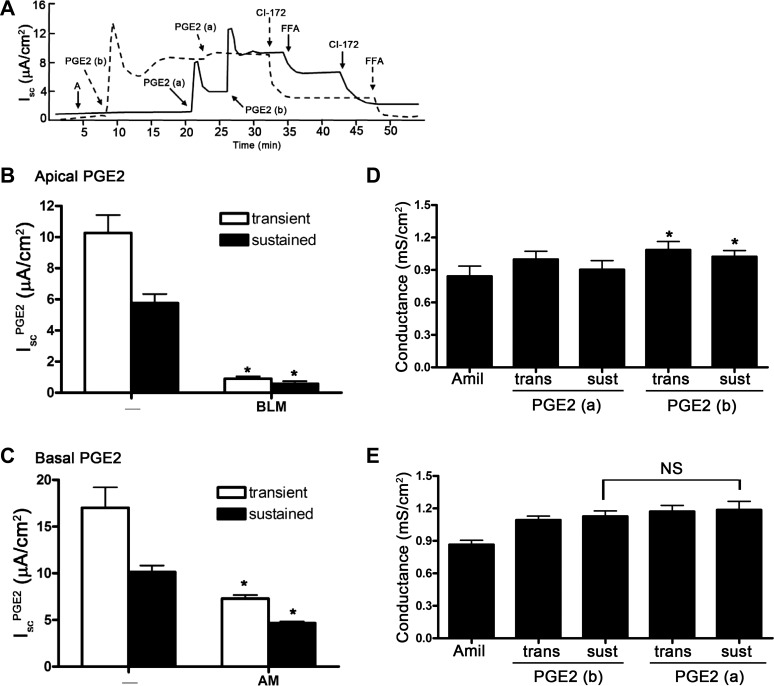
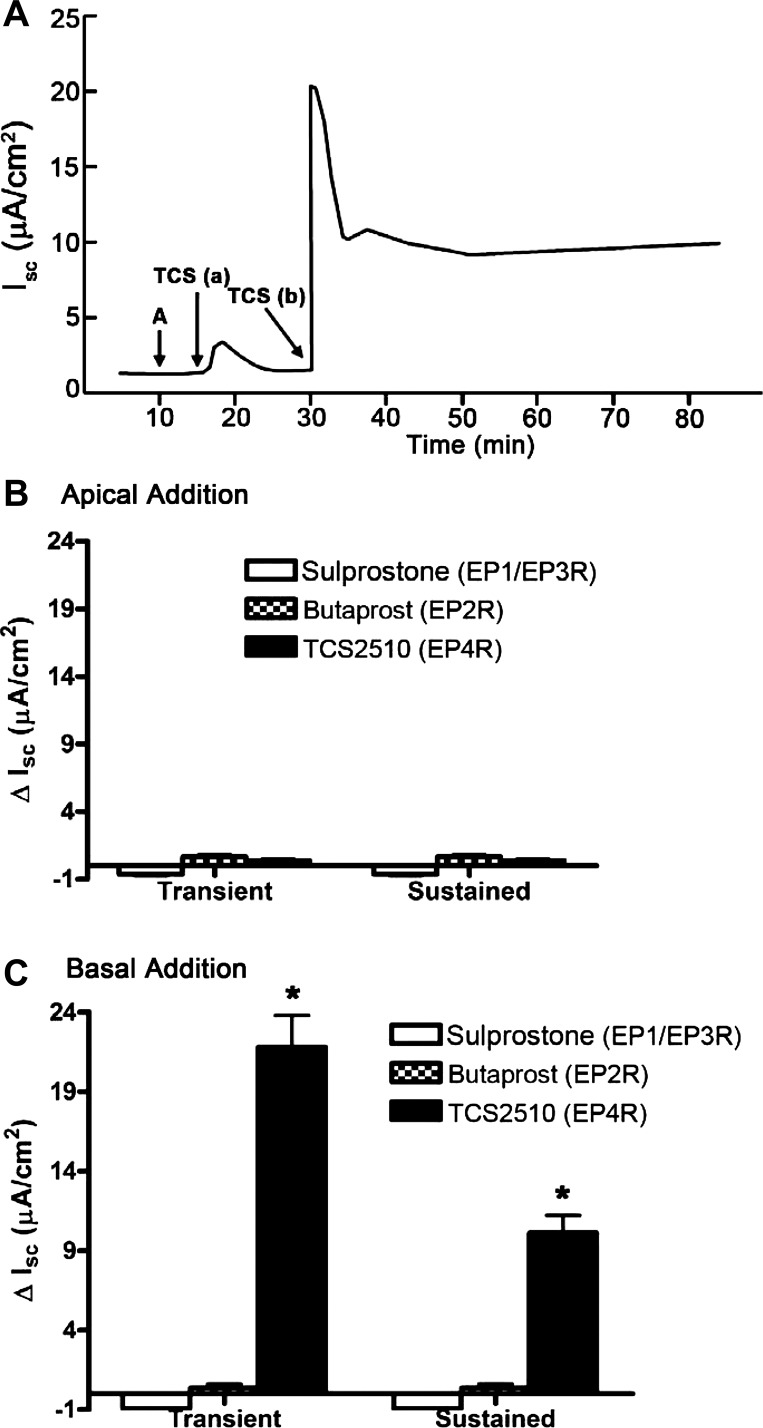
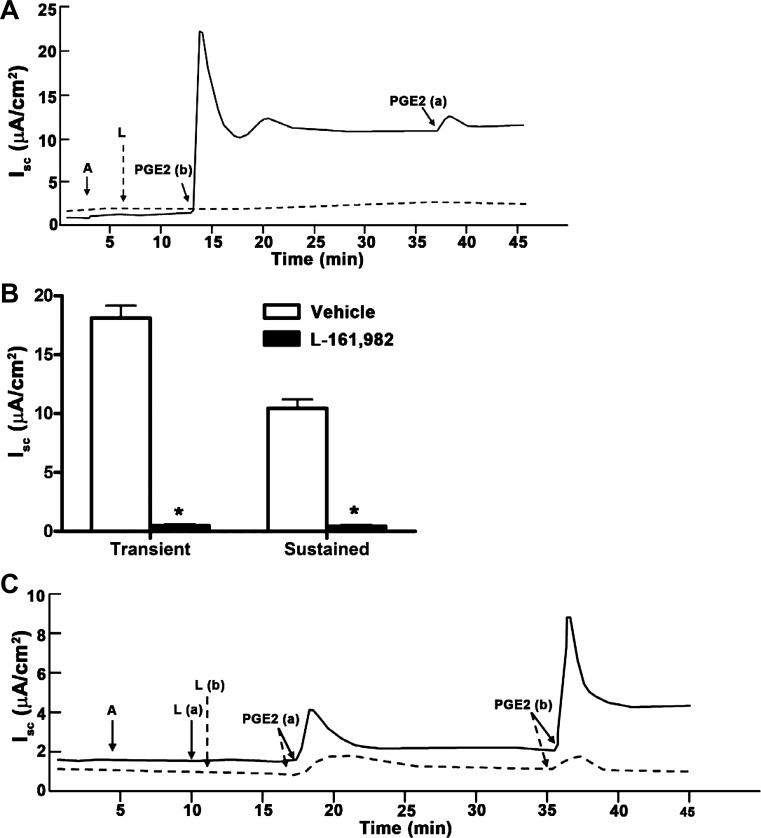
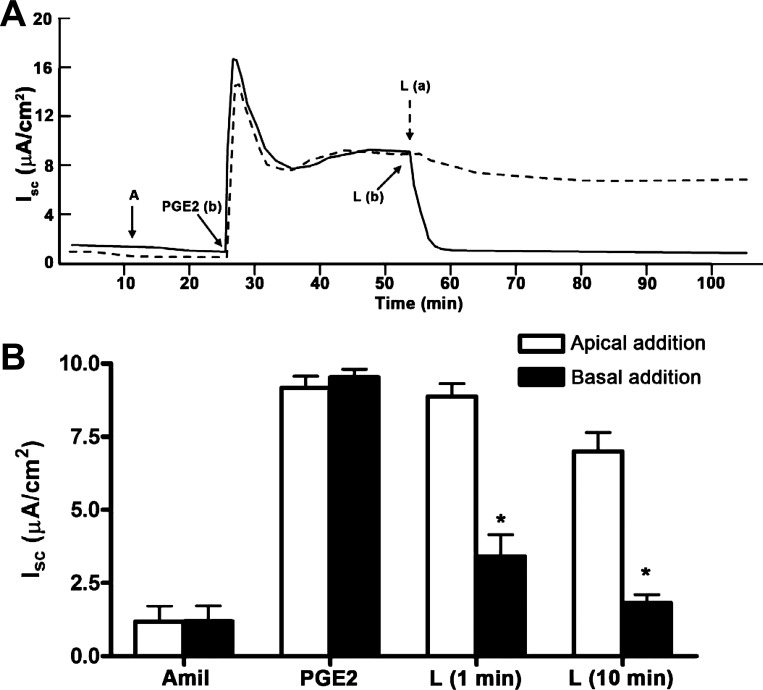
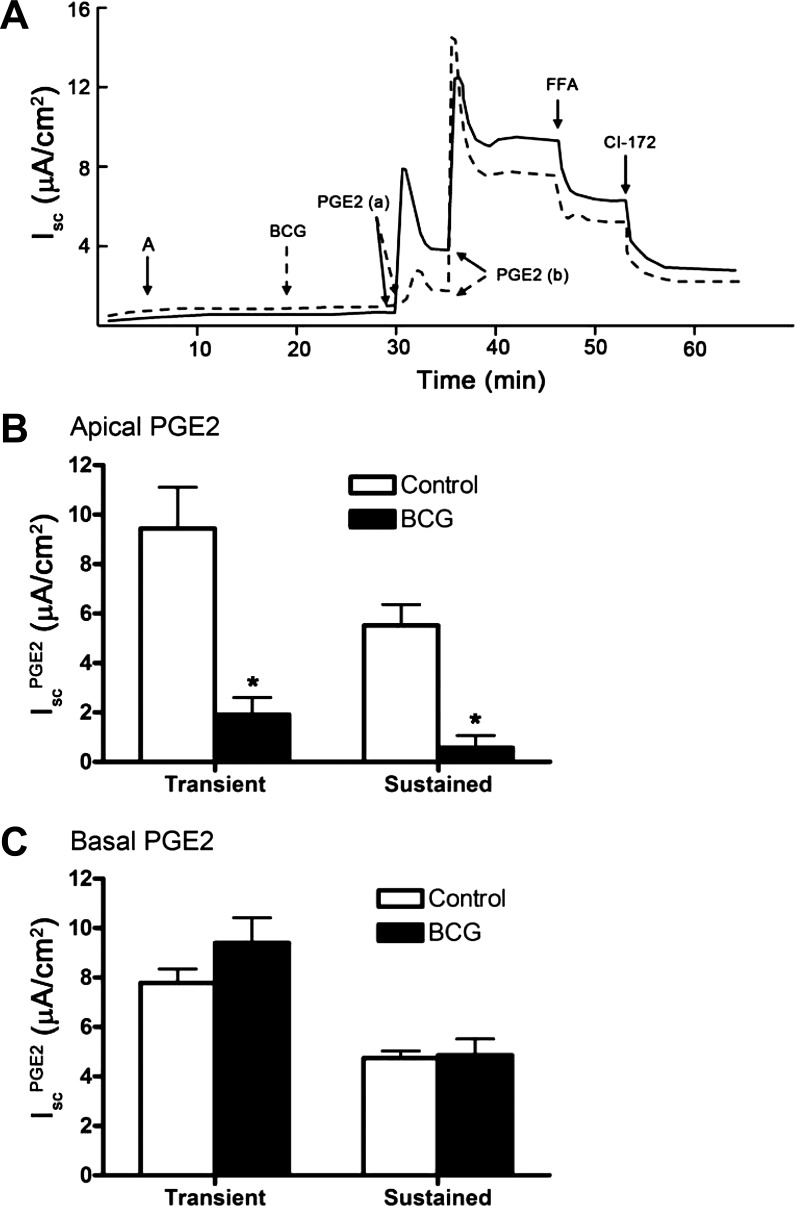
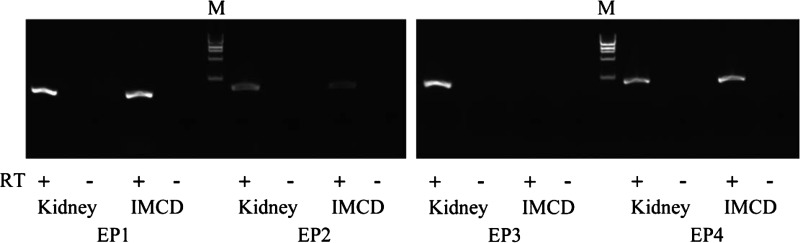
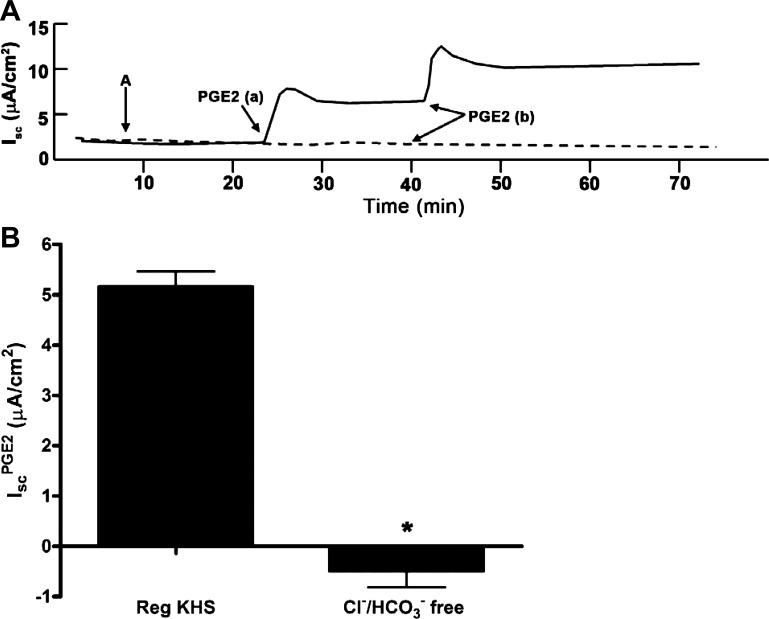
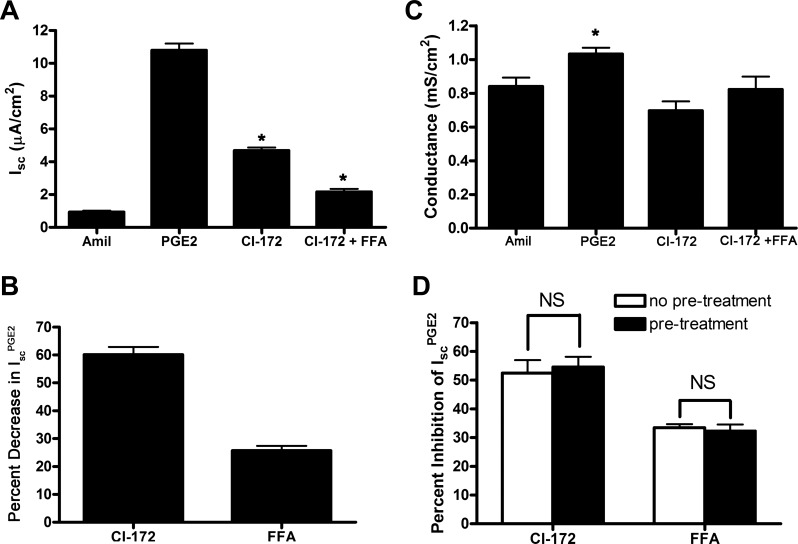
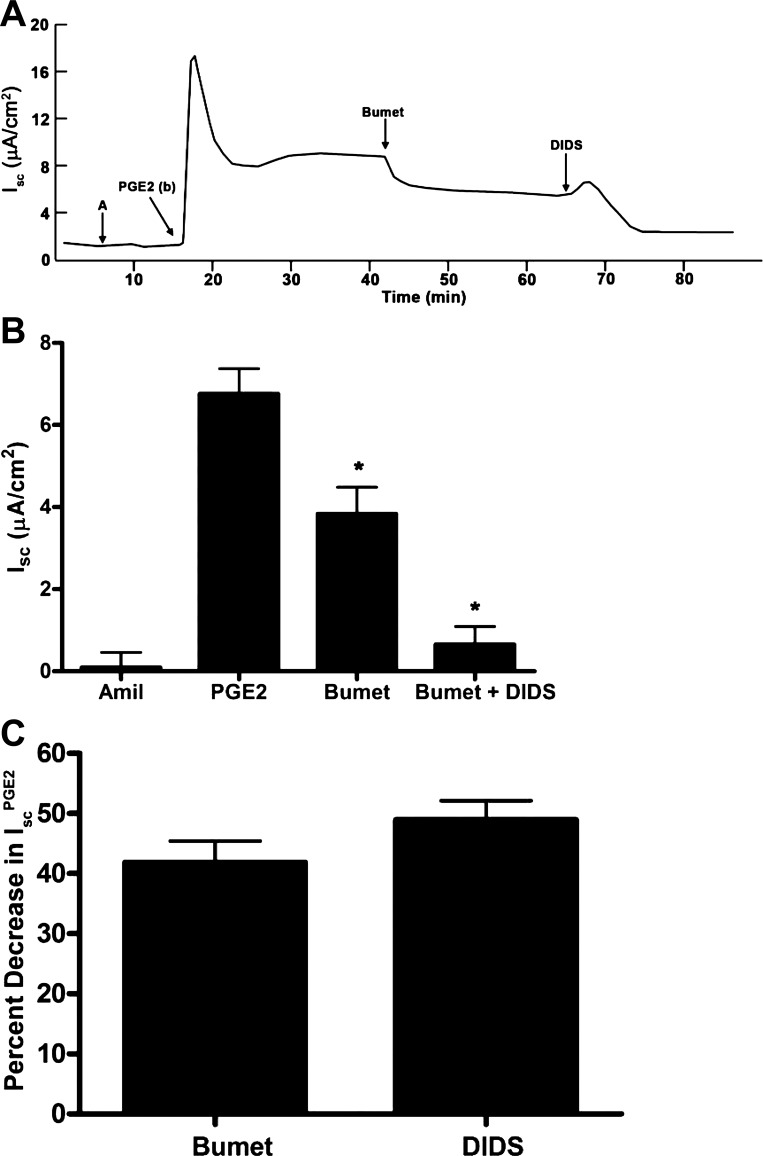
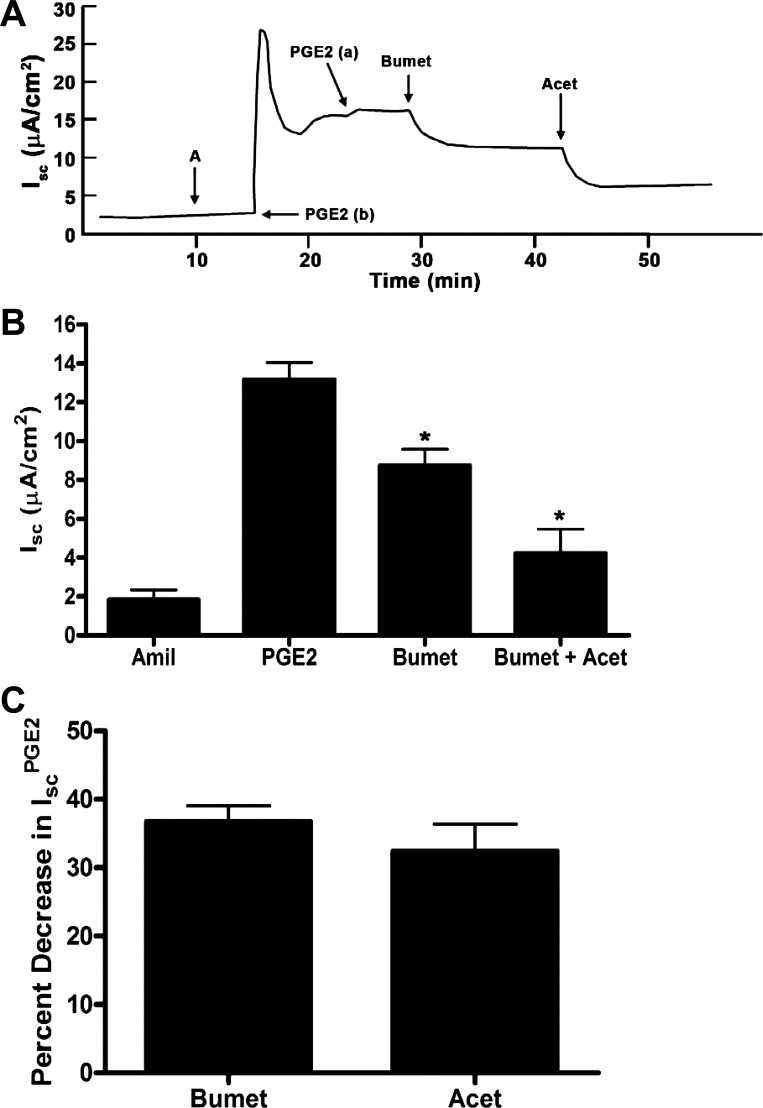
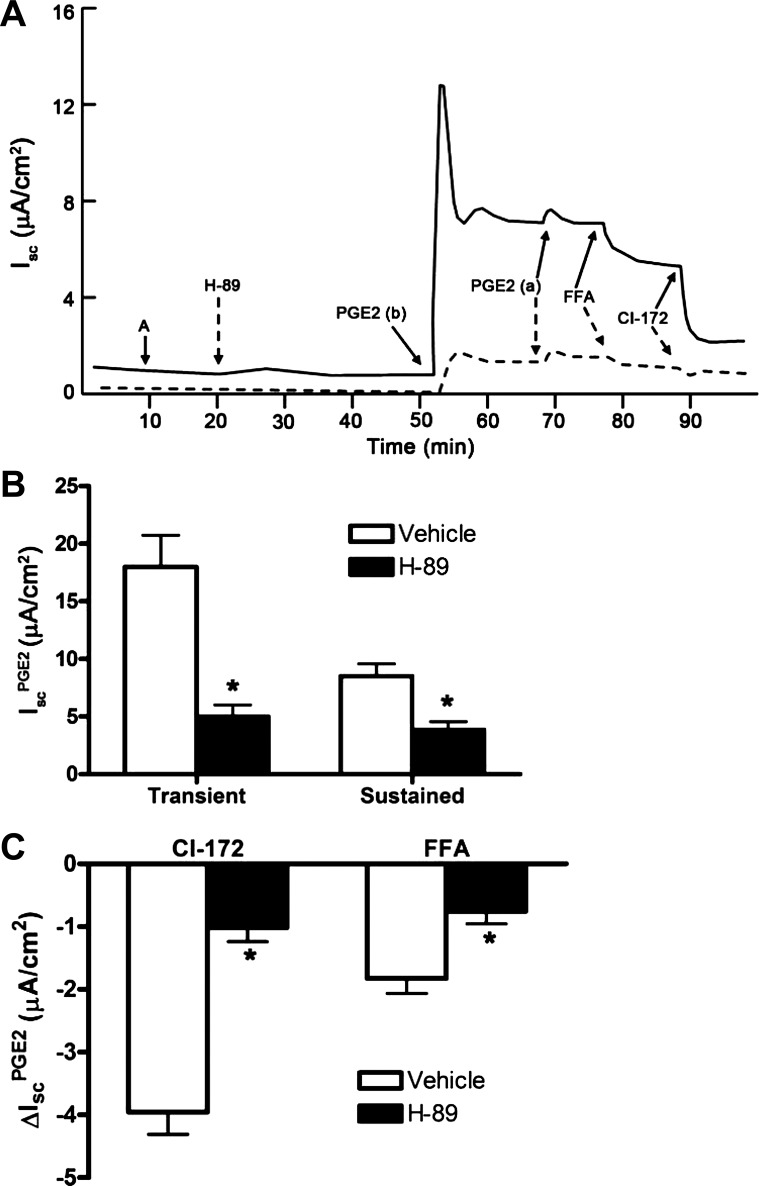
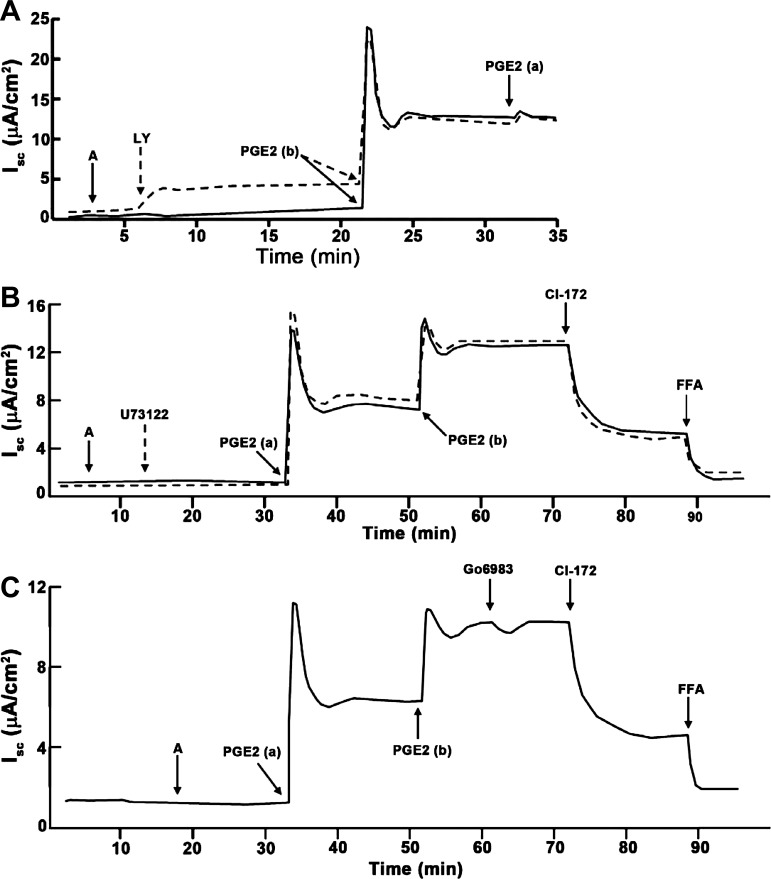
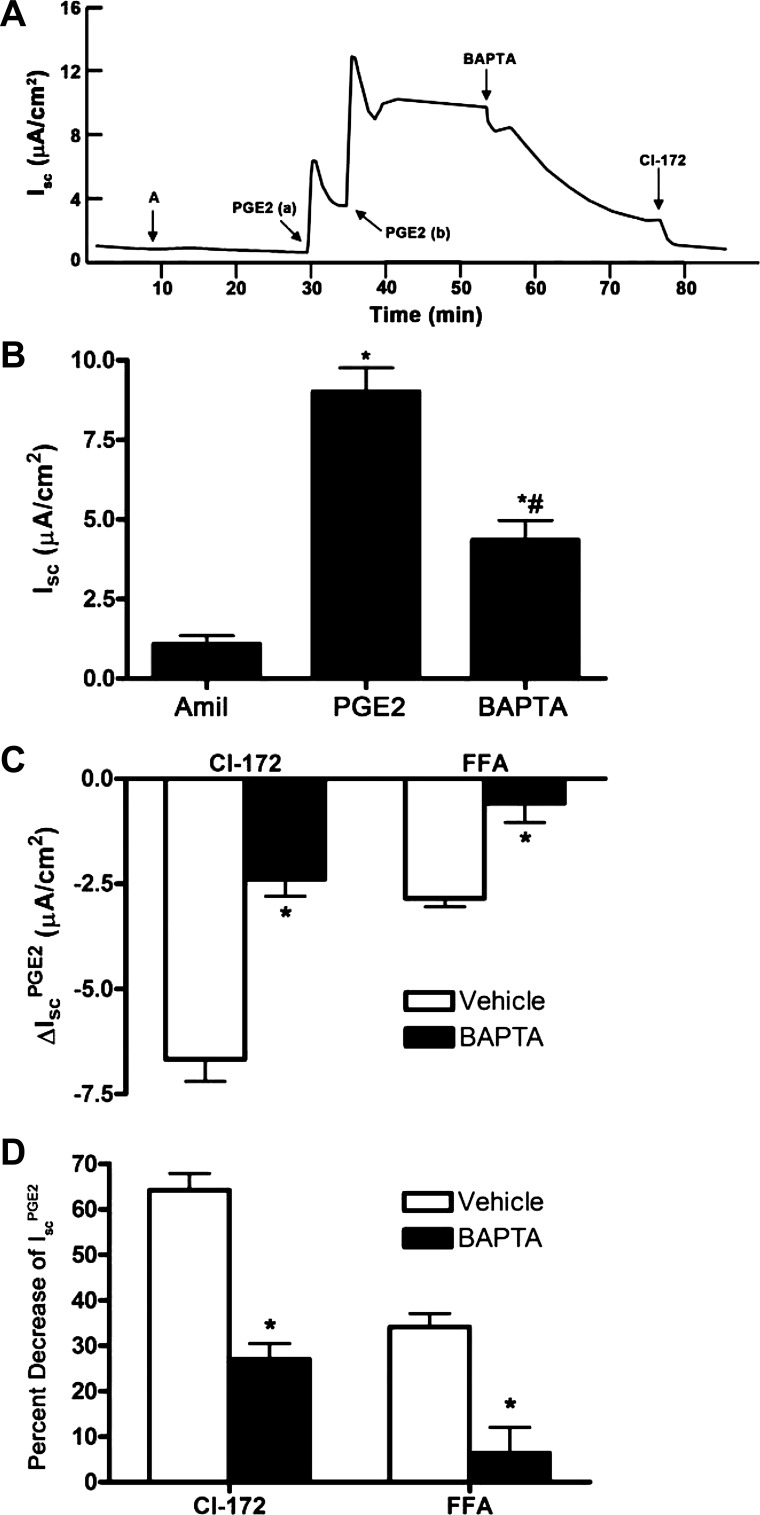
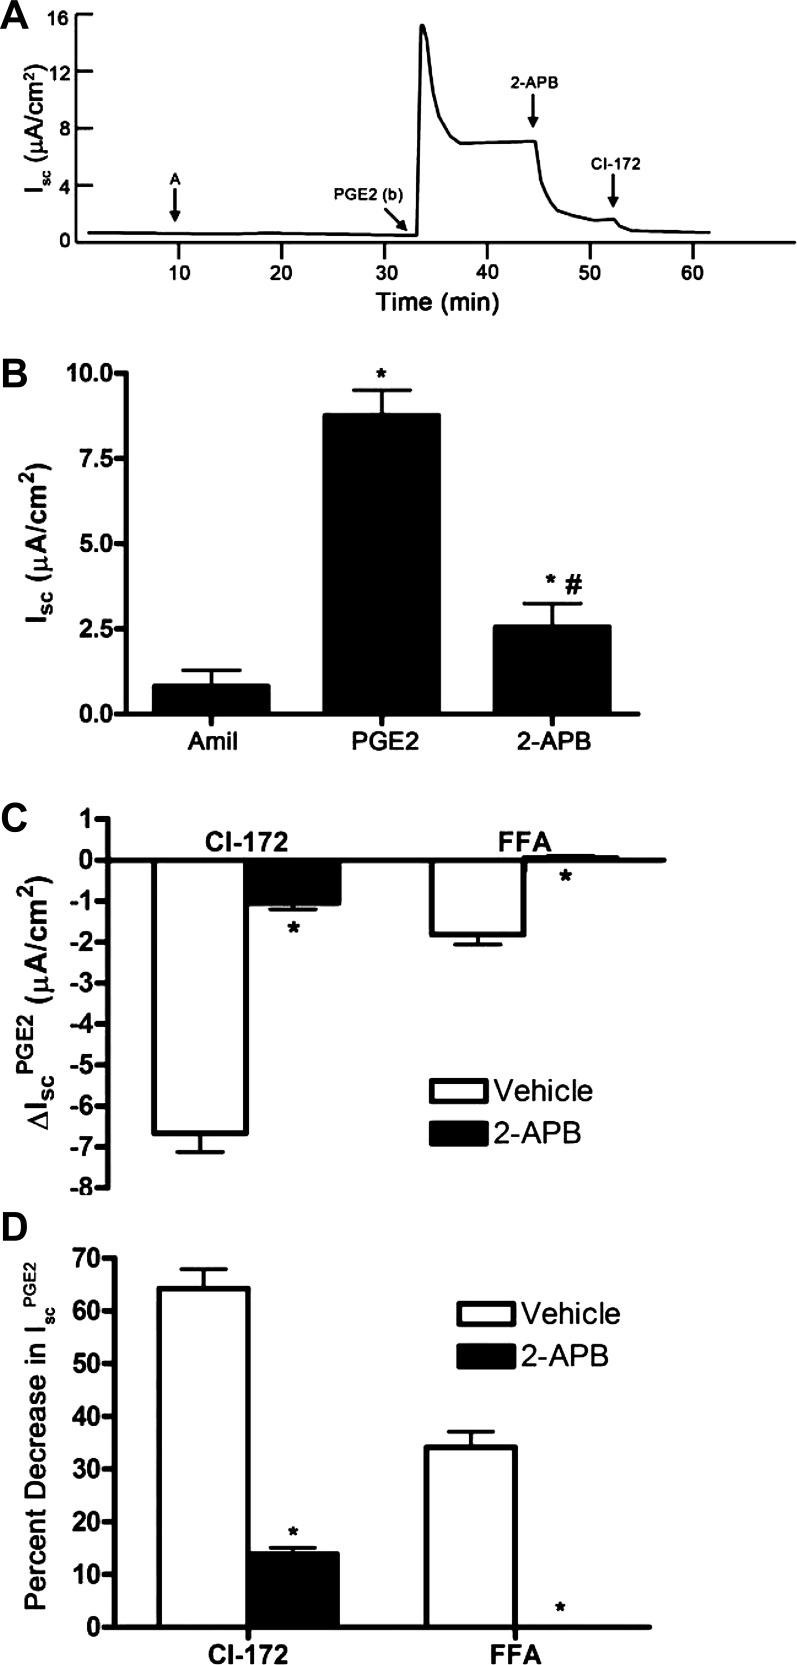
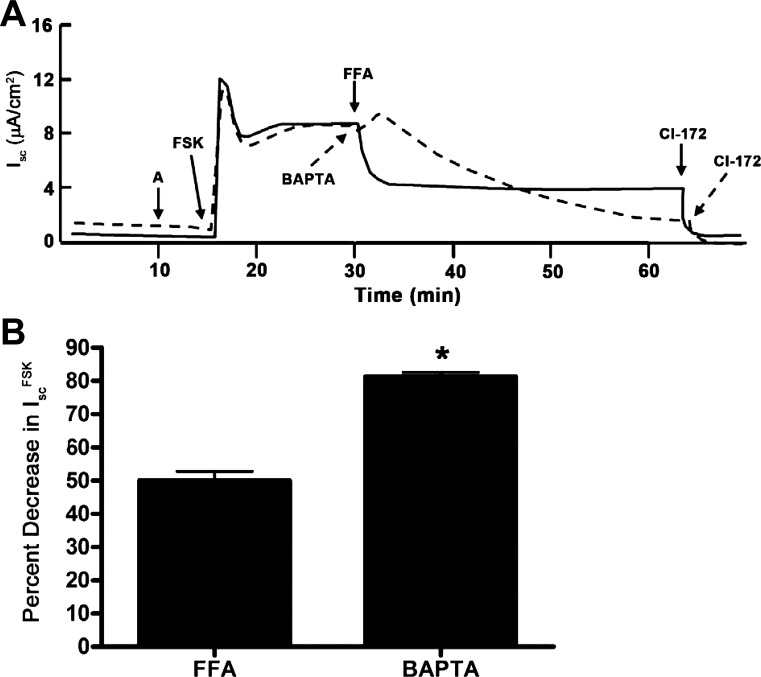
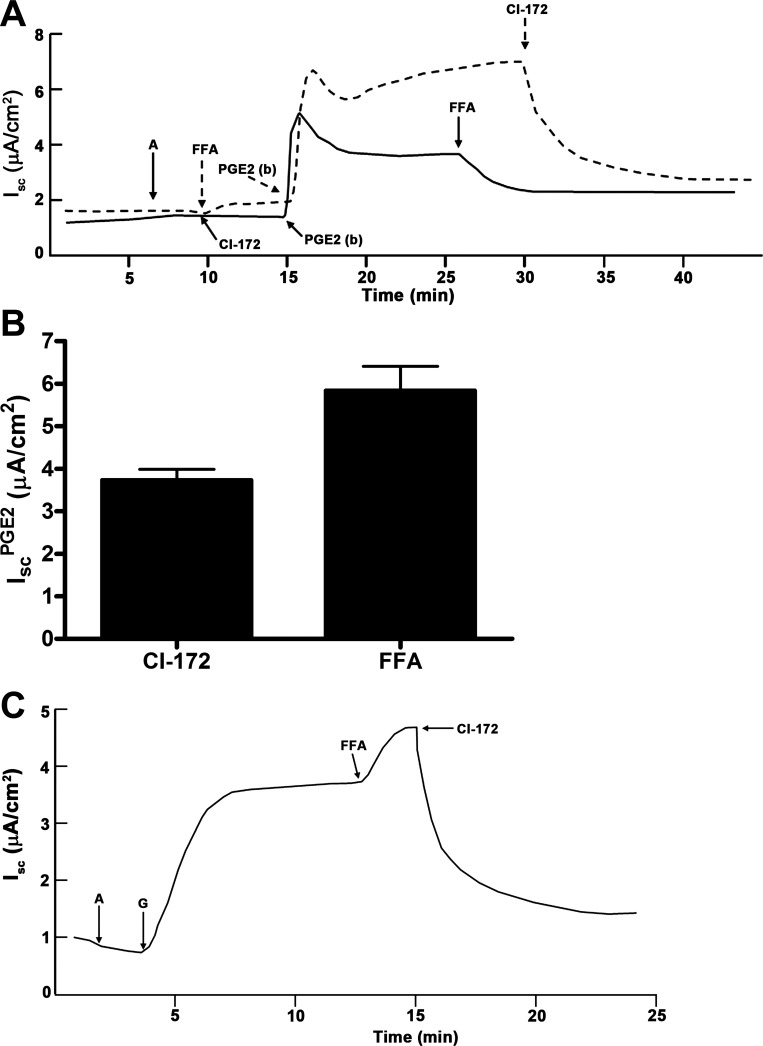
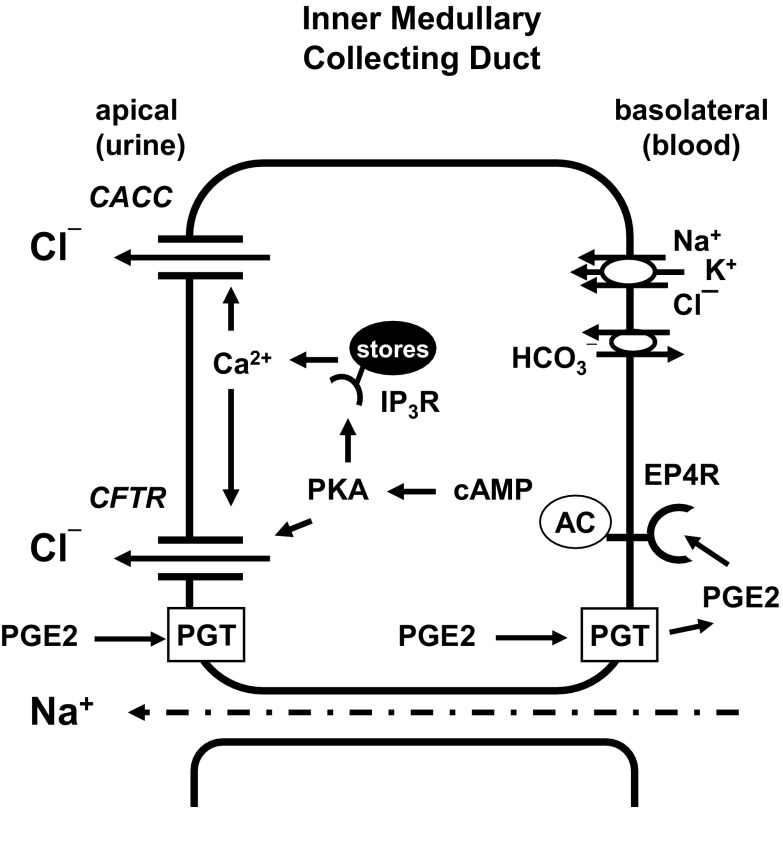
Under conditions of high dietary salt intake, prostaglandin E2 (PGE2) production is increased in the collecting duct and promotes urinary sodium chloride (NaCl) excretion; however, the molecular mechanisms by which PGE2 increases NaCl excretion in this context have not been clearly defined. We used the mouse inner medullary collecting duct (mIMCD)-K2 cell line to characterize mechanisms underlying PGE2-regulated NaCl transport. When epithelial Na(+) channels were inhibited, PGE2 exclusively stimulated basolateral EP4 receptors to increase short-circuit current (Isc(PGE2)). We found that Isc(PGE2) was sensitive to inhibition by H-89 and CFTR-172, indicating that EP4 receptors signal through protein kinase A to induce Cl(-) secretion via cystic fibrosis transmembrane conductance regulator (CFTR). Unexpectedly, we also found that Isc(PGE2) was sensitive to inhibition by BAPTA-AM (Ca(2+) chelator), 2-aminoethoxydiphenyl borate (2-APB) (inositol triphosphate receptor blocker), and flufenamic acid (FFA) [Ca(2+)-activated Cl(-) channel (CACC) inhibitor], suggesting that EP4 receptors also signal through Ca(2+) to induce Cl(-) secretion via CACC. Additionally, we observed that PGE2 stimulated an increase in Isc through crosstalk between cAMP and Ca(2+) signaling; BAPTA-AM or 2-APB inhibited a component of Isc(PGE2) that was sensitive to CFTR-172 inhibition; H-89 inhibited a component of Isc(PGE2) that was sensitive to FFA inhibition. Together, our findings indicate that PGE2 activates basolateral EP4 receptors and signals through both cAMP and Ca(2+) to stimulate Cl(-) secretion in IMCD-K2 cells. We propose that these signaling pathways, and the crosstalk between them, may provide a concerted mechanism for enhancing urinary NaCl excretion under conditions of high dietary NaCl intake.

Keywords: Ca2+-activated Cl- channel; EP4 receptor; collecting duct; cystic fibrosis transmembrane conductance regulator; prostaglandin E2.


Figures

Fig. 1.
Fig. 1.
Effects of extracellular prostaglandin E2 (PGE2) on short-circuit current (Isc) in mouse inner medullary collecting duct (mIMCD)-K2 cells. A: representative trace shows the effect of apical and basal addition of PGE2 on Isc. A indicates amiloride (10−5 M) added to the apical bath. PGE2 (7.7 × 10⁻⁸ M) was added to the apical (a) and basal (b) side. Additions of cystic fibrosis transmembrane conductance regulator (CFTR) inhibitor-172 (CI-172) (10−5 M) and of flufenamic acid (FFA) (2 × 10⁻⁴ M) to the apical side are shown. B: representative Isc trace indicates the cumulative dose response to basal addition of PGE2. Increasing concentrations of PGE2 were added to the basal side, as indicated. C: cumulative dose-response curve derived from average sustained Isc increases (IscPGE2) after basal PGE2 addition. Values are means ± SE (n = 12 filters).
Fig. 2.
Fig. 2.
Sidedness of PGE2-induced Isc in mIMCD-K2 cells. A: dashed trace demonstrates the Isc response to sequential addition of PGE2 to the basal (b) bath and then to the apical bath (a); solid trace demonstrates the Isc response to sequential addition of PGE2 to the apical bath and then to the basal bath. Additions of CI-172 (10−5 M) and FFA (2 × 10⁻⁴ M) to the apical side are shown. B: average transient (open bars) and sustained (solid bars) Isc responses to addition of PGE2 to the apical bath (IscPGE2). On the x-axis, “-” indicates absence of preexposure to PGE2; BLM indicates preexposure to basolateral PGE2. *Value significantly different from that induced by sequential addition of PGE2 in the reverse order. C: average transient (open bars) and sustained (solid bars) Isc responses to addition of PGE2 to the basal bath (IscPGE2). On the x-axis, AM indicates preexposure to apical PGE2. Values are represented as means ± SE (n = 16–18 filters). *Value significantly different from that induced by sequential addition of PGE2 in the reverse order. D: average conductance across mIMCD-K2 cell sheets after sequential addition of amiloride (Amil) and PGE2 to the apical and basal sides. Conductances in mS/cm2 were measured at the peak of transient (trans) and sustained (sust) Isc responses after addition of PGE2 (7.7 × 10⁻⁸ M). Values are means ± SE (n = 11). *Value significantly different from addition of PGE2 to the apical side. Conductance values were also significantly different between cells receiving amiloride vs. amiloride and apical PGE2. E: average conductance across mIMCD-K2 cell sheets after sequential addition of amiloride and PGE2 to the basal and apical sides. Conductances in mS/cm2 were measured at the peak of transient and sustained Isc responses after addition of PGE2 (7.7 × 10⁻⁸ M). Values are means ± SE (n = 11). Conductance after apical addition of PGE2 was not significantly different from that after basal addition (NS).
Fig. 3.
Fig. 3.
Effects of EP receptor agonists on Isc in mIMCD-K2 cells. A: representative Isc trace shows the effect of EP4 receptor agonist TCS2510 (10−6 M) (TCS) on Isc on the apical and basal sides. A indicates the addition of amiloride (10−5 M) B: average transient and sustained Isc responses to apical addition of EP receptor agonists sulprostrone (EP1R/EP3R), butaprost (EP2R), and TCS2510 (EP4R). C: average transient and sustained Isc responses to basal addition of EP receptor agonists. Values are represented as means ± SE (n = 6–12 filters). *Value significantly different from that induced by other EP receptor agonists.
Fig. 4.
Fig. 4.
Effects of pretreatment of mIMCD-K2 cells with EP receptor antagonists on PGE2-induced Isc in mIMCD-K2 cells. A: representative traces show the Isc response to addition of PGE2 following treatment with the EP4 receptor antagonist L-161,982 (L, 10−6 M) (dashed trace) or vehicle (solid trace). B: average transient and sustained Isc responses to addition of PGE2 (IscPGE2) to cells pretreated with vehicle (open bars) or L-161,982 (solid bars). Values are represented as means ± SE (n = 12 filters). *Value significantly different from that in cells pretreated with vehicle. C: representative traces show the Isc response to addition of PGE2 following treatment with L-161982 (10−7 M) for 10 min on the apical side (solid trace) or basal side (dashed trace).
Fig. 5.
Fig. 5.
Sidedness of EP4 receptor antagonism on PGE2-induced Isc in mIMCD-K2 cells. A: representative traces show inhibition of IscPGE2 when L-161,982 (2 × 10⁻⁸ M) is added to the apical side (dashed trace) or basal side (solid trace). B: average sustained Isc after sequential addition of basal PGE2, 1 and 10 min after addition of L-161,982 (2 × 10⁻⁸ M). L-161,982 was added to either the apical bath (open bars) or basal bath (solid bars). Values are represented as means ± SE (n = 6 filters). *Values significantly different from that in cells treated with apical L-161,982.
Fig. 6.
Fig. 6.
Effect of PGE2 transporter inhibitor bromocresol green (BCG) on PGE2-induced Isc in mIMCD-K2 cells. A: representative traces show the Isc response to addition of BCG (3 × 10⁻⁵ M) to both sides of mIMCD-K2 cell sheets (dashed line) or vehicle (solid line) on PGE2-induced Isc (IscPGE2). B: average transient and sustained Isc responses to addition of PGE2 to the apical bath of cells pretreated with vehicle (open bars) or BCG (solid bars). *Value significantly different from that in cells pretreated with vehicle. C: average transient and sustained Isc values in response to addition of PGE2 to the basal bath of cells pretreated with vehicle (open bars) or BCG (solid bars). Values are represented as means ± SE (n = 12 filters).
Fig. 7.
Fig. 7.
Expression of EP1, EP2, EP3, and EP4 receptor mRNA in mouse kidney lysates and mIMCD-K2 cells. Photograph of a gel showing PCR amplification products in mouse kidney tissue and mIMCD-K2 cells after reverse transcription of mouse EP1, EP2, EP3, and EP4 receptor mRNA. Samples containing reverse transcriptase (RT; +) or negative controls lacking reverse transcriptase (−) are included for each tissue/primer combination. M indicates DNA size marker.
Fig. 8.
Fig. 8.
Effect of substituting chloride and bicarbonate in the bath solution on PGE2-induced Isc in mIMCD-K2 cells. A: representative traces show the effect of PGE2 (7.7 × 10⁻⁸ M) on Isc in cells bathed in regular Krebs-Henseleit solution (KHS) (solid trace) or in KHS solution with chloride replaced with gluconate and bicarbonate replaced with HEPES (dashed trace). B: average sustained increase in Isc after basal PGE2 addition (IscPGE2) in cells bathed in regular or chloride/bicarbonate (Cl/HCO3)-free KHS. Values are represented as means ± SE. *Value significantly different from that in cells bathed in regular KHS.
Fig. 9.
Fig. 9.
Effects of CI-172 and FFA on PGE2-induced Isc in mIMCD-K2 cells. A: average Isc values in response to addition of PGE2 to the basal bath followed by sequential addition of CI-172 and FFA to the apical bath. Amiloride (10−5 M, Amil) was first added to the apical side followed by PGE2 (7.7 × 10⁻⁸ M) to the basal side. CI-172 (10−5 M) and FFA (2 × 10⁻⁴ M) were then added sequentially to the apical side. Values are means ± SE (n = 28 filters). *Value significantly different from IscPGE2. B: percentage of inhibition of PGE2-induced Isc (IscPGE2) after sequential addition of CI-172 and FFA to the apical side of mIMCD-K2 cells. Values are means ± SE (n = 28 filters). C: average conductance after sequential addition of amiloride, PGE2 to the basal side, and CI-172 and FFA. Values are means ± SE in mS/cm2. *Value significantly different from that found in cells treated with specified inhibitors. D: order of addition of CI-172 and FFA does not influence percent inhibition of IscPGE2. Open bars indicate percent inhibition of IscPGE2 after addition of specified inhibitor, whereas solid bars indicate percent inhibition of IscPGE2 after addition of specified inhibitor following pretreatment with the other inhibitor (FFA or CI-172) (n = 9).
Fig. 10.
Fig. 10.
Effect of bumetanide and diisothiocyanostilbene-2,2'-disulfonic acid (DIDS) on PGE2-induced Isc in mIMCD-K2 cells. A: representative trace shows the Isc response to the addition of bumetanide (Bumet, 2 × 10⁻⁴ M) and DIDS (10−4 M) to the basal side on PGE2-induced Isc (IscPGE2). B: average Isc responses to addition of PGE2 to the basal bath followed by sequential addition of bumetanide and DIDS. Amil represents baseline Isc after the addition of amiloride. Values are means ± SE (n = 7 filters). *Value significantly different from IscPGE2. C: percentage of inhibition of IscPGE2 after basal addition of bumetanide and DIDS to mIMCD-K2 cells. Values are means ± SE (n = 7 filters).
Fig. 11.
Fig. 11.
Effects of bumetanide and acetazolamide (Acet) on PGE2-induced Isc in mIMCD-K2 cells. A: representative trace shows the Isc response to the addition of bumetanide (2 × 10⁻⁴ M) and acetazolamide (2 × 10⁻⁴ M) to the basal side on PGE2-induced Isc (IscPGE2). B: average Isc responses to addition of PGE2 to the basal bath followed by sequential addition of bumetanide and acetazolamide. Values are means ± SE (n = 13 filters). *Value significantly different from IscPGE2. C: percentage of inhibition of IscPGE2 after basal addition of bumetanide and acetazolamide to mIMCD-K2 cells. Values are means ± SE (n = 13 filters).
Fig. 12.
Fig. 12.
Effect of PKA inhibitor H-89 on PGE2-induced Isc in mIMCD-K2 cells. A: representative traces show the Isc response to the addition H-89 (dashed line) (10−5 M) to both sides of the mIMCD-K2 cells or vehicle (solid line) on PGE2-induced Isc (IscPGE2). B: average transient and sustained Isc responses to basal addition of PGE2 to cells pretreated with vehicle (open bars) or H-89 (solid bars). Values are means ± SE (n = 13 filters). *Values significantly different from IscPGE2 in vehicle-treated cells. C: inhibition of PGE2-induced IscIscPGE2) after apical addition of CI-172 or FFA to cells pretreated with vehicle (open bars) or H-89 (solid bars). Values are means ± SE (n = 9 filters). *Values significantly different from ΔIscPGE2 in vehicle-treated cells.
Fig. 13.
Fig. 13.
Effects of inhibitors of phosphatidylinositol 3-kinase, phospholipase C, and protein kinase C on PGE2-induced Isc in mIMCD-K2 cells. A: representative traces show the Isc response to addition of the phosphatidylinositol 3-kinase inhibitor LY294002 (dashed line) (LY, 2.5 × 10⁻⁵ M) to both sides or vehicle (solid line) on PGE2-induced Isc in mIMCD-K2 cells. Representative of results obtained from 6 cell sheets. B: representative traces show the Isc response to addition of the phospholipase C inhibitor U73122 (dashed line) (10−6 M) to both sides or vehicle (solid line) on PGE2-induced Isc in mIMCD-K2 cells. Representative of results obtained from 6 cell sheets. C: representative trace shows the Isc response to addition of the PKC inhibitor Go6983 (2 × 10⁻⁵ M) to both sides on PGE2-induced Isc in mIMCD-K2 cells. Representative of results obtained from 6 cell sheets.
Fig. 14.
Fig. 14.
Effect of the Ca2+ chelator BAPTA-AM on PGE2-induced Isc in mIMCD-K2 cells. A: representative trace shows the Isc response to the addition of BAPTA-AM (5 × 10⁻⁵ M) to both sides on PGE2-induced Isc (IscPGE2). B: average Isc responses to sequential addition of amiloride, PGE2 (to the basal bath), and BAPTA-AM. Values are means ± SE (n = 12 filters). *Value significantly different from that in amiloride-treated cells; #value significantly different from IscPGE2 in control cells. C: inhibition of PGE2-induced IscIscPGE2) after apical addition of CI-172 and FFA to cells pretreated with vehicle (open bars) or BAPTA-AM (solid bars). Values are means ± SE (n = 6 filters). *Values significantly different from ΔIscPGE2 in vehicle-treated cells. D: percentage of inhibition of PGE2-induced Isc (IscPGE2) after apical addition of CI-172 and FFA to cells pretreated with vehicle or BAPTA-AM. Values are means ± SE (n = 6 filters). *Values significantly different from percent decrease in IscPGE2 in vehicle-treated cells.
Fig. 15.
Fig. 15.
Effect of the inositol triphosphate (IP3) receptor inhibitor 2-aminoethoxydiphenyl borate (2-APB) on PGE2-induced Isc in mIMCD-K2 cells. A: representative trace shows the Isc response to the addition of 2-APB (2 × 10⁻⁴ M) to both sides on PGE2-induced Isc (IscPGE2). B: average Isc responses to sequential addition of amiloride, PGE2 (to the basal bath), and 2-APB. Values are means ± SE (n = 11 filters). *Value significantly different from that in amiloride-treated cells; #value significantly different from IscPGE2 in control cells. C: inhibition of PGE2-induced IscIscPGE2) after apical addition of CI-172 and FFA to cells pretreated with vehicle (open bars) or 2-APB (solid bars). Values are means ± SE (n = 5–6 filters). *Values significantly different from ΔIscPGE2 in vehicle-treated cells. D: percentage of inhibition of PGE2-induced Isc (IscPGE2) after apical addition of CFTR inhibitor-172 or FFA to cells pretreated with vehicle or 2-APB. Values are means ± SE (n = 5–6 filters). *Values significantly different from percent decrease in IscPGE2 in vehicle-treated cells.
Fig. 16.
Fig. 16.
Effect of FFA and BAPTA-AM on forskolin (FSK)-stimulated Isc in mIMCD-K2 cells. A: solid trace indicates the Isc response to sequential addition of forskolin (10−5 M) to the apical side, FFA, and CI-172; dashed trace indicates the Isc response to sequential addition of forskolin, BAPTA-AM, and CI-172. B: percentage of inhibition of forskolin-induced Isc (IscFSK) after apical addition of FFA or BAPTA-AM. Values are means ± SE (n = 9–11 filters). *Value significantly different from that in FFA-treated cells.
Fig. 17.
Fig. 17.
CI-172- and FFA-sensitive Isc are distinct in mIMCD-K2 cells. A: representative traces show the Isc response to PGE2 when cells are pretreated with addition of CI-172 (solid trace) or FFA (dashed trace). B: average PGE2-induced Isc (IscPGE2) when cell sheets are pretreated with CI-172 or FFA. Values are means ± SE (n = 8 filters). C: representative trace shows the effect of FFA and CI-172 on Isc induced by addition of the tyrosine kinase inhibitor genistein (G, 3 × 10⁻⁵ M) to both sides. Representative of results obtained from 12 cell sheets.
Fig. 18.
Fig. 18.
Model for PGE2 action in mIMCD-K2 cells. PGE2 in the apical side of cells can be transported to the basal side through the prostaglandin transporter (PGT). Once PGE2 reaches the basolateral membrane, it can bind to EP4 receptors in an autocrine or paracrine fashion. Binding of EP4 receptor induces activation of adenylate cyclase (AC) to increase cAMP production and stimulate protein kinase A (PKA) activity. PKA can directly stimulate CFTR; additionally PKA may phosphorylate IP3 receptors, which may sensitize them to basal levels of IP3. This could augment IP3 receptor response and enhance release Ca2+ from intracellular stores. An increase in intracellular Ca2+ activates Ca2+-activated Cl channel (CACC) and perhaps CFTR activity.

Similar articles

Cited by

References

    1. Andersson C, Servetnyk Z, Roomans GM. Activation of CFTR by genistein in human airway epithelial cell lines. Biochem Biophys Res Commun 308: 518–522, 2003 - PubMed
    1. Banu SK, Arosh JA, Chapdelaine P, Fortier MA. Molecular cloning and spatio-temporal expression of the prostaglandin transporter: a basis for the action of prostaglandins in the bovine reproductive system. Proc Natl Acad Sci USA 100: 11747–11752, 2003 - PMC - PubMed
    1. Bao Y, Pucci ML, Chan BS, Lu R, Ito S, Schuster VL. Prostaglandin transporter PGT is expressed in cell types that synthesize and release prostanoids. Am J Physiol Renal Physiol 282: F1103–F1110, 2002 - PubMed
    1. Billet A, Hanrahan JW. The secret life of CFTR as a calcium-activated chloride channel. J Physiol 591: 5273–5278, 2013 - PMC - PubMed
    1. Bito LZ. Inhibition of renal prostaglandin metabolism and excretion by probenecid, bromcresol green and indomethacin. Prostaglandins 12: 639–646, 1976 - PubMed

Publication types

MeSH terms

Substances

LinkOut - more resources