. 2014 Feb;25(3):397-411.
doi: 10.1091/mbc.E13-07-0366. Epub 2013 Nov 27.

Prostaglandins temporally regulate cytoplasmic actin bundle formation during Drosophila oogenesis

Affiliations

Prostaglandins temporally regulate cytoplasmic actin bundle formation during Drosophila oogenesis

Andrew J Spracklen et al. Mol Biol Cell. 2014 Feb.

Abstract

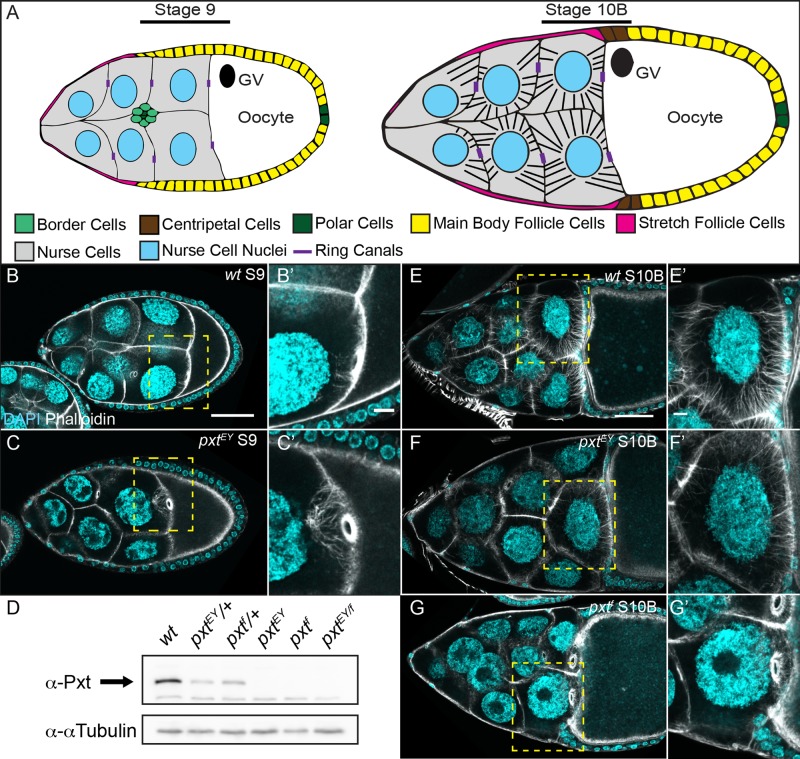
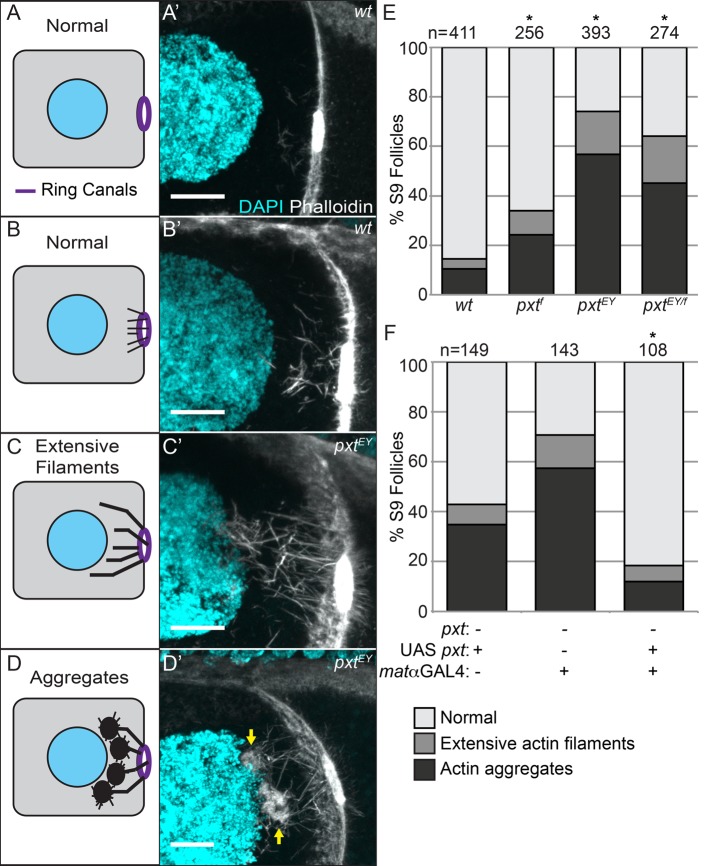
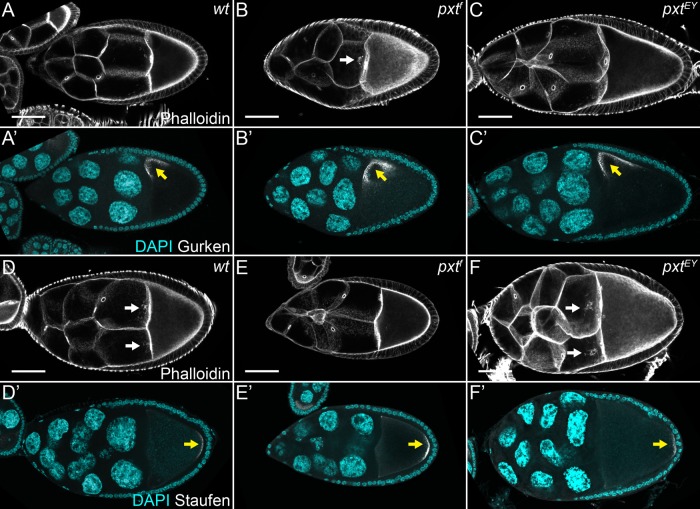
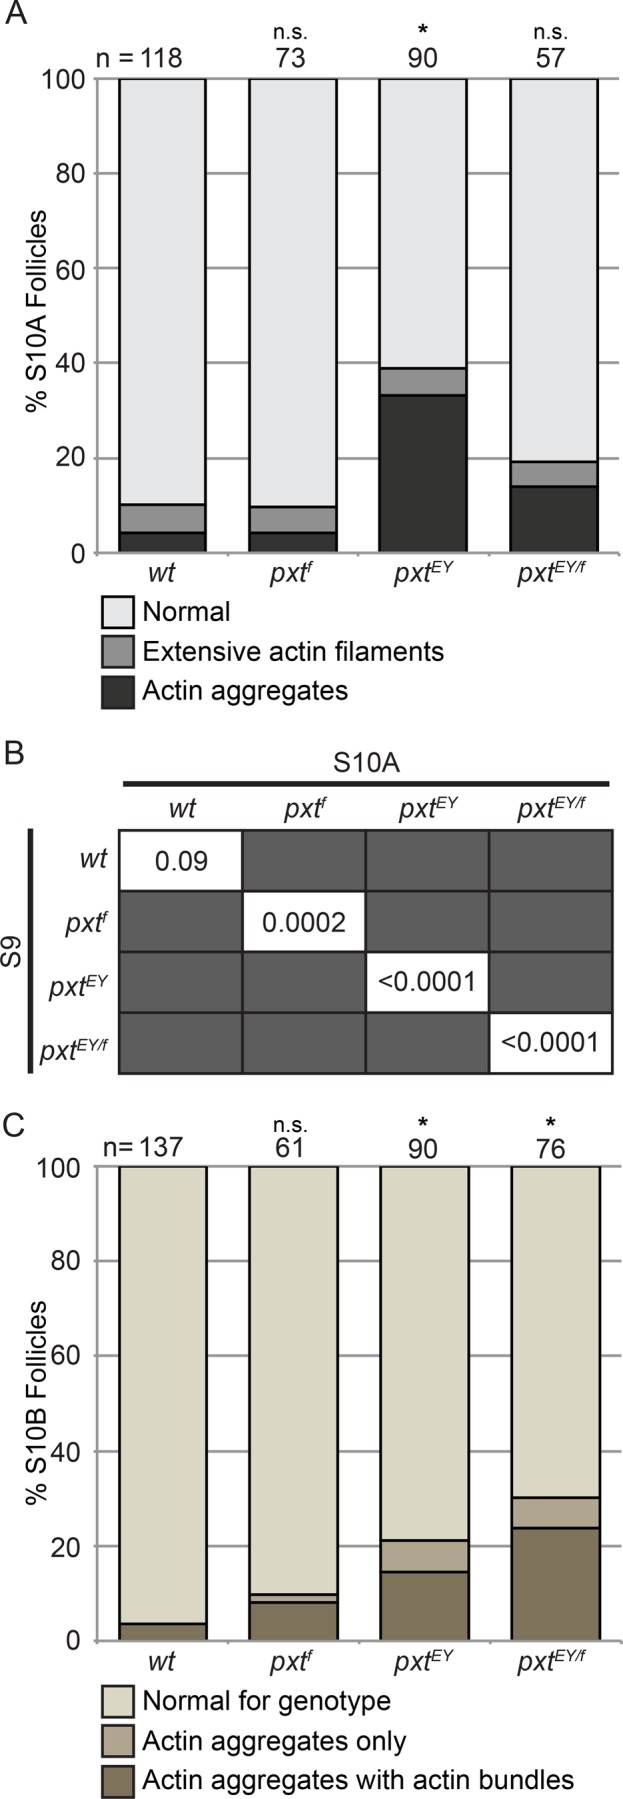
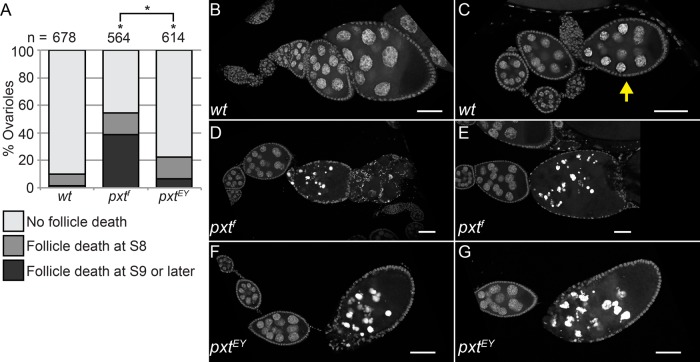
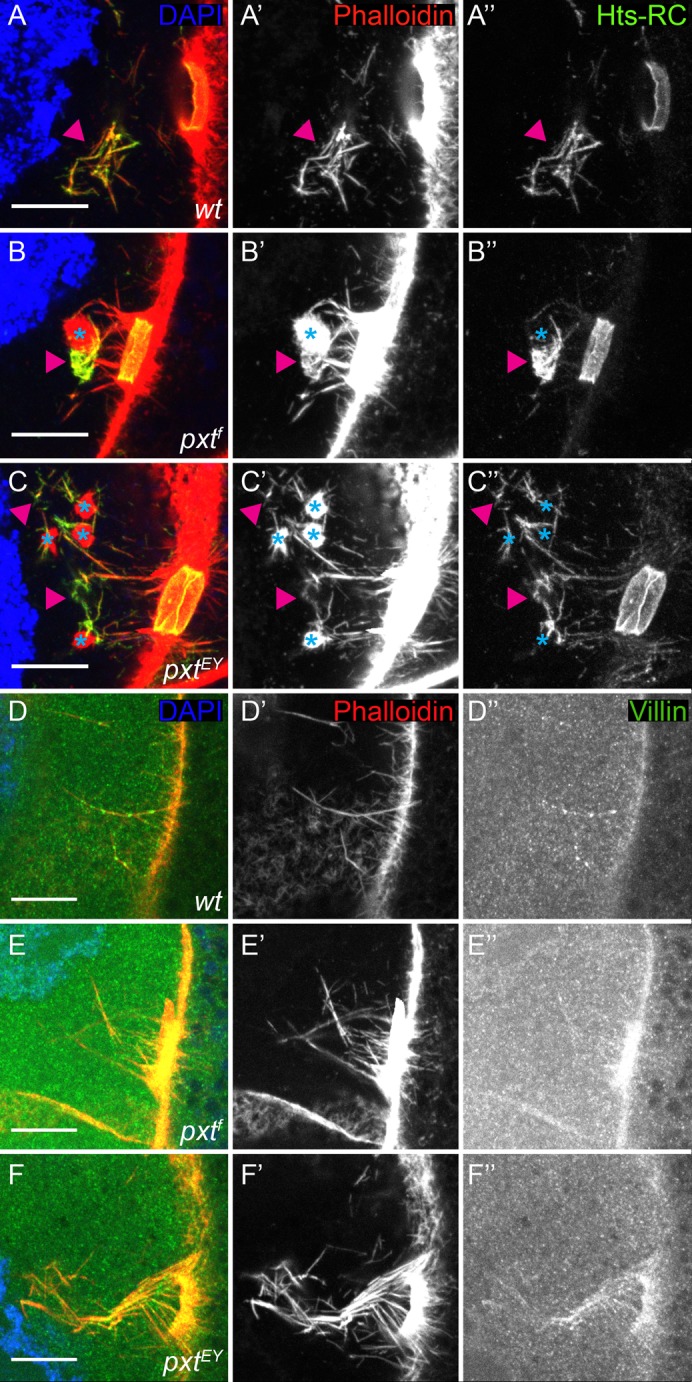
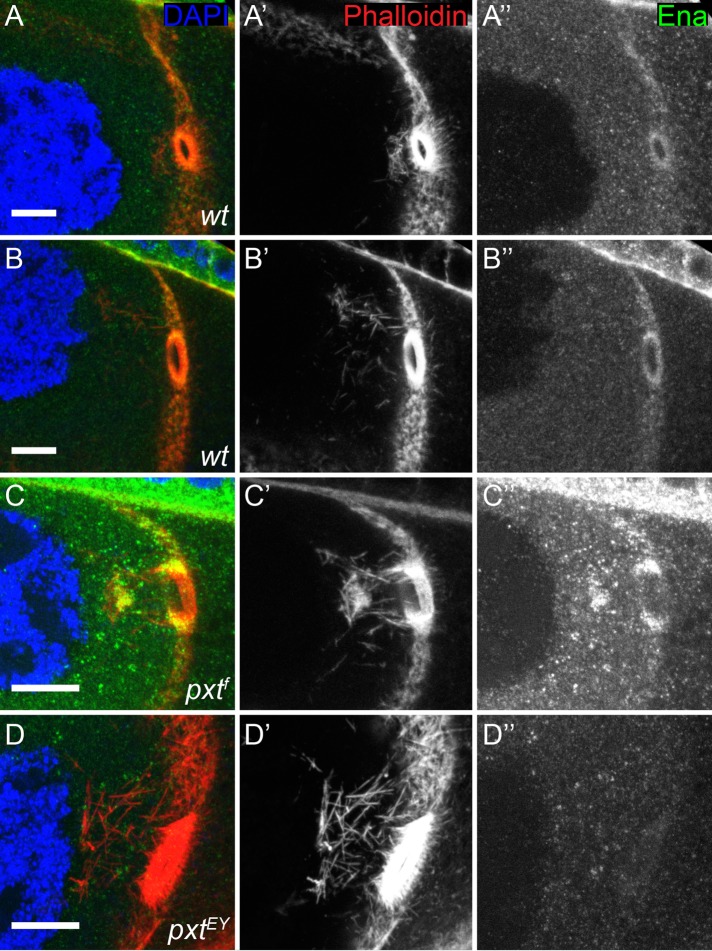
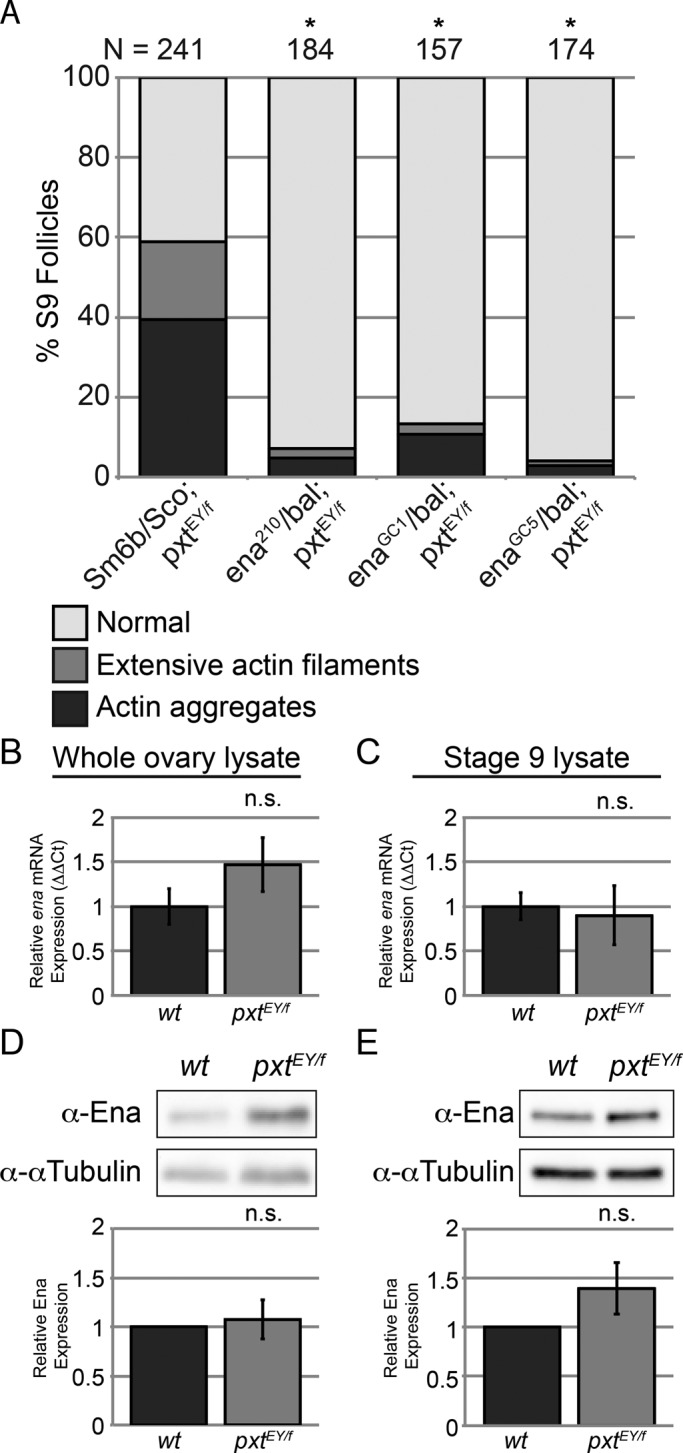
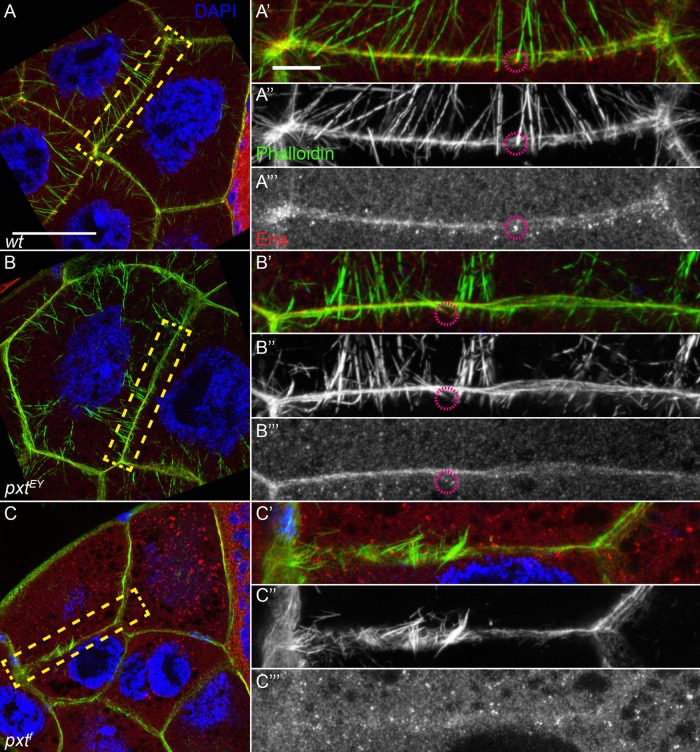
Prostaglandins (PGs)--lipid signals produced downstream of cyclooxygenase (COX) enzymes--regulate actin dynamics in cell culture and platelets, but their roles during development are largely unknown. Here we define a new role for Pxt, the Drosophila COX-like enzyme, in regulating the actin cytoskeleton--temporal restriction of actin remodeling during oogenesis. PGs are required for actin filament bundle formation during stage 10B (S10B). In addition, loss of Pxt results in extensive early actin remodeling, including actin filaments and aggregates, within the posterior nurse cells of S9 follicles; wild-type follicles exhibit similar structures at a low frequency. Hu li tai shao (Hts-RC) and Villin (Quail), an actin bundler, localize to all early actin structures, whereas Enabled (Ena), an actin elongation factor, preferentially localizes to those in pxt mutants. Reduced Ena levels strongly suppress early actin remodeling in pxt mutants. Furthermore, loss of Pxt results in reduced Ena localization to the sites of bundle formation during S10B. Together these data lead to a model in which PGs temporally regulate actin remodeling during Drosophila oogenesis by controlling Ena localization/activity, such that in S9, PG signaling inhibits, whereas at S10B, it promotes Ena-dependent actin remodeling.


Figures

FIGURE 1:
FIGURE 1:
Pxt temporally regulates actin remodeling during mid-oogenesis. (A) Schematic detailing the cellular composition of S9 and S10B follicles; GV, germinal vesicle. (B–C′, E–G′) Maximum projections of confocal slices of follicles, staged as indicated, taken at 20× magnification. Anterior is to the left. F-actin (phalloidin), white; DNA (DAPI), cyan. (B–B′, E–E′) Wild type, wt (yw). (C–C′, F–F′) pxtEY. (G–G′) pxtf. (D) Representative Western blot for Pxt levels. S9 and S10B follicles consist of 16 germline-derived cells (one oocyte [white] and 15 nurse cells [gray]) surrounded by a somatic epithelium (A). In wild-type S9 follicles, the nurse cell cytoplasm is largely devoid of actin filament structures (B–B′). During S10B, wild-type follicles undergo actin remodeling to generate a network of parallel actin filament bundles extending from the nurse cell membranes toward the nuclei (E–E′). pxt mutants exhibit early actin remodeling, resulting in the formation of extensive early actin filaments and actin aggregates at S9 (C–C′ vs. B–B′). In addition, pxt mutants exhibit a range of actin-remodeling defects at S10B, ranging from mild defects in the number and distribution of actin filament bundles (F–F′) to near-complete loss of actin filament bundles (G–G′). Both pxtEY and pxtf homozygotes, as well as their heteroallelic combination, exhibit a substantial loss of Pxt protein (D). Images are representative and taken from multiple experiments. Scale bars, 50 μm (B–G), 10 μm (B′–G′).
FIGURE 2:
FIGURE 2:
Early actin remodeling is highly penetrant in pxt mutants. (A–D) Schematics of a posterior nurse cell exhibiting normal or aberrant actin structures associated with the posterior ring canals during S9. (C′–D′) Maximum projections of confocal slices of posterior nurse cells of S9 follicles taken at 63× magnification. Anterior is to the left and posterior (i.e., the oocyte) is to the right. F-actin (phalloidin), white; DNA (DAPI), cyan. (A′, B′) Wild type, wt (yw). (C′, D′) pxtEY. Images are representative and taken from multiple experiments. (E–F) Charts quantifying the percentage of S9 follicles exhibiting normal, extensive actin filament, and actin aggregate phenotypes for the indicated genotypes; the numbers of follicles scored are indicated above each bar (n). The posterior ring canals of wild-type follicles are either devoid of actin filaments (A–A′) or exhibit minimal actin filament structures extending toward the nurse cell nucleus (B–B′). In contrast, pxt-mutant S9 follicles exhibit much more extensive actin filaments (C–C′) and actin aggregate structures (D–D′, yellow arrows) emanating from the posterior ring canals. Quantification of these early actin structures reveals that they are highly penetrant in both pxt alleles and the heteroallelic combination. Whereas only 14% of wild-type S9 follicles exhibit early actin structures, this remodeling is dramatically increased in pxt mutants, with 34% of pxtf S9, 74% of pxtEY, and 64% of pxtEY/f follicles exhibiting early actin structures (E; p < 0.001 for pxtf, pxtEY, and pxtEY/f compared with wild type). Germline expression of pxt using the GAL4/UAS system rescues the early actin remodeling (F; p < 0.001 for UAS pxt/matαGAL4; pxtEY/f compared with UAS pxt; pxtEY/f or matαGAL4; pxtEY/f). Scale bars, 10 μm. *p < 0.001 using global chi-squared tests.
FIGURE 3:
FIGURE 3:
Oocyte polarity is normal in pxt mutants. (A–F′) Maximum projections of confocal slices of S9 follicles taken at 20× magnification; anterior is to the left. (A–F) F-actin (phalloidin), white. (A′–C′) Merged images: DNA (DAPI), cyan; Gurken, white. (D′–F′) Merged images: DNA (DAPI), cyan; Staufen, white. (A–A′, D–D′) Wild type, wt (yw). (B–B′, E–E′) pxtf. (C–C′, F–F′) pxtEY. In wild-type S9 follicles (A), Gurken localizes to the dorsal-anterior corner of the oocyte (A′, yellow arrow). In pxtf (B) and pxtEY (C) mutants, the localization of Gurken is not disrupted (B′–C′, yellow arrows), even when actin aggregates are present (B, white arrow). In wild-type S9 follicles (D), Staufen localizes to the posterior of the oocyte (D′, yellow arrow), including in follicles with early actin structures (D, white arrows). In pxtf (E) and pxtEY (F) mutants, Staufen localization to the posterior of the oocyte is unchanged (E′–F′, yellow arrows), even when actin aggregates are present (F, white arrows). Scale bars, 50 μm.
FIGURE 4:
FIGURE 4:
The prevalence of aberrant, early actin structures in pxt mutants decreases in later stages of development. (A) Chart quantifying the percentage of S10A follicles exhibiting normal, extensive actin filament, and actin aggregate phenotypes for the indicated genotypes; the numbers of follicles scored are indicated above each bar (n). (B) Table of p values from global chi-squared tests comparing the prevalence of the early actin structures at S9 and S10A for a given genotype. (C) Chart quantifying the percentage of S10B exhibiting normal actin remodeling for the indicated genotype (see Materials and Methods for more details), only actin aggregates, and actin aggregates with bundle formation. The prevalences of the early actin structures in pxtf and pxtEY/f at S10A are not statistically different from those for wild-type follicles, whereas the level of early structures for pxtEY at S10A is significantly higher than that in wild-type follicles (A). Of note, the prevalence of these structures in all pxt mutants is reduced in S10A compared with S9 (B). During S10B, wild-type follicles undergo dynamic actin remodeling, including the generation of parallel actin bundles; this remodeling is aberrant in pxt mutants. Actin aggregates alone or with bundles are observed at a significantly higher level in pxtEY and pxtEY/f than in wild-type S10B follicles (C). *p < 0.05 using global chi-squared tests.
FIGURE 5:
FIGURE 5:
Follicle death is increased in pxt mutants. (A) Chart quantifying the percentage of wild-type and pxt mutant ovarioles containing a dying follicle either at the S8 checkpoint or at S9 or later in development; the numbers of ovarioles scored are indicated above each bar (n). Follicle death was assessed by DNA condensation and fragmentation. (B–G) Maximum projections of confocal slices of S9 follicles taken at 20× magnification; DNA (DAPI), white. (B, C) Wild type, wt (yw). (D, E) pxtf. (F, G) pxtEY. The vast majority (89%) of wild-type ovarioles showed no signs of follicle death (A), as evident by DNA morphology (B), whereas 9% exhibited follicle death at the S8 checkpoint, as evident by DNA condensation (C, yellow arrow) or fragmentation (not shown). Infrequently (2%), wild-type ovarioles exhibit abnormal follicle death (follicle death occurring ≥S9) (A). In contrast, pxtf ovarioles show a mild increase in follicle death at S8 (16%; A, D) and a dramatic increase in abnormal follicle death (38%; A, E; p < 0.001 for pxtf compared with wild type), whereas pxtEY ovarioles show a mild increase in follicle death at the S8 checkpoint (16%; A, F) and abnormal death (6%; A, G) compared with wild type (p < 0.001 pxtEY compared with wild type). Of note, the level of follicle death in pxtf-mutant ovarioles is significantly higher than that in pxtEY (p < 0.001). Scale bars, 50 μm. *p < 0.001 using global chi-squared tests.
FIGURE 6:
FIGURE 6:
Hts-RC and Villin both localize to early actin structures in wild-type and pxt mutant S9 follicles. (A–F′′) Maximum projections of confocal slices of the posterior nurse cells of S9 follicles taken at 63× magnification. Anterior is to the left and posterior (i.e., the oocyte) to the right. (A–C) Merged images: DNA (DAPI), blue; F-actin (phalloidin), red; Hts-RC, green. (A′–C′) F-actin (phalloidin), white. (A′′–C′′) Hts-RC, white. (D–F) Merged images: DNA (DAPI), blue; F-actin (phalloidin), red; Villin, green. (D′–F′) F-actin (phalloidin), white. (D′′–F′′) Villin, white. (A–A′′, D–D′′) Wild type, wt (yw). (B–B′′, E–E′′) pxtf. (C–C′′, F–F′′) pxtEY. Hts-RC localizes to early actin structures in both wild-type (A–A′′) and pxt-mutant (B–C′′) S9 follicles, where it colocalizes with actin filament structures (magenta arrowheads, A–C′′), but not actin aggregates (cyan asterisks, B–C′′). Villin localizes as discrete puncta along the early actin filaments in both wild-type (D–D′′) and pxt-mutant (E–F′′) S9 follicles. Scale bars, 10 μm.
FIGURE 7:
FIGURE 7:
Ena preferentially localizes to early actin structures in pxt-mutant follicles. (A–D′′) Maximum projections of confocal slices of S9 follicles taken at 63× magnification. Anterior is to the left and posterior (i.e., the oocyte) to the right. (A–D) Merged images: DNA (DAPI), blue; F-actin (phalloidin), red; Ena, green. (A′–D′) F-actin (phalloidin), white. (A′′–D′′) Ena, white. (A–B′′) Wild type, wt (yw). (C–C′′) pxtf. (D–D′′) pxtEY. Although the majority of wild-type S9 follicles fail to exhibit Ena puncta localizing to the early actin structures (A–A′′; 10/12 images blindly scored), weak Ena localization occasionally is observed (B–B′′; 2/12 images). Conversely, Ena generally localizes to both the extensive filaments as puncta (D–D′′) and aggregates (C–C′′) observed in pxt mutants (5/11 pxtf, 7/10 pxtEY, and 4/6 pxtEY/f images). Images are representative and taken from multiple experiments. Scale bars, 10 μm.
FIGURE 8:
FIGURE 8:
A reduction in Ena suppresses early actin remodeling in pxt mutants. (A) Chart quantifying the percentage of S9 follicles exhibiting normal, extensive actin filament, and actin aggregate phenotypes for the indicated genotypes; the numbers of follicles scored are indicated above each bar (n). (B, C) Charts quantifying the normalized levels of ena mRNA for whole ovary and S9, respectively. (D, E) Representative Western blots for Ena levels and charts quantifying the normalized levels of Ena in whole ovaries and S9, respectively, for the indicated genotypes. Loss of Pxt (pxtEY/f) results in early actin remodeling; heterozygosity for mutations in ena (ena210, enaGC1, and enaGC5) block this early actin remodeling (A). Ena mRNA (B, C) and protein (D, E) levels are unchanged in pxt-mutant ovaries and S9 follicles. In A, *p < 0.001 using global chi-squared tests. In B–E, n.s. = p > 0.05 using a two-sample t test, unequal variance.
FIGURE 9:
FIGURE 9:
Ena localization to the barbed ends of actin filament bundles is disrupted in pxt mutants during S10B. (A–C) Maximum projections of confocal slices of S10B follicles taken at 63×magnification. Anterior is to the left and posterior (i.e., the oocyte) to the right. (A′–C′′′) Magnified insets of region indicated by yellow box in A–C. (A–C′) Merged images: DNA (DAPI); F-actin (phalloidin), green; Ena, red. (A′′–C′′) F-actin (phalloidin), white. (A′′′–C′′′) Ena, white. (A′–A′′′) Wild type, wt (yw). (B–B′′′) pxtEY. (C–C′′′) pxtf. In wild-type follicles, Ena localizes to the barbed, or growing, ends of actin filament bundles as distinct puncta (A; dashed magenta circles, A′–A′′′) and to the nurse cell membranes. This localization is diminished in pxt mutants (B; magenta circles, B′–B′′′; and C′–C′′′ compared with A′–A′′′). The extent of this reduction is dependent on the severity of actin-remodeling defects in pxt mutants (C–C′′′ compared with B–B′′′). Scale bars, 50 μm (A–C) or 10 μm (A′–C′′′).

Similar articles

Cited by

References

    1. Abramoff MD, Magalhaes PJ, Ram SJ. Image processing with ImageJ. Biophoton Int. 2004;11:36–42.
    1. Allaj V, Guo C, Nie D. Non-steroid anti-inflammatory drugs, prostaglandins, and cancer. Cell Biosci. 2013;3:8. - PMC - PubMed
    1. Aszodi A, Pfeifer A, Ahmad M, Glauner M, Zhou XH, Ny L, Andersson KE, Kehrel B, Offermanns S, Fassler R. The vasodilator-stimulated phosphoprotein (VASP) is involved in cGMP- and cAMP-mediated inhibition of agonist-induced platelet aggregation, but is dispensable for smooth muscle function. EMBO J. 1999;18:37–48. - PMC - PubMed
    1. Banan A, Smith GS, Kokoska ER, Miller TA. Role of actin cytoskeleton in prostaglandin-induced protection against ethanol in an intestinal epithelial cell line. J Surg Res. 2000;88:104–113. - PubMed
    1. Baum B, Li W, Perrimon N. A cyclase-associated protein regulates actin and cell polarity during Drosophila oogenesis and in yeast. Curr Biol. 2000;10:964–973. - PubMed

Publication types