. 2014 Feb;306(3):H438-49.
doi: 10.1152/ajpheart.00628.2013. Epub 2013 Nov 27.

Cardiovascular effect of angiotensin-(1-12) in the caudal ventrolateral medullary depressor area of the rat

Affiliations

Cardiovascular effect of angiotensin-(1-12) in the caudal ventrolateral medullary depressor area of the rat

Tetsuya Kawabe et al. Am J Physiol Heart Circ Physiol. 2014 Feb.

Abstract

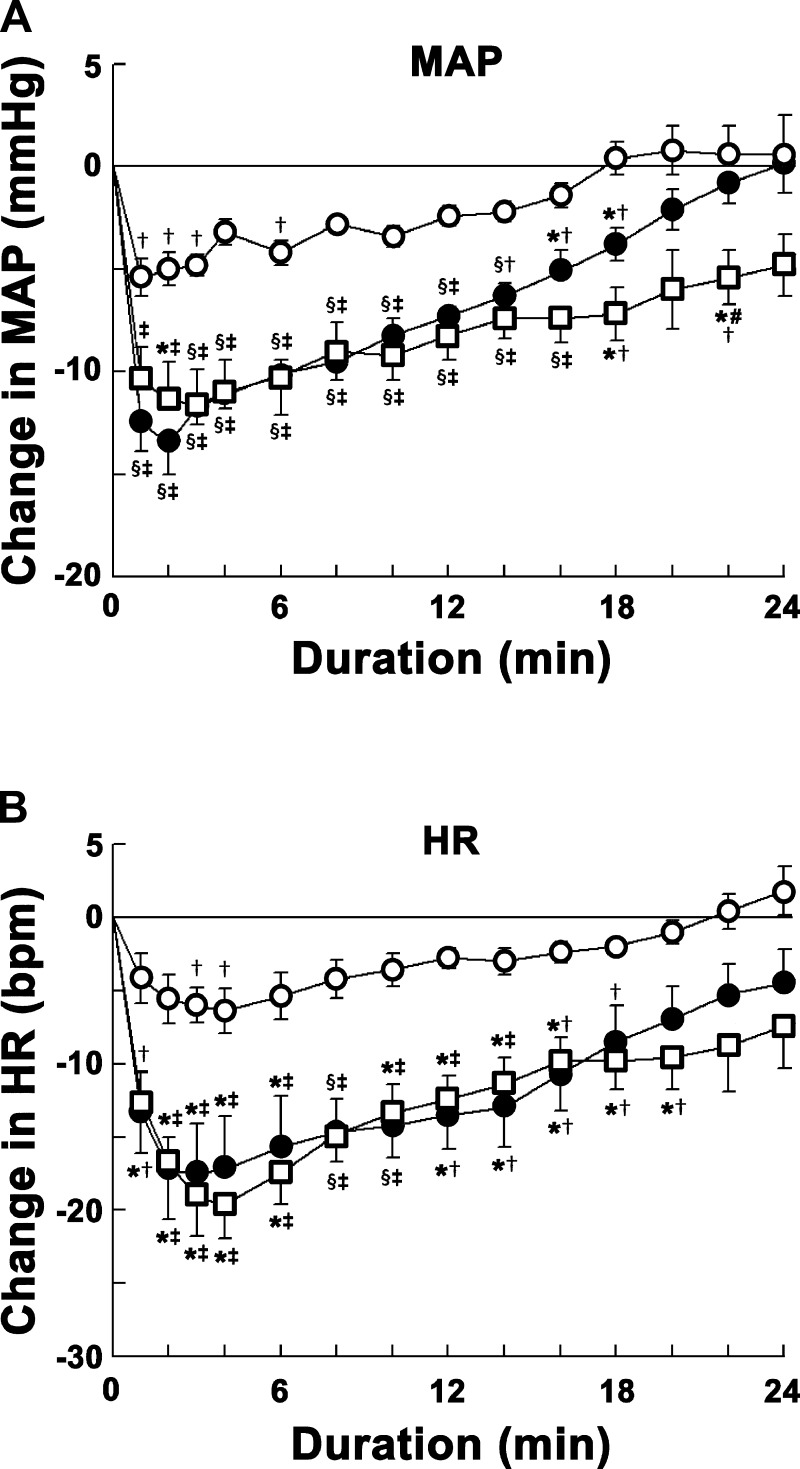
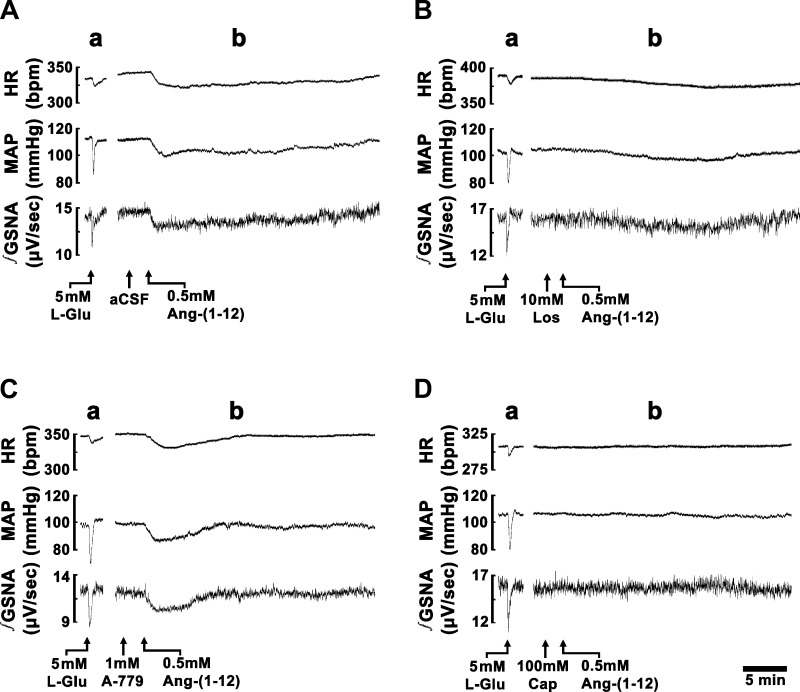
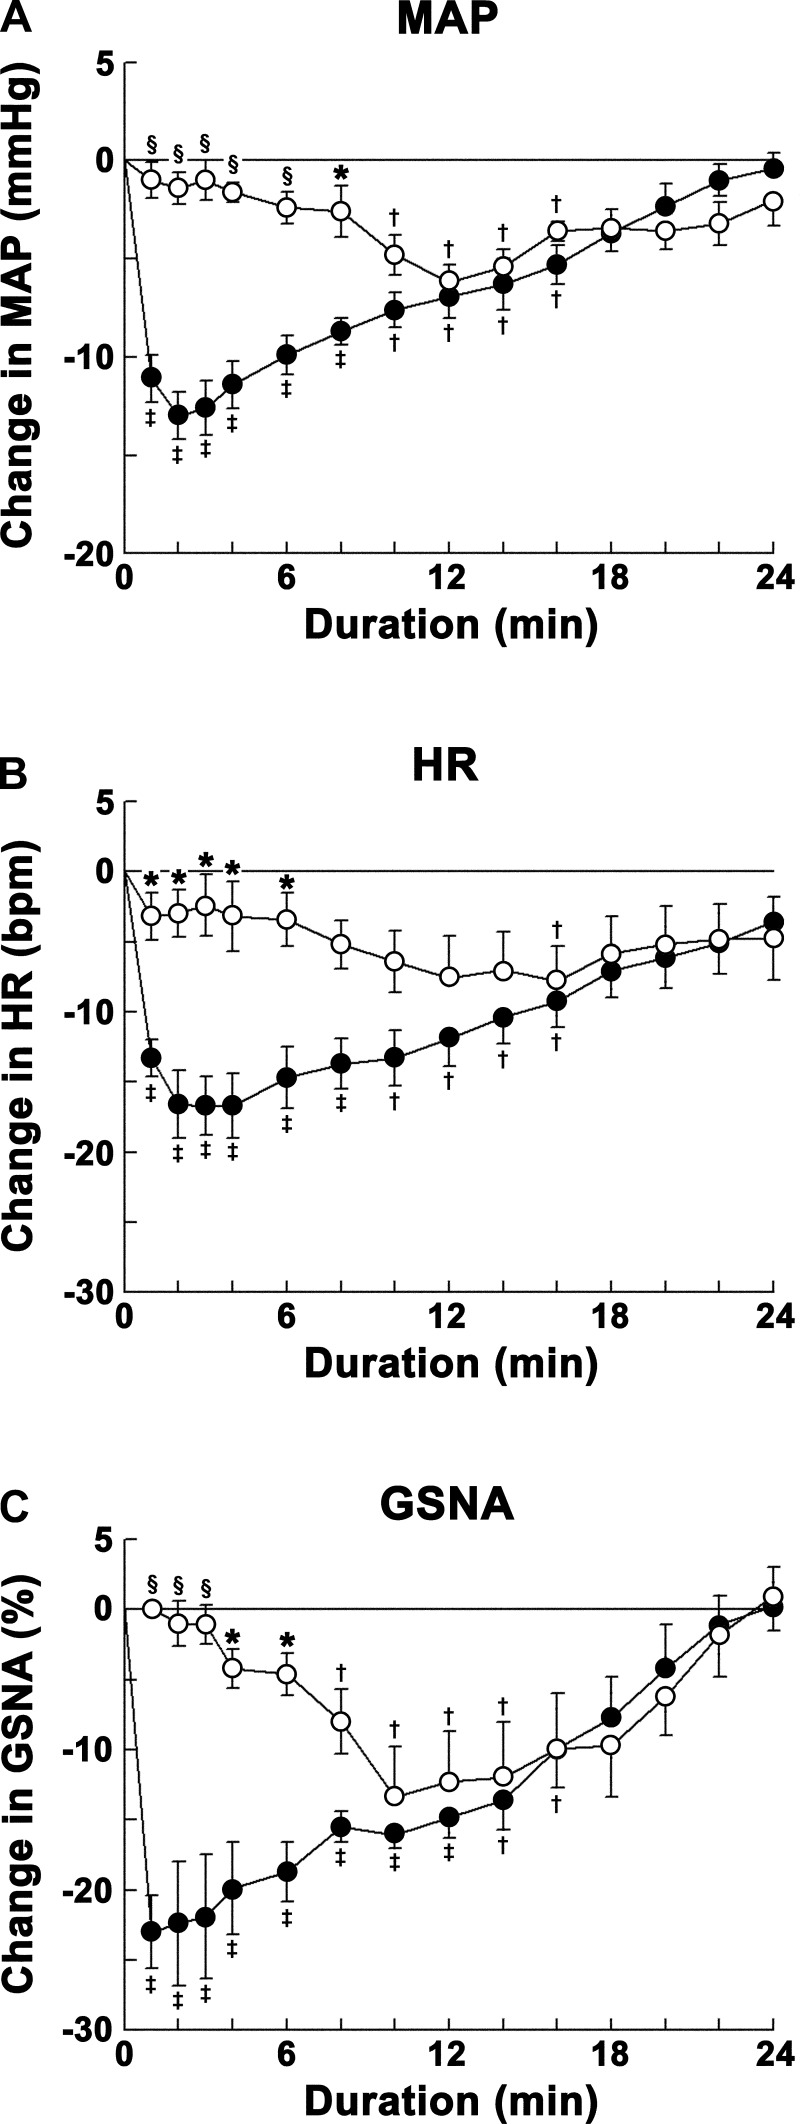
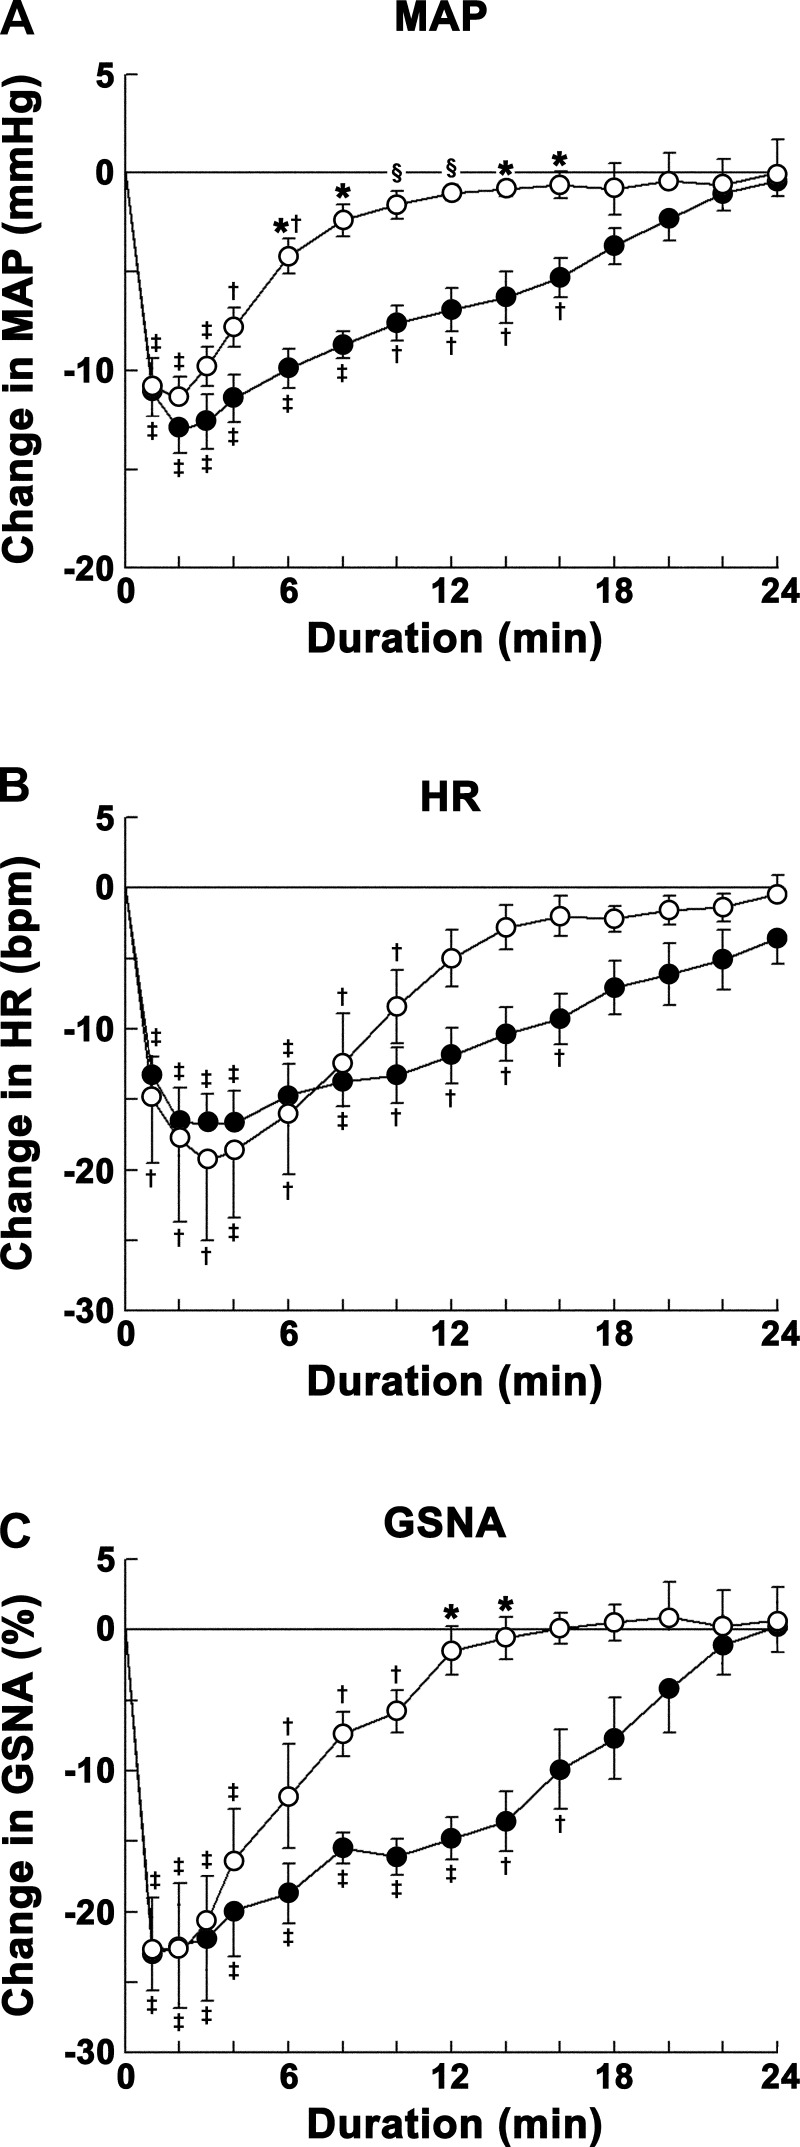
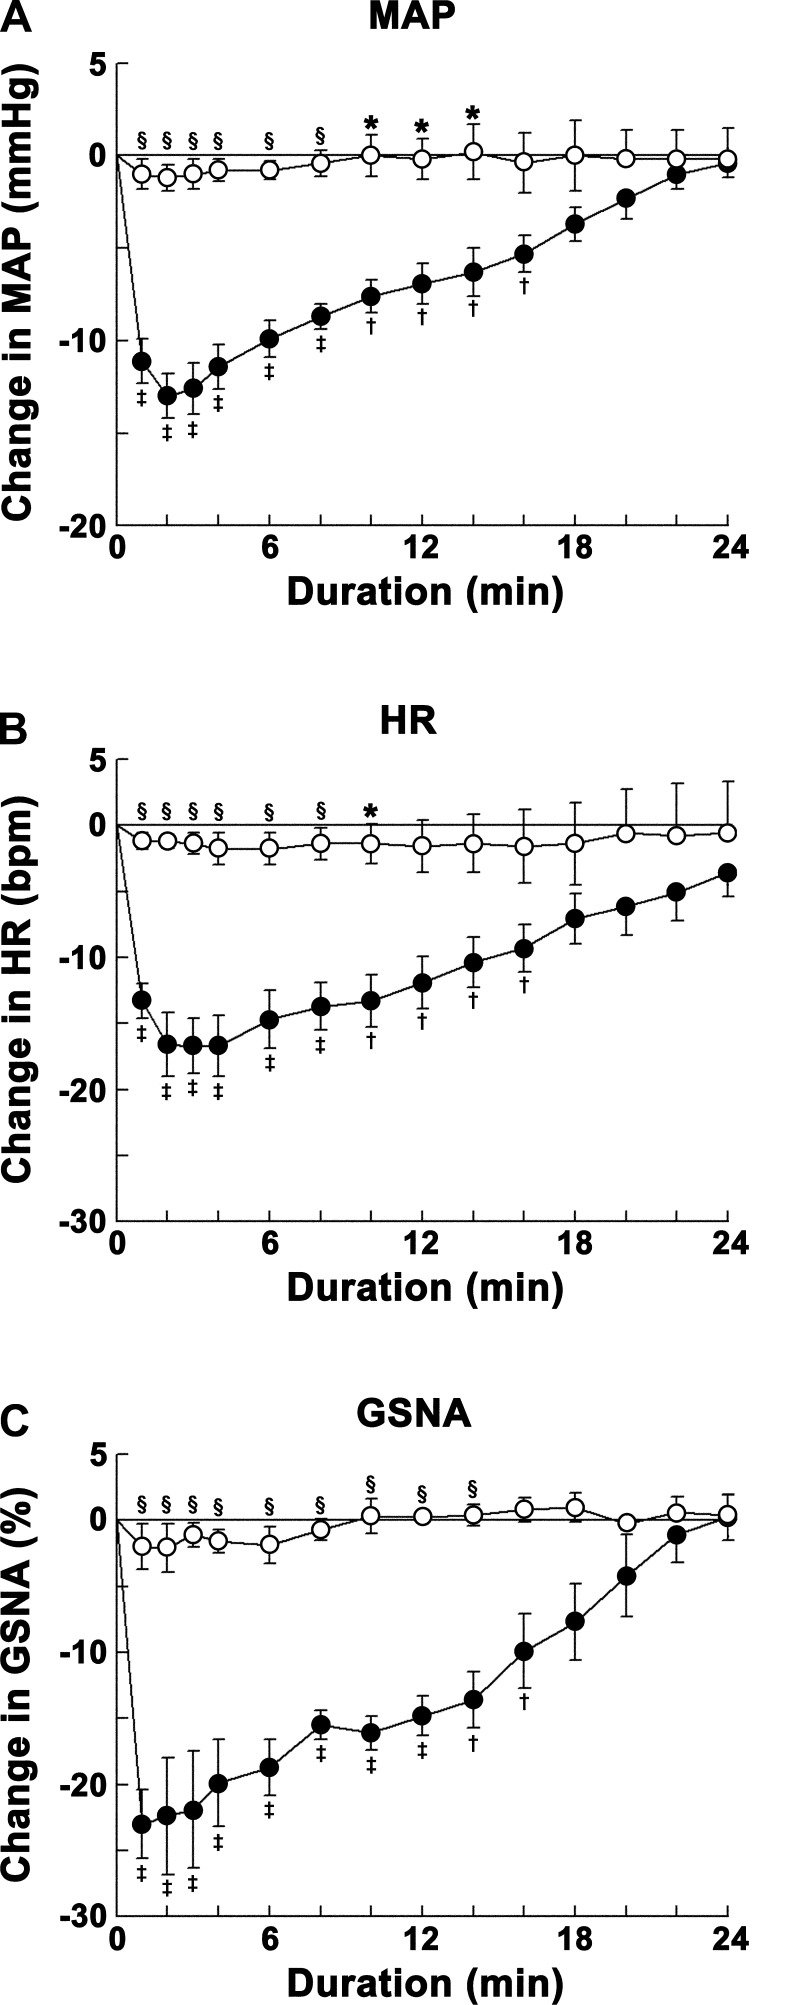
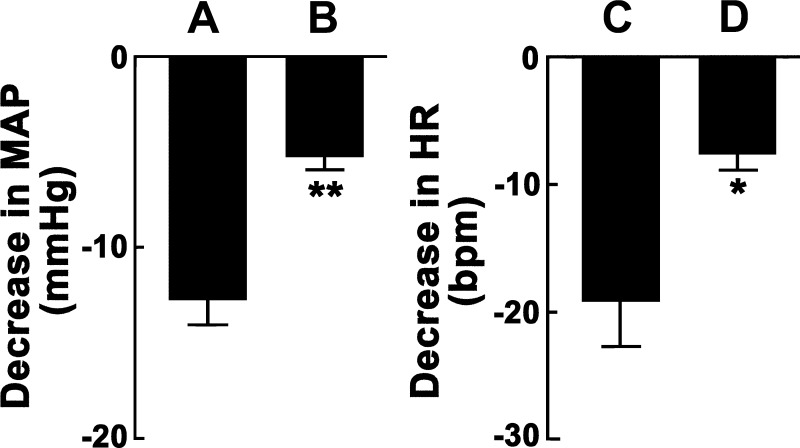
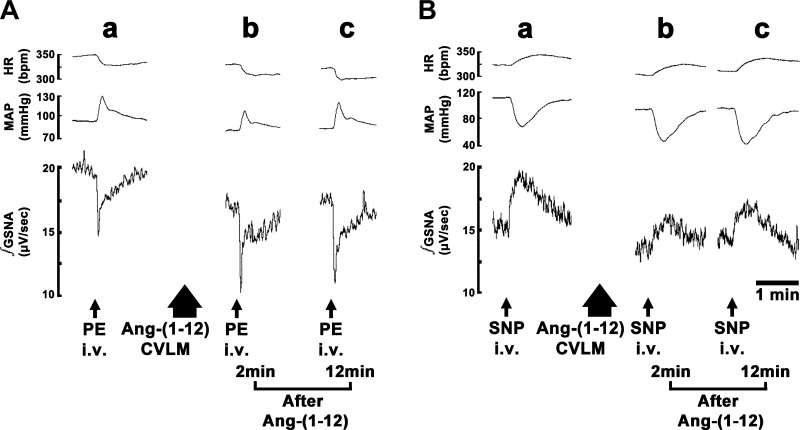
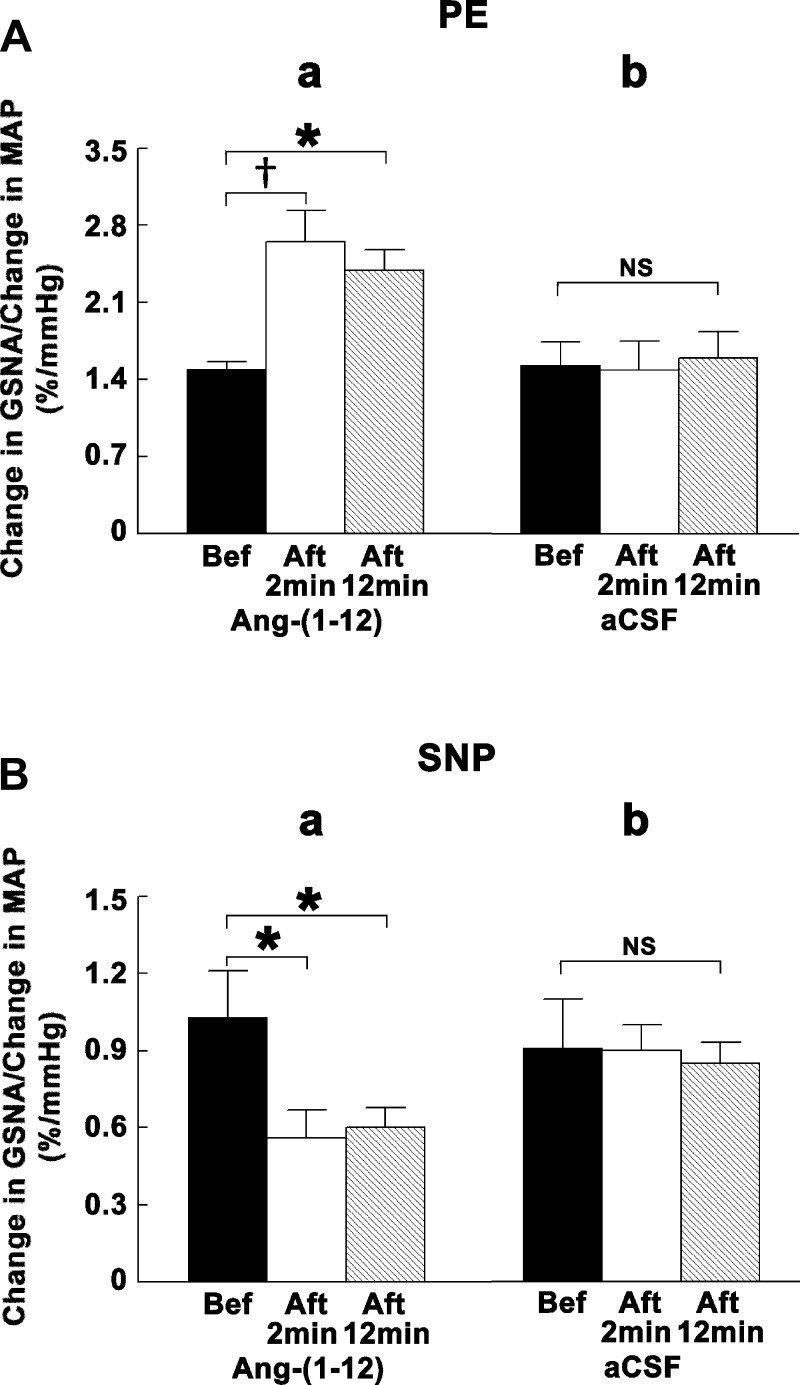
Angiotensin (ANG)-(1-12) excites neurons via ANG II type 1 receptors (AT1Rs), which are present in the caudal ventrolateral medullary depressor area (CVLM). We hypothesized that microinjections of ANG-(1-12) into the CVLM may elicit decreases in mean arterial pressure (MAP), heart rate (HR), and sympathetic nerve activity. This hypothesis was tested in urethane-anesthetized adult male Wistar rats. Microinjections of ANG-(1-12) into the CVLM elicited decreases in MAP, HR, and greater splanchnic nerve activity (GSNA). ANG-(1-12)-induced responses consisted of initial (first 1-8 min) and delayed (8-24 min) phases. Prior microinjections of losartan, A-779, and captopril into the CVLM blocked initial, delayed, and both phases of ANG-(1-12) responses, respectively. Blockade of GABA receptors in the rostral ventrolateral medullary pressor area (RVLM) attenuated cardiovascular responses elicited by microinjections of ANG-(1-12) into the ipsilateral CVLM. Microinjections of ANG-(1-12) into the CVLM potentiated the reflex decreases and attenuated the reflex increases in GSNA elicited by intravenous injections of phenylephrine and sodium nitroprusside, respectively. These results indicate that microinjections of ANG-(1-12) into the CVLM elicit decreases in MAP, HR, and GSNA. Initial and delayed phases of these responses are mediated via ANG II and ANG-(1-7), respectively; the effects of ANG II and ANG-(1-7) are mediated via AT1Rs and Mas receptors, respectively. Captopril blocked both phases of ANG-(1-12) responses, indicating that angiotensin-converting enzyme is important in mediating these responses. GABA receptors in the RVLM partly mediate the cardiovascular responses to microinjections of ANG-(1-12) into the CVLM. Microinjections of ANG-(1-12) into the CVLM modulate baroreflex responses.

Keywords: GABAergic neurons; Mas receptors; angiotensin II receptors; baroreflex; sympathetic nerve activity.


Figures

Fig. 1.
Fig. 1.
Concentration-response of angiotensin (ANG)-(1–12) into the caudal ventrolateral medullary depressor area (CVLM). Open circles show responses to microinjections of 0.25 mM ANG-(1–12) (n = 5); solid circles show responses to microinjections of 0.5 mM ANG-(1–12) (n = 6); open squares show responses to microinjections of 1 mM ANG-(1–12) (n = 5). A: decreases in mean arterial pressure (MAP) elicited by microinjections of ANG-(1–12). Each concentration of ANG-(1–12) elicited maximal decreases in MAP within 1–3 min. Comparison of depressor responses at one of these time points (e.g., 2 min) showed that the responses elicited by 0.5 and 1 mM concentrations (13.5 ± 1.5 and 11.4 ± 1.9 mmHg, respectively) were not significantly different (P > 0.05) but that responses were significantly (P < 0.01–0.05) greater than the responses elicited by the 0.25 mM concentration (5.0 ± 0.8 mmHg) at this time point. The depressor responses elicited by the 1 mM concentration lasted longer (>24 min) than those elicited by 0.25 and 0.5 mM concentrations (within 24 min). B: decreases in HR [in beats/min (bpm)] elicited by microinjections of ANG-(1–12) into the CVLM. Each concentration elicited maximal decreases in HR within 3–4 min. Comparison of bradycardic responses at one of these time points (e.g., 3 min) showed that the responses elicited by 0.5 and 1.0 mM concentrations (17.5 ± 3.4 and 19.2 ± 2.6 beats/min, respectively) were not significantly (P > 0.05) different but that responses were significantly (P < 0.05) greater than those elicited by the 0.25 mM concentration (6.0 ± 1.2 beats/min) at this time point. In this and other figures, the volume of all microinjections was 100 nl; all values are expressed as means ± SE. *P < 0.05 compared with the 0.25 mM concentration (all comparisons refer to corresponding time points); §P < 0.01 compared with the 0.25 mM concentration; #P < 0.05 compared with the 0.5 mM concentration; †P < 0.05 and ‡P < 0.01 compared with baseline (0-min time point).
Fig. 2.
Fig. 2.
Traces showing the effect of microinjections of ANG-(1–12) into the CVLM. In each A–D, the top trace shows HR (in beats/min), the middle trace shows MAP (in mmHg), and the bottom trace shows integrated greater splanchnic nerve activity (∫GSNA; in μV/s). Tracings in A–D are from different rats. The CVLM was first identified by microinjections of l-glutamate (l-Glu; 5 mM); decreases in HR, MAP, and GSNA were observed (A–D,a). Tracings of the responses to microinjections of ANG-(1–12) (0.5 mM) are shown in A–D,b. A: responses of ANG-(1–12) after microinjection of artificial cerebrospinal fluid (aCSF) at the same site. B: responses of ANG-(1–12) after microinjection of losartan (Los; 10 mM) at the same site. C: responses of ANG-(1–12) after microinjection of A-779 (1 mM, Mas receptor antagonist) at the same site. D: responses of ANG-(1–12) after microinjection of captopril (Cap; 100 mM) at the same site.
Fig. 3.
Fig. 3.
Group data showing the effects of ANG type 1 receptor blockade on ANG-(1–12)-induced responses. Decreases in MAP (A), HR (B), and GSNA (C) were elicited by microinjections of ANG-(1–12) (0.5 mM) into the CVLM. Open circles show responses to microinjections of ANG-(1–12) into the CVLM after microinjections of Los (10 mM) into the same site (n = 5); solid circles show responses to microinjections of ANG-(1–12) into the CVLM after microinjections of aCSF into the same site (n = 7). The initial phase (∼1–8 min) of ANG-(1–12) responses was abolished by microinjection of Los. Comparison of responses at one of these time points (e.g., 2 min) showed that the decreases in MAP (1.4 ± 0.8 mmHg), HR (3.0 ± 1.7 beats/min), and GSNA (1.0 ± 1.6%) elicited by microinjections of ANG-(1–12) after microinjections of Los were significantly smaller (P < 0.01–0.05) than the decreases in MAP (13.0 ± 1.2 mmHg), HR (16.7 ± 2.1 beats/min), and GSNA (22.4 ± 4.4%) elicited by microinjections of ANG-(1–12) after microinjections of aCSF. *P < 0.05 compared with responses elicited by microinjections of ANG-(1–12) after microinjections of aCSF (all comparisons refer to corresponding time points); §P < 0.01 compared with responses elicited by microinjections of ANG-(1–12) after microinjections of aCSF; †P < 0.05 and ‡P < 0.01 compared with baseline (0-min time point).
Fig. 4.
Fig. 4.
Group data showing the effects of Mas receptor blockade on ANG-(1–12)-induced responses. Decreases in MAP (A), HR (B), and GSNA (C) were elicited by microinjections of ANG-(1–12) (0.5 mM) into the CVLM. Open circles show responses to microinjections of ANG-(1–12) into the CVLM after microinjections of A-779 (1 mM) into the same site (n = 5); solid circles show responses to microinjections of ANG-(1–12) into the CVLM after microinjections of aCSF into the same site (n = 7). The delayed phase (∼8–24 min) of ANG-(1–12) responses was abolished by microinjection of A-779. Comparison of responses at one of these time points (e.g., 12 min) showed that the decreases in MAP (1.0 ± 0.4 mmHg) and GSNA (1.5 ± 1.7%) elicited by microinjections of ANG-(1–12) after microinjections of A-779 were significantly smaller (P < 0.01–0.05) than the decreases in MAP (6.9 ± 1.1 mmHg) and GSNA (14.8 ± 1.5%) elicited by microinjections of ANG-(1–12) after microinjections of aCSF. However, HR responses to ANG-(1–12) were not significantly different between the groups in which aCSF and A-779 were used. *P < 0.05 compared with responses elicited by microinjections of ANG-(1–12) after microinjections of aCSF (all comparisons refer to corresponding time points); §P < 0.01 compared with responses elicited by microinjections of ANG-(1–12) after microinjections of aCSF; †P < 0.05 and ‡P < 0.01 compared with baseline (0-min time point).
Fig. 5.
Fig. 5.
Group data showing the effects of angiotensin-converting enzyme (ACE) inhibition on ANG-(1–12)-induced responses. Decreases in MAP (A), HR (B), and GSNA (C) were elicited by microinjections of ANG-(1–12) (0.5 mM) into the CVLM. Open circles show responses to microinjections of ANG-(1–12) into the CVLM after microinjections of Cap (100 mM) into the same site (n = 5); solid circles show responses to microinjections of ANG-(1–12) into the CVLM after microinjections of aCSF into the same site (n = 7). Both initial (∼1–8 min) and delayed (∼8–24 min) phases of ANG-(1–12) responses were blocked by microinjection of Cap. Comparison of responses at one of these time points in the initial phase (e.g., 2 min) showed that the decreases in MAP (1.2 ± 0.7 mmHg), HR (1.2 ± 0.5 beats/min), and GSNA (2.1 ± 1.8%) elicited by microinjections of ANG-(1–12) after microinjections of Cap were significantly smaller (P < 0.01) than the decreases in MAP (13.0 ± 1.2 mmHg), HR (16.7 ± 2.1 beats/min), and GSNA (22.4 ± 4.4%) elicited by microinjections of ANG-(1–12) after microinjections of aCSF. Comparison of responses at one of these time points in the delayed phase (e.g., 10 min) showed that the changes in MAP (0.0 ± 1.1 mmHg), HR (−1.4 ± 1.5 beats/min), and GSNA (+0.3 ± 1.3%) elicited by microinjections of ANG-(1–12) after microinjections of Cap were significantly smaller (P < 0.01–0.05) than the decreases in MAP (7.6 ± 0.9 mmHg), HR (13.3 ± 2.0 beats/min), and GSNA (16.1 ± 2.0%) elicited by microinjections of ANG-(1–12) after microinjections of aCSF. *P < 0.05 compared with responses elicited by microinjections of ANG-(1–12) after microinjections of aCSF (all comparisons refer to corresponding time points); §P < 0.01 compared with responses elicited by microinjections of ANG-(1–12) after microinjections of aCSF; †P < 0.05 and ‡P < 0.01 compared with baseline (0-min time point).
Fig. 6.
Fig. 6.
Effect of GABA receptor blockade in the rostral ventrolateral medullary pressor area (RVLM) on ANG-(1–12)-induced cardiovascular responses elicited from the CVLM. A: microinjections of ANG-(1–12) (0.5 mM) into the CVLM, after microinjections of aCSF into the ipsilateral RVLM as a control, elicited decreases in MAP (12.8 ± 1.2 mmHg, n = 5). B: decreases in MAP (5.2 ± 0.7 mmHg) elicited by microinjections of ANG-(1–12) (0.5 mM) into the CVLM were significantly (**P < 0.01) attenuated by prior combined microinjections of gabazine (2 mM) and CGP-52432 (10 mM) into the ipsilateral RVLM (n = 5). C: microinjections of ANG-(1–12) (0.5 mM) into the CVLM, after microinjections of aCSF into the ipsilateral RVLM, elicited decreases in HR (19.2 ± 3.4 beats/min; the same group of rats as in A). D: decreases in HR (7.6 ± 1.3 beats/min) elicited by microinjections of ANG-(1–12) into the CVLM were significantly (*P < 0.05) attenuated by prior combined microinjections of gabazine and CGP-52432 into the ipsilateral RVLM (the same group of rats as in B).
Fig. 7.
Fig. 7.
Tracings showing the effects of microinjections of ANG-(1–12) into the CVLM on the baroreflex. In A and B, the top trace shows HR (in beats/min), the middle trace shows MAP (in mmHg), and the bottom trace shows ∫GSNA (in μV/s). A: baroreceptor stimulation by phenylephrine (PE). A bolus injection of PE (7.5 μg/kg iv) elicited an increase in MAP and reflex decreases in HR and GSNA (a). The decrease in GSNA induced by PE injection was potentiated 2 min (b) and 12 min (c) after bilateral microinjections of ANG-(1–12) into the CVLM. B: baroreceptor unloading by sodium nitroprusside (SNP). A bolus injection of SNP (7.5 μg/kg iv) elicited a decrease in MAP and reflex increases in HR and GSNA (b). The increase in GSNA induced by SNP injection was attenuated 2 min (b) and 12 min (c) after bilateral microinjections of ANG-(1–12) into the CVLM.
Fig. 8.
Fig. 8.
Group data showing the effects of microinjections of ANG-(1–12) into the CVLM on the baroreflex. In A and B, the solid bars show reflex GSNA responses to PE or SNP before bilateral microinjections of either ANG-(1–12) (a) or aCSF (b) into the CVLM, open bars show reflex GSNA responses to PE or SNP 2 min after microinjections of either ANG-(1–12) (a) or aCSF (b) into the CVLM, and hatched bars show reflex GSNA responses to PE or SNP 12 min after microinjections of either ANG-(1–12) (a) or aCSF (b) into the CVLM. A: baroreceptor stimulation by PE (7.5 μg/kg iv). a: Bilateral microinjections of ANG-(1–12) (0.5 mM) into the CVLM significantly potentiated reflex GSNA responses (n = 5). The ratios of changes in GSNA to changes in MAP elicited by PE injections before, 2 min after, and 12 min after microinjections of ANG-(1–12) into the CVLM were 1.50 ± 0.06, 2.65 ± 0.28, and 2.39 ± 0.18%/mmHg, respectively. b: Bilateral microinjections of aCSF (100 nl) into the CVLM did not alter reflex GSNA responses (n = 4). The same ratios elicited by PE injections before, 2 min after, and 12 min after microinjections of aCSF into the CVLM were 1.53 ± 0.21, 1.49 ± 0.26, and 1.60 ± 0.24%/mmHg, respectively. B: baroreceptor unloading by SNP (7.5 μg/kg iv). a: Bilateral microinjections of ANG-(1–12) into the CVLM significantly attenuated reflex GSNA responses (n = 5). The same ratios elicited by SNP injections before, 2 min after, and 12 min after microinjections of ANG-(1–12) into the CVLM were 1.03 ± 0.18, 0.56 ± 0.11, and 0.60 ± 0.08%/mmHg, respectively. b: Bilateral microinjections of aCSF into the CVLM did not alter reflex GSNA responses (n = 4). The same ratios elicited by SNP injections before, 2 min after, and 12 min after microinjections of aCSF into the CVLM were 0.91 ± 0.19, 0.90 ± 0.10, and 0.85 ± 0.08%/mmHg, respectively. *P < 0.05; †P < 0.01.
Fig. 9.
Fig. 9.
Histological identification of microinjection sites in the CVLM. A: a typical microinjection site (arrow) in the CVLM marked with green retrobeads IX (100 nl). The site was located at a level 1.20 mm rostral to the calamus scriptorius. Scale bar = 1 mm. B–H: composite diagrams of CVLM sections at levels 1.32–0.64 mm rostral to the CS. In the diagrams showing microinjection sites, the solid circle represents the center of one microinjection site in one animal. However, some of the microinjection sites overlapped. nAmb, nucleus ambiguus; RVRG, rostral ventral respiratory group.
Fig. 10.
Fig. 10.
Histological identification of microinjection sites in the RVLM. A–D: composite diagrams of RVLM sections at levels 2.40–2.04 mm rostral to the calamus scriptorius. Bo, Botzinger complex.

Similar articles

Cited by

References

    1. Allen AM, Mendelsohn FAO, Gieroba ZJ, Blessing WW. Vasopressin release following microinjection of angiotensin II into the caudal ventrolateral medulla oblongata in the anaesthetized rabbit. J Neuroendocrinol 2: 867–873, 1990 - PubMed
    1. Alzamora AC, Santos RA, Campagnole-Santos MJ. Hypotensive effect of ANG II and ANG-(1–7) at the caudal ventrolateral medulla involves different mechanisms. Am J Physiol Regul Integr Comp Physiol 283: R1187–R1195, 2002 - PubMed
    1. Alzamora AC, Santos RA, Campagnole-Santos MJ. Baroreflex modulation by angiotensins at the rat rostral and caudal ventrolateral medulla. Am J Physiol Regul Integr Comp Physiol 290: R1027–R1034, 2006 - PubMed
    1. Arakawa H, Chitravanshi VC, Sapru HN. The hypothalamic arcuate nucleus: a new site of cardiovascular action of angiotensin-(1–12) and angiotensin II. Am J Physiol Heart Circ Physiol 300: H951–H960, 2011 - PMC - PubMed
    1. Arakawa H, Kawabe K, Sapru HN. Angiotensin-(1–12) in the rostral ventrolateral medullary pressor area of the rat elicits sympathoexcitatory responses. Exp Physiol 98: 94–108, 2013 - PMC - PubMed

Publication types

MeSH terms

LinkOut - more resources