. 2014 May;8(5):953-62.
doi: 10.1038/ismej.2013.211. Epub 2013 Nov 28.

Fitness and stability of obligate cross-feeding interactions that emerge upon gene loss in bacteria

Affiliations

Fitness and stability of obligate cross-feeding interactions that emerge upon gene loss in bacteria

Samay Pande et al. ISME J. 2014 May.

Abstract

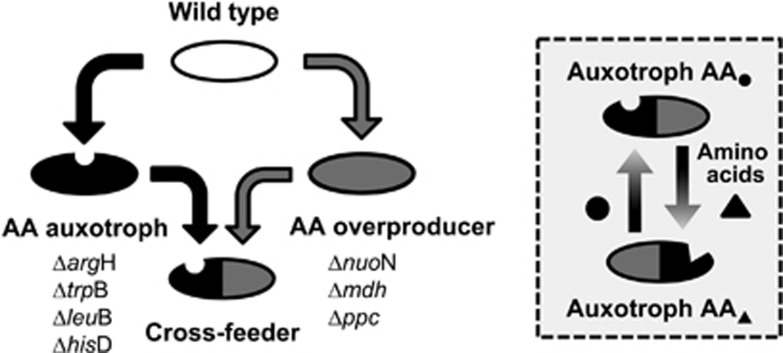
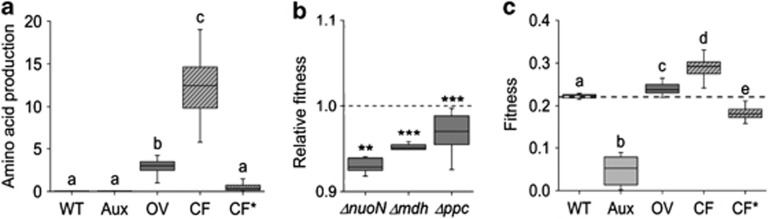
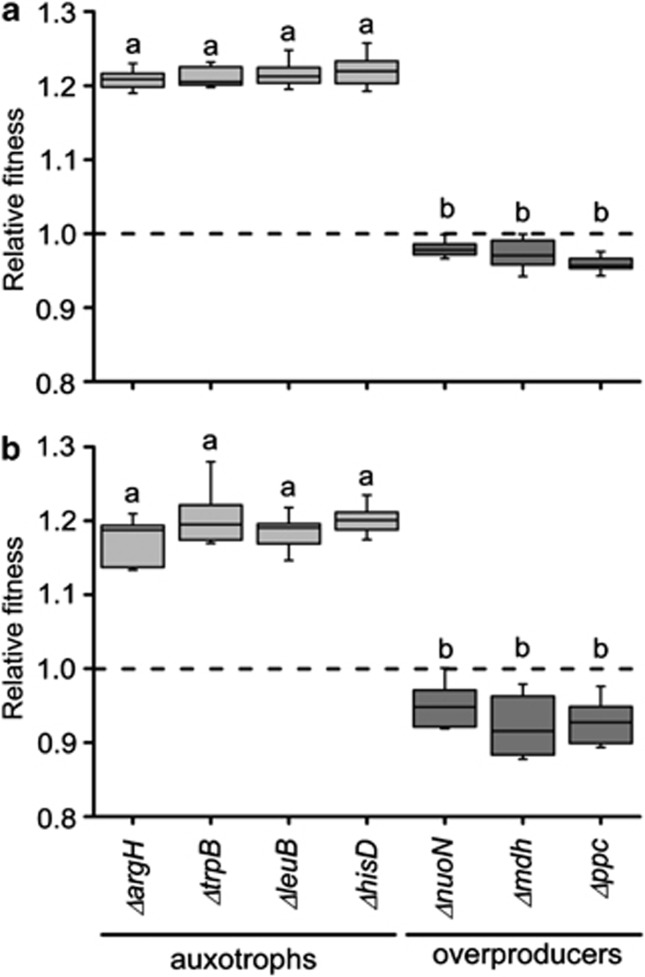
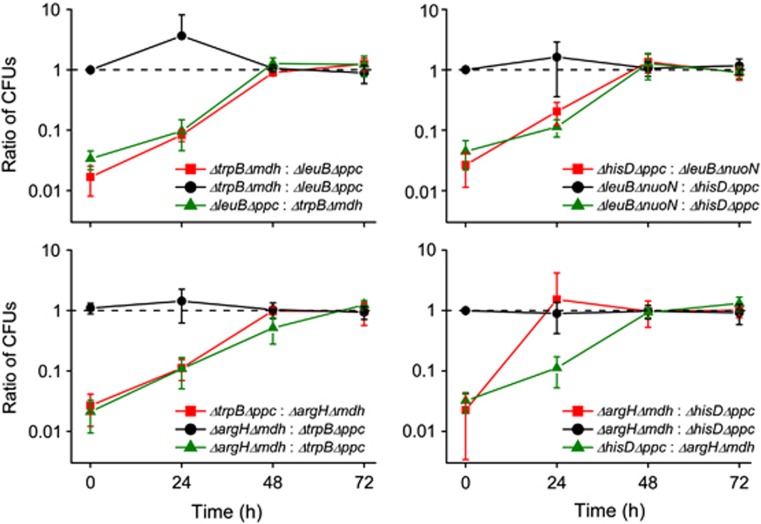
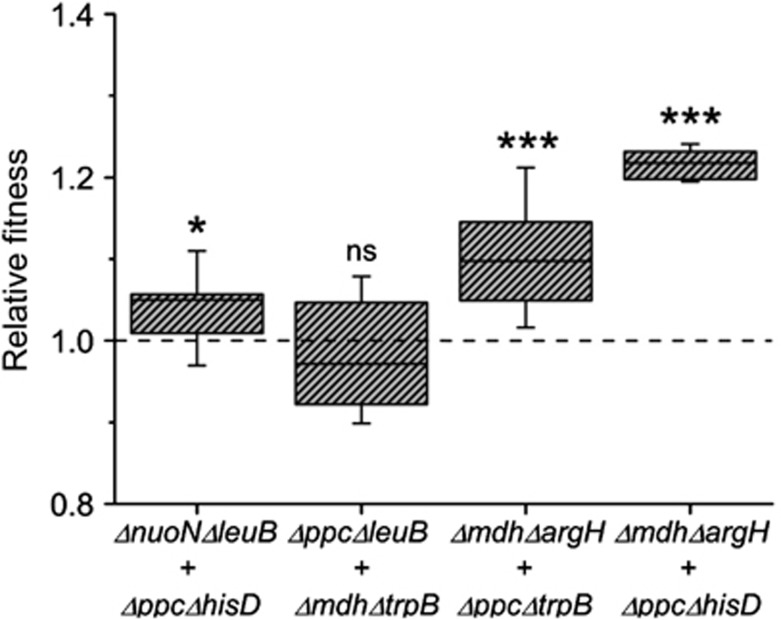
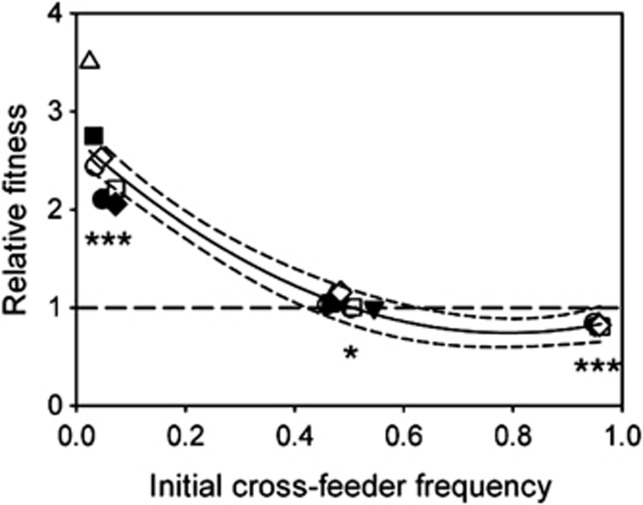
Cross-feeding interactions, in which bacterial cells exchange costly metabolites to the benefit of both interacting partners, are very common in the microbial world. However, it generally remains unclear what maintains this type of interaction in the presence of non-cooperating types. We investigate this problem using synthetic cross-feeding interactions: by simply deleting two metabolic genes from the genome of Escherichia coli, we generated genotypes that require amino acids to grow and release other amino acids into the environment. Surprisingly, in a vast majority of cases, cocultures of two cross-feeding strains showed an increased Darwinian fitness (that is, rate of growth) relative to prototrophic wild type cells--even in direct competition. This unexpected growth advantage was due to a division of metabolic labour: the fitness cost of overproducing amino acids was less than the benefit of not having to produce others when they were provided by their partner. Moreover, frequency-dependent selection maintained cross-feeding consortia and limited exploitation by non-cooperating competitors. Together, our synthetic study approach reveals ecological principles that can help explain the widespread occurrence of obligate metabolic cross-feeding interactions in nature.


Figures

Figure 1
Figure 1
Design strategy of synthetic cross-feeding interactions. Overview over the genes deleted in E. coli wild type (WT) to yield one of four single-gene deletion mutants that are either auxotrophic for one amino acid (AA, that is, arginine, tryptophan, leucine and histidine) or overproduce AAs, as well as double deletion mutants (that is, ‘cross-feeders'), in which the two mutations causing AA auxotrophy and overproduction were combined in all possible combinations. Coculturing two of those cross-feeders should result in reciprocal exchange of essential amino acids (inset).
Figure 2
Figure 2
Characterisation of mutants and coculture experiment. (a) Amino acid (AA) production levels (that is, arginine, tryptophan, leucine, and histidine) of WT, four auxotrophs (Aux), three overproducers (OV), eleven cross-feeders (CF) and the cross-feeding genotype ΔleuBΔnuoN (CF*) within 24 h determined as productivity of cocultured AA auxotrophs (n=8 for every auxotroph-genotype combination). Combinations with matching amino acid auxotrophies were excluded. (b) Competitive fitness of the three AA-overproducing mutants relative to WT within 24 h in minimal medium. Relative fitness is the ratio of Malthusian parameters and the dashed line indicates equality in fitness between WT and competitor. Asterisks indicate fitness values that were significantly different from 1 (that is, WT fitness, one-sample t-test, **P<0.01, ***P<0.001, n=10). (c) Fitness given as the Malthusian parameter of WT, pairs of cocultured auxotrophs (Aux, 6 combinations), overproducers (OV, 3), cross-feeders (CF, 45), and cross-feeding consortia involving strain ΔleuBΔnuoN (CF*, 9) within 24 h (n=8 for WT and every pair of genotypes). Different letters indicate significant differences (LSD post hoc test, P<0.001). Boxplots: median (horizontal lines in boxes), interquartile range (boxes), 1.5 × -interquartile range (whiskers).
Figure 3
Figure 3
Competition of single-gene deletion mutants against WT. (a) Fitness of amino-acid auxotrophic and overproducing single-gene deletion mutants relative to WT within 24 h in minimal medium supplemented by either culture extract from the Δmdh mutant, or (b) a mixture of amino acids (150 μM) that resembled the relative composition of the amino-acid mixture produced by Δmdh. The dashed line indicates equality in fitness between WT and the corresponding competitor. Different letters denote significant differences (LSD post hoc test, P<0.05). All fitness values were significantly different from 1 (one-sample t-test, P⩽0.05, n⩾8).
Figure 4
Figure 4
Reciprocal invasion-from-rare experiments with four cross-feeding consortia. In every case, each cross-feeding mutant (Supplementary Figure S2) was inoculated 1:100 to its respective partner and the number of colony-forming units (CFUs) of both competitors followed over time (red and green symbols). Consortia inoculated at 1:1 ratio (dashed line) served as controls (black symbols). Mean number of CFUs (±95% CI) are given (n=8 for each comparison). A full color version of this figure is available at The ISME Journal online.
Figure 5
Figure 5
Competition of cross-feeding consortia against wild type. Representative pairs of cross-feeding mutants (Supplementary Figure S2) were competed against WT for 24 h in liquid minimal medium. Relative fitness is the ratio of Malthusian parameters and the dashed line indicates equality in fitness between WT and the cross-feeding consortia. All fitness values were significantly different from 1 (P⩽0.03, n=10), except the ones labelled with ‘ns'.
Figure 6
Figure 6
Reciprocal invasion-from-rare experiments with four cross-feeding consortia and the corresponding auxotrophs. Competition experiments with each of the four representative cross-feeding consortia (Supplementary Figure S2) and one of the two corresponding auxotrophs were initiated at a ratio of 1:100, 100:1 and 1:1 and the fitness of the cross-feeding populations relative to auxotrophs within 24 h determined. Shown is the percentage of the cross-feeding consortia at the onset of the experiment (x-axis) and their fitness relative to the focal auxotrophs after 24 h (y-axis). Different symbols correspond to the eight different combinations tested and every point is the mean of eight replicates. The solid line shows the quadratic regression of fitness on frequency (R2=0.91, P<0.0001) and the dotted line the 95% confidence interval of this regression. Asterisks indicate significant differences from 1 (that is, fitness of auxotrophs (dashed line): one-sample t-test: ***P<0.001, *P<0.05, n=8).

References

    1. Amarasekare P. Competitive coexistence in spatially structured environments: a synthesis. Ecol Lett. 2003;6:1109–1122.
    1. Axelrod R, Hamilton WD. The evolution of cooperation. Science. 1981;211:1390–1396. - PubMed
    1. Baba T, Ara T, Hasegawa M, Takai Y, Okumura Y, Baba M, et al. Construction of Escherichia coli K-12 in-frame, single-gene knockout mutants: the Keio collection. Mol Syst Biol. 2006;2:0008. - PMC - PubMed
    1. Benjamini Y, Hochberg Y. On the adaptive control of the false discovery fate in multiple testing with independent statistics. J Educ Behav Stat. 2000;25:60–83.
    1. Bertels F, Merker H, Kost C. Design and characterization of auxotrophy-based amino acid biosensors. PLoS One. 2012;7:e41349. - PMC - PubMed

Publication types