. 2013 Nov 27;5(213):213ra164.
doi: 10.1126/scitranslmed.3007148.

HIV-1 Vpr induces adipose dysfunction in vivo through reciprocal effects on PPAR/GR co-regulation

Affiliations

HIV-1 Vpr induces adipose dysfunction in vivo through reciprocal effects on PPAR/GR co-regulation

Neeti Agarwal et al. Sci Transl Med. .

Abstract

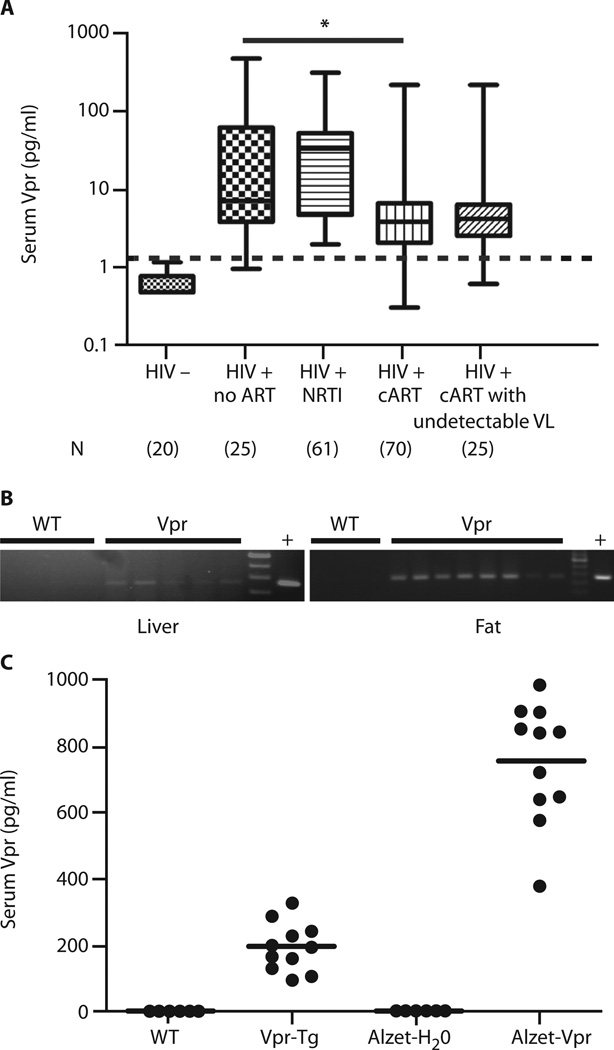
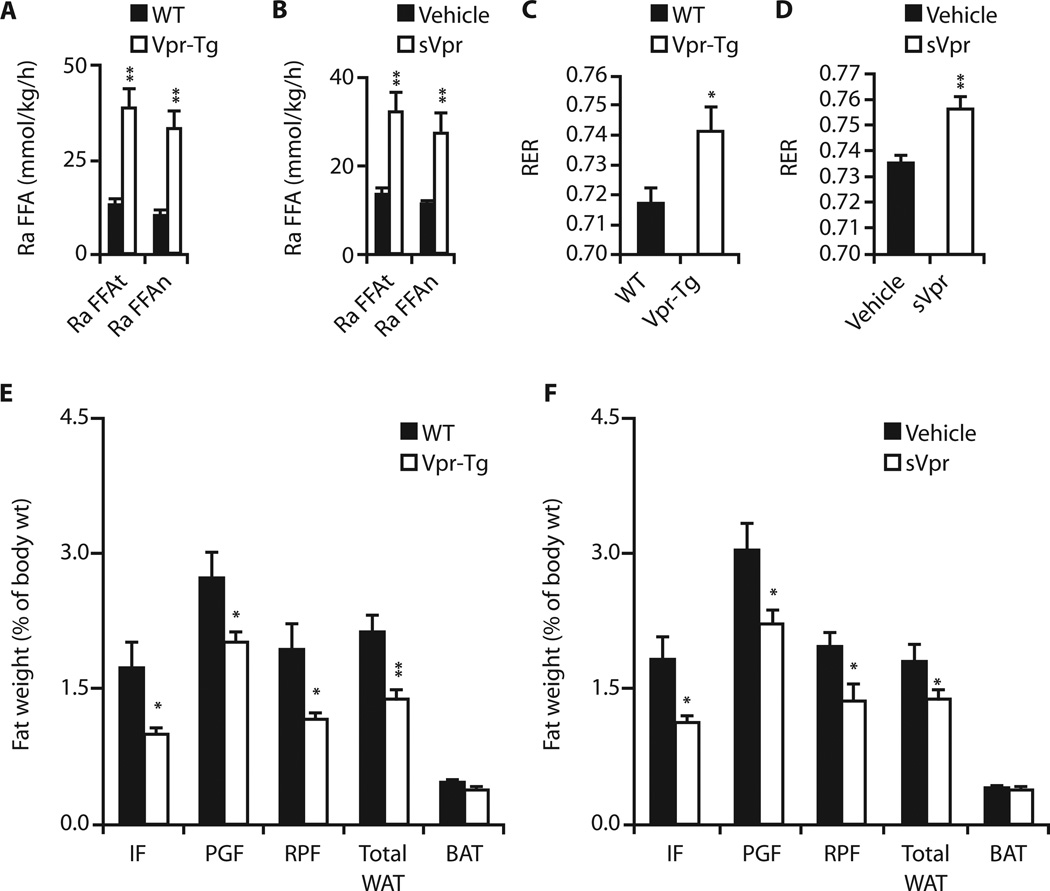
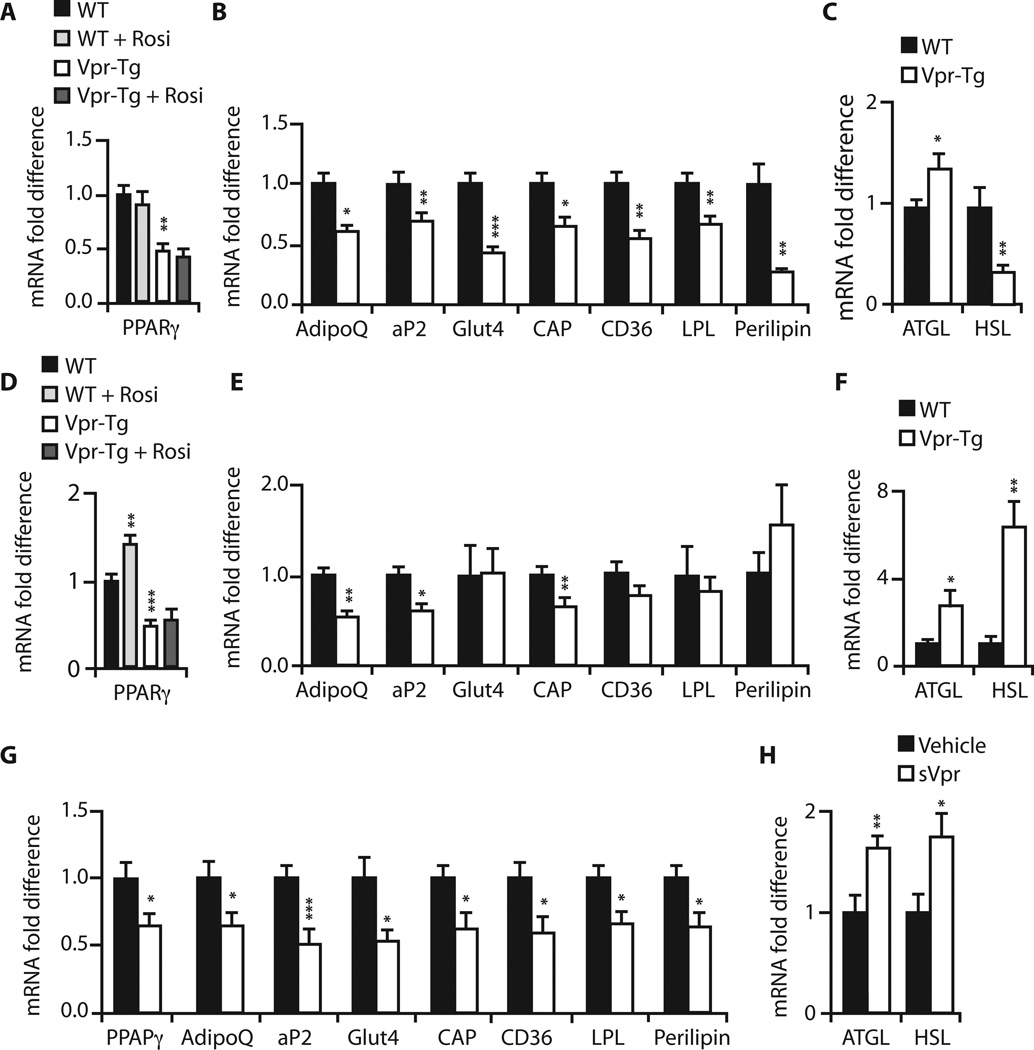
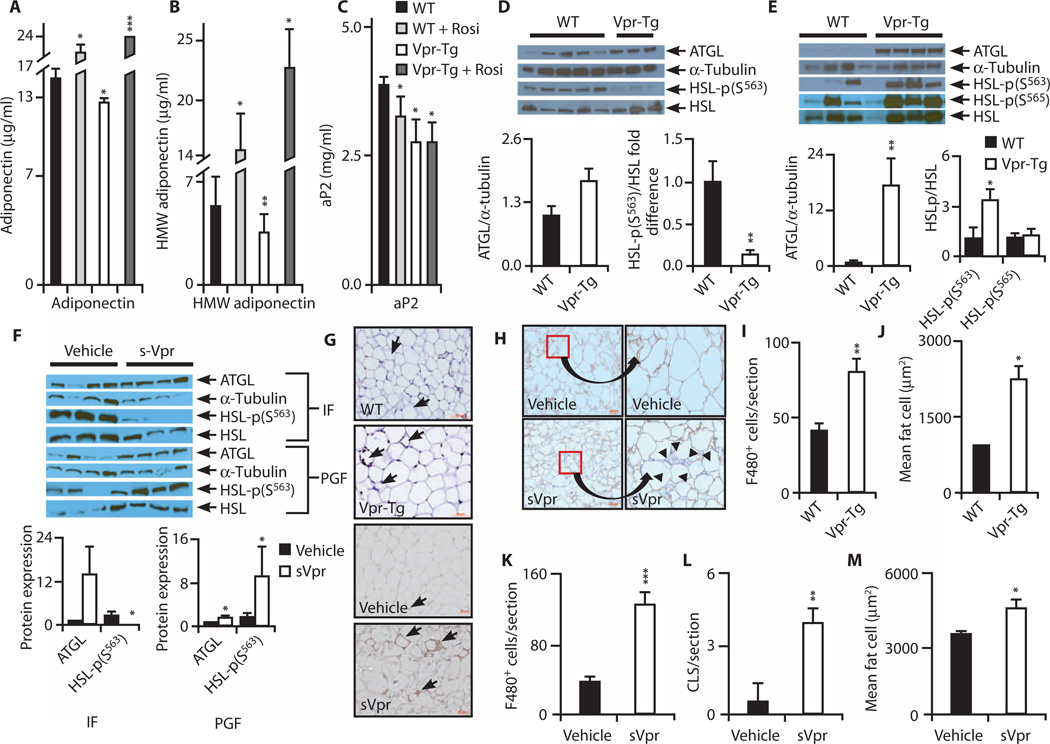
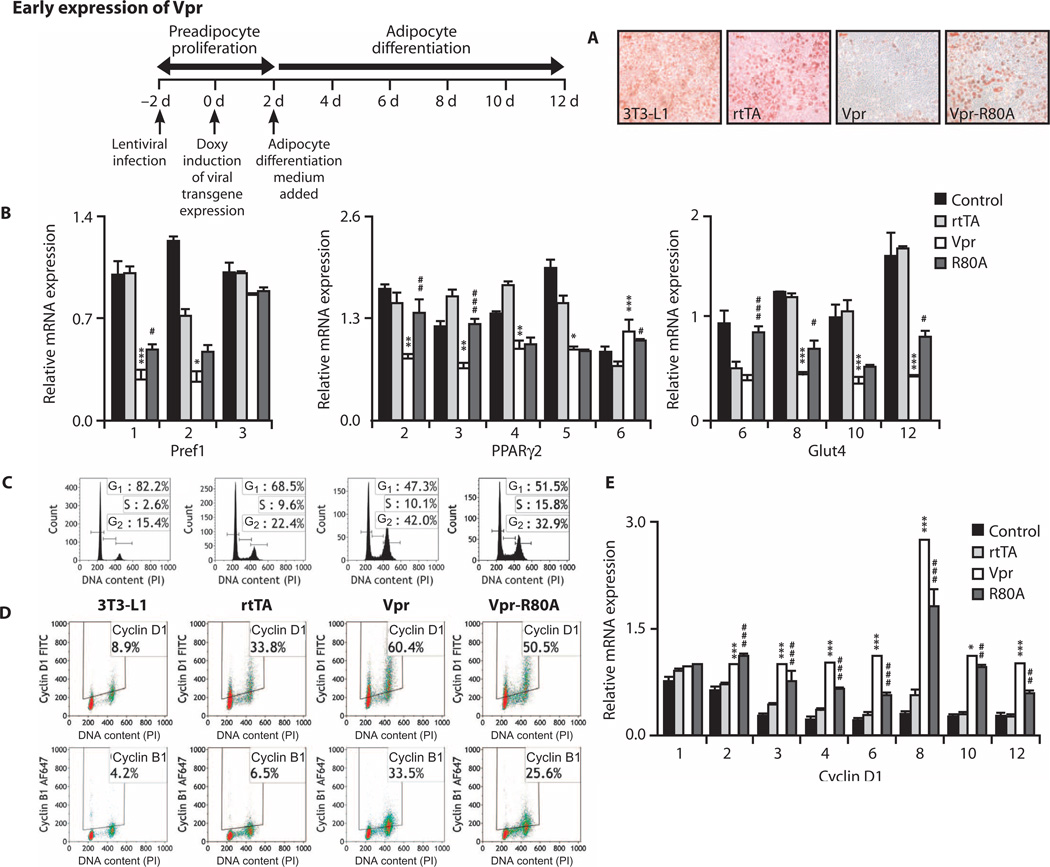
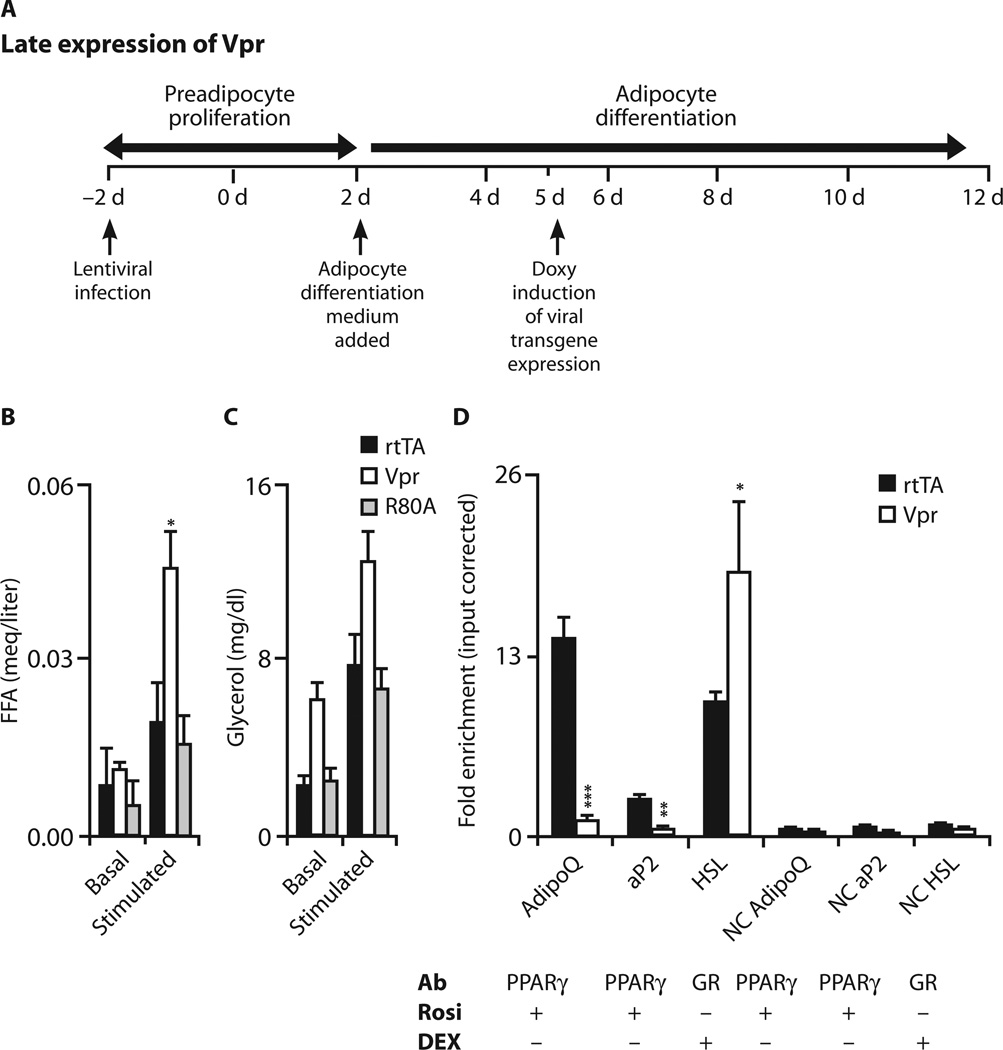
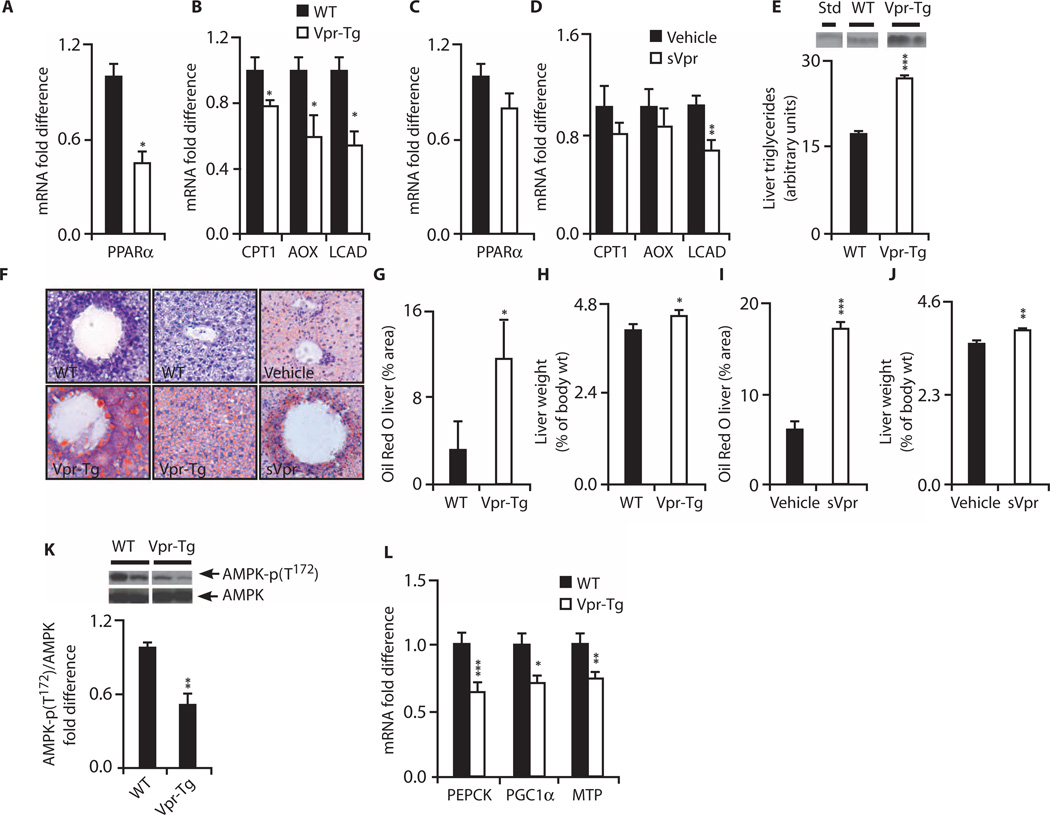
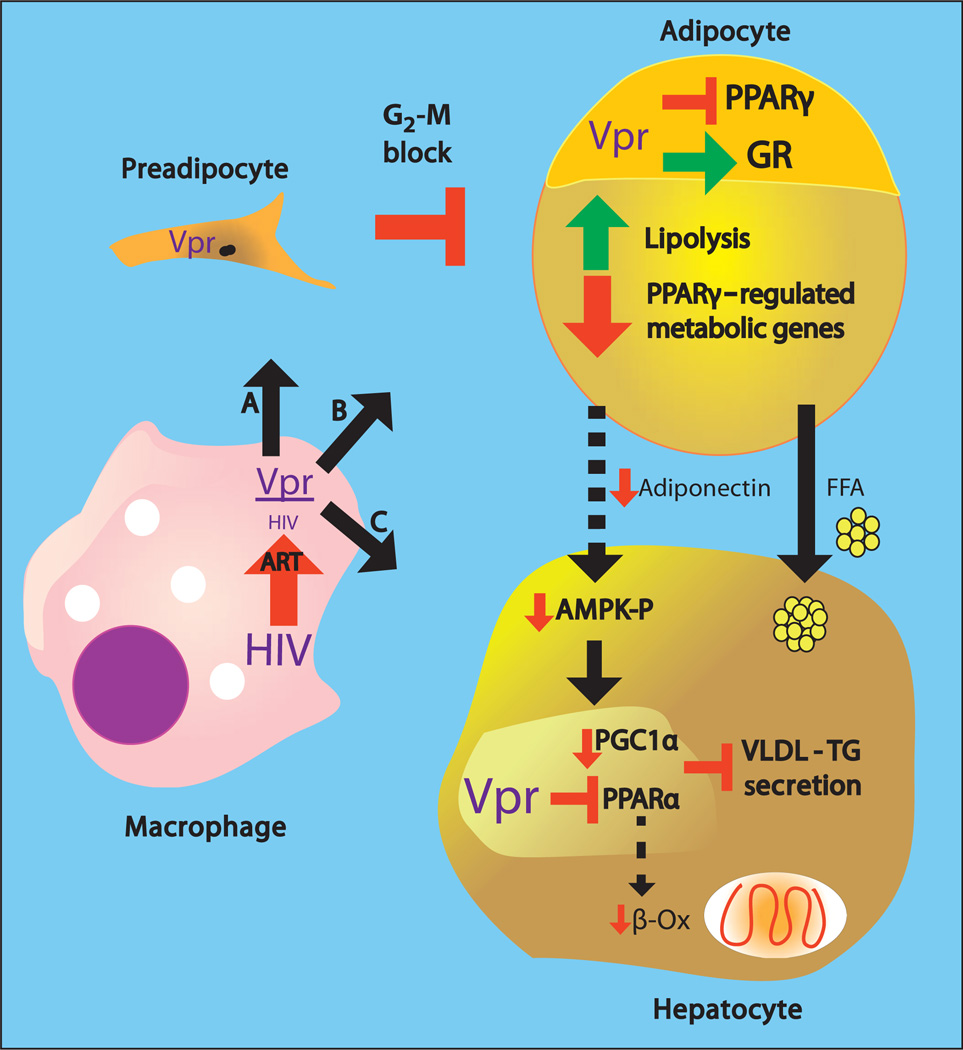
Viral infections, such as HIV, have been linked to obesity, but mechanistic evidence that they cause adipose dysfunction in vivo is lacking. We investigated a pathogenic role for the HIV-1 accessory protein viral protein R (Vpr), which can coactivate the glucocorticoid receptor (GR) and co-repress peroxisome proliferator-activated receptor γ (PPARγ) in vitro, in HIV-associated adipose dysfunction. Vpr circulated in the blood of most HIV-infected patients tested, including those on antiretroviral therapy (ART) with undetectable viral load. Vpr-mediated mechanisms were dissected in vivo using mouse models expressing the Vpr transgene in adipose tissues and liver (Vpr-Tg) or infused with synthetic Vpr. Both models demonstrated accelerated whole-body lipolysis, hyperglycemia and hypertriglyceridemia, and tissue-specific findings. Fat depots in these mice had diminished mass, macrophage infiltration, and blunted PPARγ target gene expression but increased GR target gene expression. In liver, we observed blunted PPARα target gene expression, steatosis with decreased adenosine monophosphate-activated protein kinase activity, and insulin resistance. Similar to human HIV-infected patients, Vpr circulated in the serum of Vpr-Tg mice. Vpr blocked differentiation in preadipocytes through cell cycle arrest, whereas in mature adipocytes, it increased lipolysis with reciprocally altered association of PPARγ and GR with their target promoters. These results delineate a distinct pathogenic sequence: Vpr, released from HIV-1 in tissue reservoirs after ART, can disrupt PPAR/GR co-regulation and cell cycle control to produce adipose dysfunction and hepatosteatosis. Confirmation of these mechanisms in HIV patients could lead to targeted treatment of the metabolic complications with Vpr inhibitors, GR antagonists, or PPARγ/PPARα agonists.


Figures

Fig. 1
Fig. 1. Vpr in HIV patients and mouse models
(A) Box-and-whisker plots of serum Vpr concentrations in HIV-negative persons and four HIV-infected groups: ART-naïve, on NRTI only, on cART, and on cART with undetectable VL. Median Vpr concentrations in patients: ART-naïve = 7.0 pg/ml; NRTI only = 32.0 pg/ml; cART = 3.9 pg/ml; cART with undetectable VL = 4.2 pg/ml. Whiskers indicate minimum and maximum of all data. Dashed line indicates cutoff between false- and true-positive values. False-positive rate = 3% ART-naïve HIV, 0% HIV on NRTI, 6% HIV on cART, and 4% HIV on cART with undetectable VL. (B) Vpr mRNA in liver of Vpr-Tg (n = 5) compared to wild-type (WT) littermates (n = 5) and in PGF of Vpr-Tg (n = 8) compared to WT (n = 5); “+” indicates positive control DNA. (C) Vpr protein in sera of Vpr-Tg and sVpr-treated mice. Horizontal lines indicate mean values. *P = 0.001 for ART-naïve compared to cART-treated HIV patients.
Fig. 2
Fig. 2. Altered fasting lipid kinetics and fat mass in Vpr-Tg and sVpr-treated mice
(A and B) Accelerated fasting total and net lipolysis in (A) Vpr-Tg (n = 6 per group; P = 0.007 and 0.005) and (B) sVpr-treated (n = 7) compared to water (vehicle)–treated (n = 4) mice (P = 0.01 and 0.006). Ra FFAt, total free fatty acid plasma entry rate (total lipolysis); Ra FFAn, net free fatty acid plasma entry rate (net lipolysis). (C and D) Increased RER during initial 4 hours of fasting in (C) Vpr-Tg (n = 5 per group; P = 0.04) and (D) sVpr-treated (n = 5 per group; P = 0.005) mice. (E) Reduced IF (P = 0.03), PGF (P = 0.05), RPF (P = 0.05), and total WAT (P = 0.001) mass (normalized to body weight) in Vpr-Tg (n = 8 per group) mice. (F) Reduced IF (P = 0.03), PGF (P = 0.03), RPF (P = 0.04), and total WAT (P = 0.03) mass in sVpr-treated (n = 8 per group) mice. BAT, brown adipose tissue. Values are means ± SE. *P < 0.05, **P < 0.01.
Fig. 3
Fig. 3. Altered expression of PPARγ- and GR-regulated genes in PGF and IF of Vpr-Tg and PGF of sVpr-treated mice
(A) Reduced Pparγ mRNA in IF of Vpr-Tg (P = 0.01); rosiglitazone had no effect. (B) Reduced AdipoQ (P = 0.02), Ap2 (P = 0.009), Glut4 (P = 0.0003), Cap (P = 0.03), Cd36 (P = 0.005), Lpl (P = 0.01), and Plin1 (P = 0.003) mRNA in IF of Vpr-Tg. (C) Increased Atgl (P = 0.04) and reduced Hsl (P = 0.01) mRNA in IF of Vpr-Tg. (D) Reduced Pparγ mRNA in PGF of Vpr-Tg (P = 0.001); rosiglitazone increased mRNA expression in WT (P = 0.01) but not in Vpr-Tg. (E) Reduced AdipoQ (P = 0.01), Ap2 (P = 0.03), Cap (P = 0.01), Glut4 (P = 0.95), Cd36 (P = 0.22), Lpl (P = 0.90), and Plin1 (P = 0.30) mRNA in PGF of Vpr-Tg. (F) Increased Atgl (P = 0.05) and Hsl (P = 0.002) mRNA in PGF of Vpr-Tg. (G) ReducedmRNA of Pparγ (P = 0.03), AdipoQ (P = 0.04), Ap2 (P = 0.001), Glut4 (P = 0.02), Cap (P = 0.02), Cd36 (P = 0.02), Lpl (P = 0.02), and Plin1 (P = 0.02) in PGF of sVpr-treated mice. (H) Increased Atgl (P = 0.01) and Hsl (P = 0.02) mRNA in PGF of sVpr-treated mice. n = 8 per group for all experiments. Values are means ± SE. *P < 0.05, **P < 0.01, ***P < 0.001.
Fig. 4
Fig. 4. Adipokines, lipolytic enzymes, and adipose inflammation in Vpr mice
(A and B) Reduced plasma total (P = 0.04) and HMW (P = 0.01) adiponectin in Vpr-Tg. n = 5 per group. (C) Reduced plasma aP2 in Vpr-Tg (P = 0.03). n = 5 for WT and rosiglitazone-treated mice; n = 8 for Vpr-Tg. (D) ATGL in Vpr-Tg compared to WT IF (P = 0.06), and decreased ratio of phospho-HSL (Ser563) to total HSL protein in Vpr-Tg (n = 3) compared to WT (n = 5) IF (P = 0.02). Immunoblots are shown above bar graphs. (E) Increased ATGL in Vpr-Tg PGF (n = 4 per group; P = 0.01); increased ratio of phospho-HSL (Ser563) to HSL (P = 0.05) but not of phospho-HSL (Ser565) to HSL in Vpr-Tg (n = 3) compared to WT (n = 5) PGF. (F) ATGL in sVpr-treated compared to water-treated IF (P = 0.08), and decreased ratio of phospho-HSL (Ser563) to HSL in sVpr-treated IF (n = 4 per group; P = 0.02). Increased ATGL and increased ratio of phospho-HSL (Ser563) to HSL in PGF of sVpr-treated mice (n = 4 per group; P = 0.04). (G) F4/80+ macrophages in PGF of Vpr-Tg (×40) and sVpr-treated mice (×20). Arrows indicate macrophages and crown-like structures (CLSs). (H) F4/80+ macrophages and perilipin in PGF of sVpr-treated compared to water-treated mice [×20, cropped and expanded to demonstrate absent perilipin staining (arrowheads) adjacent to CLSs]. (I) Increased F4/80+ macrophages in Vpr-Tg PGF. n = 9 sections from three mice per group (P = 0.003). (J) Increased adipocyte size in Vpr-Tg mice (P = 0.04). (K and L) Increased F4/80+ macrophages (P = 0.0002) and CLSs in PGF (P = 0.006) of sVpr-treated mice (n = 9 sections from four mice per group). (M) Increased adipocyte size in sVpr-treated mice (P = 0.03). Values are means ± SE. *P < 0.05, **P < 0.01, ***P < 0.001 compared to WT.
Fig. 5
Fig. 5. Vpr blocks differentiation in 3T3-L1 preadipocytes
(A) Oil Red O staining in 3T3-L1 preadipocytes 10 days after doxycycline. Timeline indicates chronology of lentivirus infection, doxycycline addition (early), and differentiation medium addition. Vpr prevented lipid accumulation, attenuated with Vpr-R80A. (B) Expression of Pref1, Pparγ, and Glut4 mRNA in preadipocytes on stated days after doxycycline. Vpr reduced the expression of differentiation genes, attenuated with Vpr-R80A. (C) Cell cycle histograms of preadipocytes 24 hours after doxycycline (day 1). Vpr caused arrest at G2-M, attenuated with Vpr-R80A. (D) Vpr caused accumulation of cyclins D1 and B1 in the preadipocytes, attenuated with Vpr-R80A. (E) Vpr caused persistent elevation of Ccnd1 (cyclin D1) mRNA expression in preadipocytes. 3T3-L1, no lentivirus; rtTA, infected with control virus; Vpr, infected with WT-Vpr virus; Vpr-R80A, infected with Vpr R80A virus. Values are means ± SE. *P < 0.05, **P < 0.01, ***P < 0.001 (comparison between rtTA and Vpr); #P < 0.05, ##P < 0.01, ###P < 0.001 (comparison between Vpr and R80A).
Fig. 6
Fig. 6. Vpr increases lipolysis in adipocytes
(A) Timeline indicates chronology of lentivirus infection, differentiation medium addition, and doxycycline addition (late). (B and C) Lipolysis (FFA and glycerol release), basal and after stimulation with vehicle or CL316243 (β3-adrenoceptor agonist), in 3T3-L1 cells 72 hours after doxycycline. Vpr increased FFA release (P = 0.05). (D) Quantification of PPARγ- or GR-associated sequences of AdipoQ, Ap2, and Hsl after ChIP of PPARγ or GR after rosiglitazone or dexamethasone treatment 24 hours after doxycycline. Data are representative of three experiments. Binding site levels of AdipoQ (P = 0.001) and Ap2 (P = 0.01) were lower, and that of Hsl (P = 0.004) was higher, in Vpr compared to control (rtTA) condition. Off-target DNA sequences ~2 kb upstream of the PPARγ/GR-binding sites were amplified as negative controls (NC). 3T3-L1, no lentivirus; rtTA, infected with control virus; Vpr, infected with WT-Vpr virus; Vpr-R80A, infected with Vpr-R80A mutant virus. Values are means ± SE. *P < 0.05, **P < 0.01, ***P < 0.001.
Fig. 7
Fig. 7. Hepatosteatosis and altered hepatic expression of PPARα-regulated oxidative genes in Vpr-Tg and sVpr-treated mice
(A) Reduced Pparα mRNA in Vpr-Tg (n = 8 per group; P = 0.03). (B) Reduced mRNA of Cpt1α (P = 0.05), Aox (P = 0.02), and Lcad (P = 0.03) in Vpr-Tg (n = 8 per group). (C) Pparα mRNA in sVpr-treated compared to water-treated mice (n = 8 per group). (D) mRNA of Lcad (P = 0.009), Cpt1α, and Aox in sVpr-treated mice (n = 8 per group). (E) Increased liver triglyceride content in Vpr-Tg (n = 3 per group, P = 0.0005). (F) Oil Red O–stained liver sections of Vpr-Tg compared to WT mice and sVpr-treated compared to water-treated mice (×40). (G) Increased Oil Red O staining in Vpr-Tg (n = 6) compared to WT (n = 4) liver (P = 0.05). (H) Increased liver mass (normalized to body weight) in Vpr-Tg (n = 4 per group; P = 0.05). (I) Increased Oil Red O staining in liver of sVpr-treated mice (n = 6 per group; P = 0.0001). (J) Increased liver mass (normalized to body weight) in sVpr-treated mice (n = 8 per group; P = 0.004). (K) Reduced ratio of phosphorylated AMPK to total AMPK in Vpr-Tg (n = 5) compared to WT (n = 4) liver (P = 0.01). (L) Decreased Pepck (P = 0.001), Pgc1α (P = 0.04), and Mtp (P = 0.008) mRNA in liver of Vpr-Tgmice (n = 8 per group). Values are means ± SE. *P < 0.05, **P < 0.01, ***P < 0.001.
Fig. 8
Fig. 8. Vpr-mediated pathogenesis of HIV-associated metabolic defects
HIV persisting in tissue macrophages or sequestered T cells after ART releases Vpr that transduces and affects preadipocytes, adipocytes, and hepatocytes. (A) In preadipocytes, Vpr blocks the cell cycle at G2-M, blunting turnover and differentiation into adipocytes. (B) In mature adipocytes, Vpr co-represses PPARγ-regulated genes and coactivates GR-regulated genes, leading to lipolysis, defective fatty acid storage and metabolism, and diminished secretion of adiponectin. (C) In hepatocytes, Vpr co-represses PPARa, leading to defective fat oxidation and blunted VLDL-triglyceride packaging and export. Hepatic consequences secondary to Vpr’s adipocyte effects include increased fatty acid flux and blunted activation of AMPK because of decreased adiponectin, leading to diminished PGC1α expression. Collectively, the direct and secondary hepatic effects lead to fatty liver.

Similar articles

Cited by

References

    1. Lyons MJ, Faust IM, Hemmes RB, Buskirk DR, Hirsch J, Zabriskie JB. A virally induced obesity syndrome in mice. Science. 1982;216:82–85. - PubMed
    1. Ramesh S, Sanyal AJ. Hepatitis C and nonalcoholic fatty liver disease. Semin. Liver Dis. 2004;24:399–413. - PubMed
    1. Dhurandhar NV. A framework for identification of infections that contribute to human obesity. Lancet Infect. Dis. 2011;11:963–969. - PubMed
    1. Carr A, Miller J, Law M, Cooper DA. A syndrome of lipoatrophy, lactic acidaemia and liver dysfunction associated with HIV nucleoside analogue therapy: Contribution to protease inhibitor-related lipodystrophy syndrome. AIDS. 2000;14:F25–F32. - PubMed
    1. Pond CM. Long-term changes in adipose tissue in human disease. Proc. Nutr. Soc. 2001;60:365–374. - PubMed

Publication types

LinkOut - more resources