. 2013 Dec 15;2(12):1279-87.
doi: 10.1242/bio.20135140.

Migratory and adhesive properties of Xenopus laevis primordial germ cells in vitro

Affiliations

Migratory and adhesive properties of Xenopus laevis primordial germ cells in vitro

Aliaksandr Dzementsei et al. Biol Open. .

Abstract

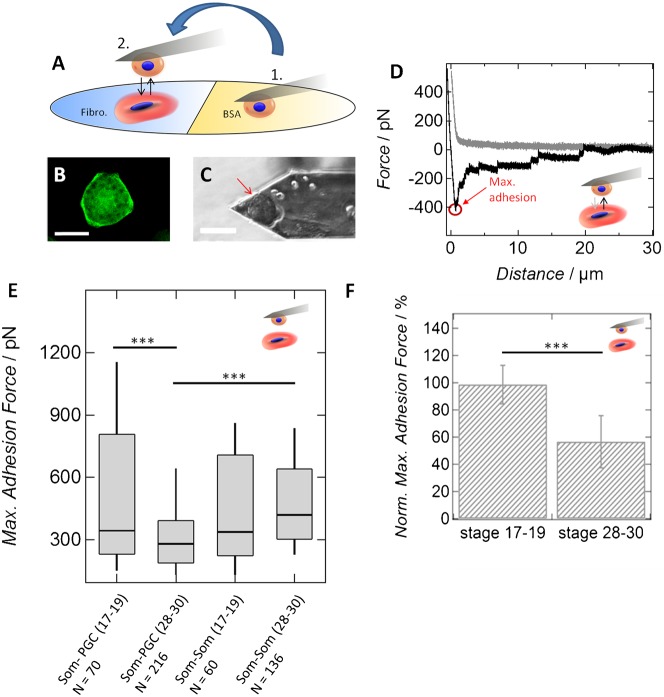
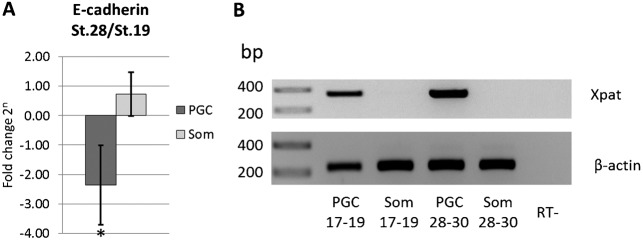
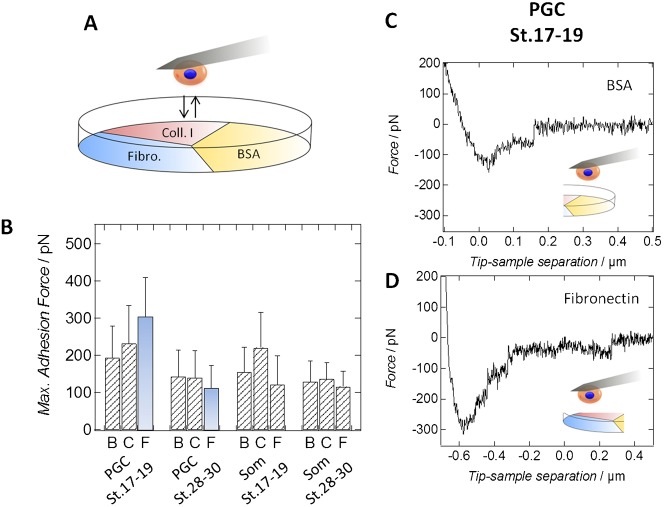
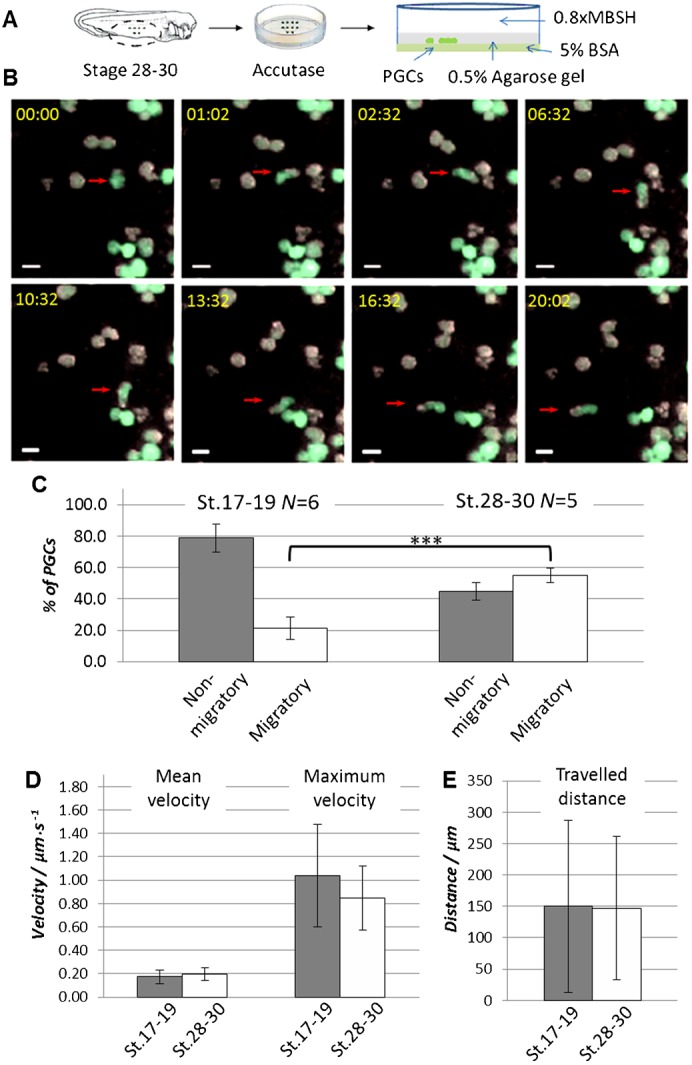
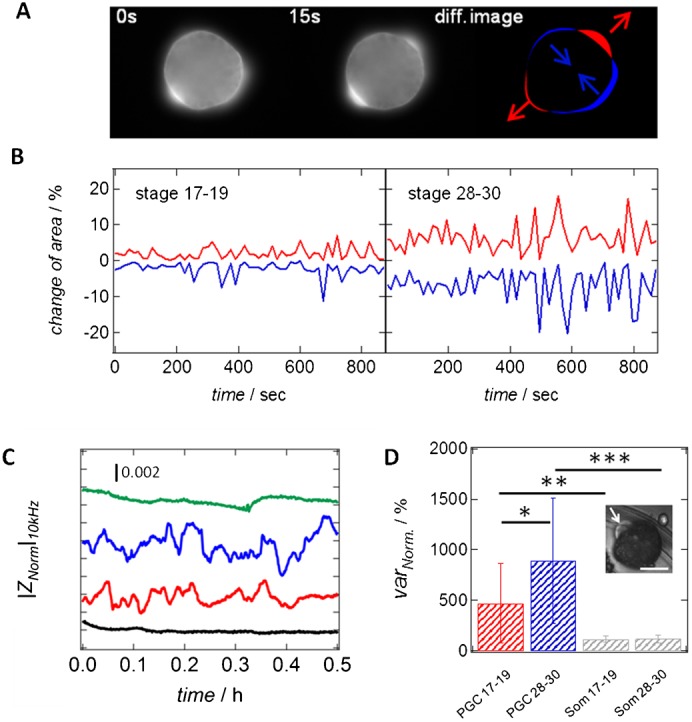
The directional migration of primordial germ cells (PGCs) to the site of gonad formation is an advantageous model system to study cell motility. The embryonic development of PGCs has been investigated in different animal species, including mice, zebrafish, Xenopus and Drosophila. In this study we focus on the physical properties of Xenopus laevis PGCs during their transition from the passive to the active migratory state. Pre-migratory PGCs from Xenopus laevis embryos at developmental stages 17-19 to be compared with migratory PGCs from stages 28-30 were isolated and characterized in respect to motility and adhesive properties. Using single-cell force spectroscopy, we observed a decline in adhesiveness of PGCs upon reaching the migratory state, as defined by decreased attachment to extracellular matrix components like fibronectin, and a reduced adhesion to somatic endodermal cells. Data obtained from qPCR analysis with isolated PGCs reveal that down-regulation of E-cadherin might contribute to this weakening of cell-cell adhesion. Interestingly, however, using an in vitro migration assay, we found that movement of X. laevis PGCs can also occur independently of specific interactions with their neighboring cells. The reduction of cellular adhesion during PGC development is accompanied by enhanced cellular motility, as reflected in increased formation of bleb-like protrusions and inferred from electric cell-substrate impedance sensing (ECIS) as well as time-lapse image analysis. Temporal alterations in cell shape, including contraction and expansion of the cellular body, reveal a higher degree of cellular dynamics for the migratory PGCs in vitro.

Keywords: Cell adhesion; Cell migration; Cellular dynamics; Primordial germ cells; Xenopus.


Conflict of interest statement

Competing interests: The authors have no competing interests to declare.

Figures

Fig. 1.
Fig. 1.. PGCs reduce overall cell-cell adhesion after transition to the active migration state.
(A) Cells were isolated from GFP_DELE mRNA injected embryos and transferred to the Petri dish half coated with fibronectin and half coated with bovine serum albumin (BSA). Weakly adhering cells from BSA-coated region were attached to an atomic force microscope cantilever (1). Subsequently, the attached cell is brought into contact with a cell spread on fibronectin-coated part of the Petri dish (2). (B) Fluorescence image of a labeled primordial germ cell spread on a fibronectin-coated Petri dish. (C) Bright-field image of a migratory PGC attached to a poly-D-lysin coated cantilever. Scale bars: 50 µm. (D) Example of a force-distance curve of two somatic cells from the same developmental stage. The approach curve (grey), as well as the retraction curve (black) are shown. (E) Maximum adhesion force either between PGCs and somatic endodermal cells (PGC-Som) or between two somatic endodermal cells (Som-Som) isolated from embryos at stages 17–19 (pre-migratory PGCs) or stages 28–30 (migratory PGCs). Box-whisker plots: lines reflect the median of the distribution, boxes comprise the 25th and 75th percentile, whisker tops and bottoms are drawn to the 10th and 90th percentiles, respectively. N corresponds to the number of curves that have been analyzed per category. *** corresponds to P-values<0.001 (Wilcoxon rank sum test). The number in brackets describes the stage of PGC development: 17–19: pre-migratory PGCs and 28–30: migratory PGCs. (F) Mean maximum adhesion force of either pre-migratory (stage 17–19, n = 4) or migratory (stage 28–30, n = 7) PGCs after contact with a somatic cell from the corresponding stage. Here N corresponds to the number of cells per category. For each cell at least 4 force curves have been recorded. For each PGC-somatic cell interaction, values are normalized to the interaction between the same somatic cell and a second somatic cell. *** corresponds to P-value<0.001 (Wilcoxon rank sum test). All p-values are given in supplementary material Table S1.
Fig. 2.
Fig. 2.. E-cadherin is downregulated in migratory PGCs.
(A) Relative amount of E-cadherin (cdh1) in PGCs and somatic endodermal cells (Som) isolated from stage 28–30 embryos (migratory PGCs) normalized to E-cadherin level in the corresponding cell type isolated from stage 17–19 embryos (pre-migratory PGCs) measured by quantitative RT PCR. Relative amount was calculated by ΔΔCt method (see Material and Methods) using three independent cDNA preparations. Error bars represent standard deviation. * corresponds to P<0.05 (two-tailed t-test). (B) Agarose gel electrophoresis of PCR quality control for cDNA used in qPCR analysis. In contrast to somatic cells, PGC-specific cDNA contains Xpat transcript. Amplification of β-actin is used as a positive control; a sample obtained from reverse transcription of endodermal cells without adding reverse transcriptase (RT-) was used as a negative control. Marker lane on the left side of the gel indicates the relative size of amplified products in base pairs (bp).
Fig. 3.
Fig. 3.. Pre-migratory PGCs show high affinity to fibronectin.
(A) Schematic drawing of a Petri dish being divided into three sectors coated either with fibronectin, collagen I or bovine serum albumin (BSA). Either PGCs or somatic cells from both stages were brought into contact with the different substrates using single-cell force spectroscopy. (B) Maximum adhesion forces of either PGCs or somatic cells (Som) isolated from GFP_DELE mRNA injected embryos at developmental stage 17–19 (pre-migratory PGCs) or stage 28–30 (migratory PGCs) during interaction with BSA (B), collagen I (C) or fibronectin (F) coated surfaces. The most relevant change in interaction, the decline in binding strength of PGCs to fibronectin during development, is shown in blue bars. At least 37 force curves per category have been recorded and analyzed. Values are obtained from AFM force-distance curves. Negative forces correspond to positive adhesion forces. Error bars show standard deviations. All p-values obtained from either Wilcoxon rank sum tests or two-tailed t-tests are given in supplementary material Table S2. (C,D) Typical AFM force-distance curves monitoring the interaction of a pre-migratory primordial germ cell with a (C) BSA-coated and a (D) fibronectin-coated part of the Petri dish.
Fig. 4.
Fig. 4.. X. laevis PGC can migrate in vitro in the under-agarose migration assay.
(A) Ventral explants were dissected from the embryos at developmental stage 17–19 or 28–30 injected at 2-cell stage vegetally with GFP_DELE mRNA to label PGCs. Explants were treated with accutase and the dissociated cells were transferred between 0.5% agarose gel and a 5% BSA-coated Petri dish in 0.8× MBSH buffer. (B) Time-lapse images of an under-agarose migration assay with dissociated endodermal cells from stage 28–30 embryos. PGCs can be identified as GFP-positive (green) in contrast to the GFP-negative somatic cells. Red arrows indicate migrating PGC. Relative time from the start of the time-lapse imaging is shown in the upper left corner of each image panel (min:sec). Scale bars: 20 µm. (C) Time-lapse microscopy was used to monitor the behavior of PGCs. Relative amount of migratory and non-migratory cells in the total amount of analyzed PGCs was calculated for each experiment. N – number of experiments. Error bars represent standard deviation. *** corresponds to P<0.001 (two-tailed t-test). (D,E) Migrating cells from stage 17–19 (n = 17) and stage 28–30 (n = 28) were used for the tracking analysis. Diagrams represent mean and maximum velocity of the cells (D) and distance which migrating PGCs travelled from the start (E). Error bars represent standard deviation.
Fig. 5.
Fig. 5.. PGCs isolated from tailbud stage embryos show high cellular motility.
(A) Time-lapse fluorescence images of GFP-labeled PGCs from the migratory stage were taken with a time interval of 15 s. Subtracting two successive images from each other results in a difference image showing the expanding (red) and contracting (blue) regions of the cell over time. Arrows underscore the direction of expansion/contraction. (B) Time traces of the contracting (blue) and expanding (red) area of PGCs from the pre-migratory (stage 17–19) and the migratory (stage 28–30). Values are normalized to the current cell area at each time point and given in percentages. (C) Time-resolved, normalized and detrended impedance data of an uncovered electrode (black line), a single pre-migratory primordial germ cell (PGC stage 17–19, red line), a single migratory primordial germ cell (PGC stage 28–30, blue line) and a migratory primordial germ cell treated with 100 µM cytochalasin B (PGC stage 28–30, green line). All measurements were recorded at an excitation frequency of 10 kHz. The curves are arbitrarily shifted in the y-direction for better visibility. (D) Calculated variances obtained from time-resolved impedance data (C) for single pre-migratory primordial germ cell (PGC stage 17–19, n = 7, red) and single migratory primordial germ cell (PGC stage 28–30, n = 6, blue). Additionally, normalized variances of somatic endodermal cells from both stages of embryonic development (stage 17–19 with n = 4 and stage 28–30 with n = 6) are shown in grey. Values are given in percentages and normalized to the variance of the time-trace of an uncovered electrode (100%). N depicts the number of investigated cells per category. Error bars represent standard deviation. * corresponds to P-value<0.05 (P-value = 0.079), ** corresponds to P-value<0.1 (P-value = 0.028), *** corresponds to P-value<0.01 (P-value = 0.001). In all cases a Wilcoxon rank sum test was performed. Inlay: Single migratory PGC (stage 28–30) showing a strong formation of blebs (indicated by white arrow). Scale bar: 10 µm.

Similar articles

Cited by

References

    1. Berekelia L. A., Ponomarev M. B., Mikriukov A. A., Luchinskaia N. N., BeliavskiǏ A. V. (2005). [Molecular mechanisms of germ cell line determination in animals]. Mol. Biol. (Mosk.) 39, 664–677. - PubMed
    1. Blaser H., Eisenbeiss S., Neumann M., Reichman-Fried M., Thisse B., Thisse C., Raz E. (2005). Transition from non-motile behaviour to directed migration during early PGC development in zebrafish. J. Cell Sci. 118, 4027–4038 10.1242/jcs.02522 - DOI - PubMed
    1. Cannon M. J., Percival D. B., Caccia D. C., Raymond G. M., Bassingthwaighte J. B. (1997). Evaluating scaled windowed variance methods for estimating the Hurst coefficient of time series. Physica A 241, 606–626 10.1016/S0378-4371(97)00252-5 - DOI - PMC - PubMed
    1. Charras G., Paluch E. (2008). Blebs lead the way: how to migrate without lamellipodia. Nat. Rev. Mol. Cell Biol. 9, 730–736 10.1038/nrm2453 - DOI - PubMed
    1. Charras G. T., Coughlin M., Mitchison T. J., Mahadevan L. (2008). Life and times of a cellular bleb. Biophys. J. 94, 1836–1853 10.1529/biophysj.107.113605 - DOI - PMC - PubMed

LinkOut - more resources