. 2013 Dec 15;27(24):2648-62.
doi: 10.1101/gad.232710.113. Epub 2013 Nov 27.

Role of SWI/SNF in acute leukemia maintenance and enhancer-mediated Myc regulation

Affiliations

Role of SWI/SNF in acute leukemia maintenance and enhancer-mediated Myc regulation

Junwei Shi et al. Genes Dev. .

Abstract

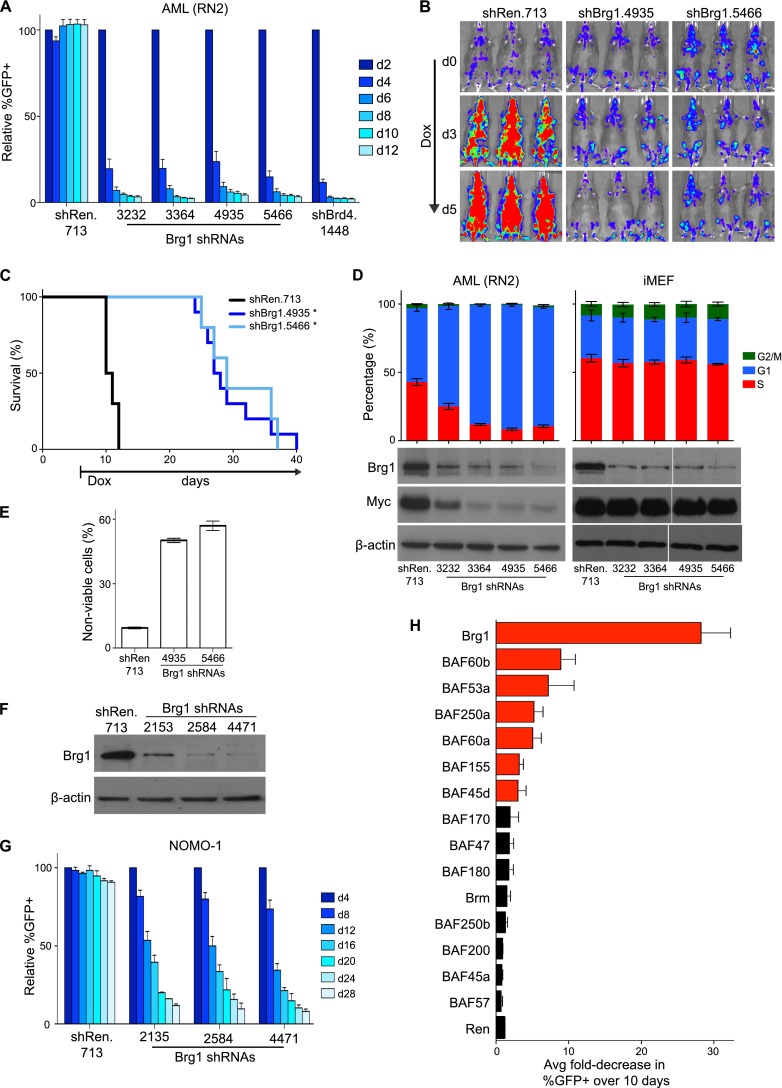
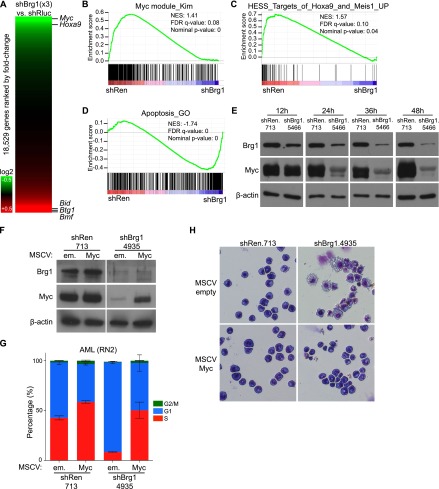
Cancer cells frequently depend on chromatin regulatory activities to maintain a malignant phenotype. Here, we show that leukemia cells require the mammalian SWI/SNF chromatin remodeling complex for their survival and aberrant self-renewal potential. While Brg1, an ATPase subunit of SWI/SNF, is known to suppress tumor formation in several cell types, we found that leukemia cells instead rely on Brg1 to support their oncogenic transcriptional program, which includes Myc as one of its key targets. To account for this context-specific function, we identify a cluster of lineage-specific enhancers located 1.7 Mb downstream from Myc that are occupied by SWI/SNF as well as the BET protein Brd4. Brg1 is required at these distal elements to maintain transcription factor occupancy and for long-range chromatin looping interactions with the Myc promoter. Notably, these distal Myc enhancers coincide with a region that is focally amplified in ∼3% of acute myeloid leukemias. Together, these findings define a leukemia maintenance function for SWI/SNF that is linked to enhancer-mediated gene regulation, providing general insights into how cancer cells exploit transcriptional coactivators to maintain oncogenic gene expression programs.

Keywords: Brd4; Brg1; Myc; SWI/SNF; enhancer; leukemia.


Figures

Figure 1.
Figure 1.
Brg1 and other SWI/SNF subunits are required for AML maintenance. (A) Competition assay to measure the effects of shRNAs on leukemia cell proliferation. The percentage of GFP+/shRNA+ RN2 cells was measured at the indicated time points. Percentages were normalized to day 2 values. shRen.713 is a negative control shRNA targeting Renilla luciferase. n = 3. (B,C) Conditional shRNA experiments performed in vivo. Clonal RN2-TRMPV-Neo lines were transplanted into sublethally irradiated recipient mice followed by administration of doxycycline (dox) at day 6. (B) Bioluminescent imaging of the luciferase+ leukemia burden at the indicated days following dox administration. (C) Kaplan-Meier survival curves. Nine to 10 mice were included in each shRNA group. Statistical significance was calculated using a log-rank test. (*) P < 0.001. (D) Cell cycle and Western blot analysis following dox-induced knockdown of Brg1 in RN2 and iMEF lines transduced with TRMPV-Neo shRNA constructs. shRNA was induced for 48 h with dox followed by BrdU incorporation assays and Western blotting of whole-cell lysates. n = 3. Western blot is a representative of three independent replicates. (E) Measurement of nonviable cells following conditional Brg1 knockdown. shRNA was induced for 72 h with dox. n = 3. (F) Western blotting of Brg1 levels in whole-cell lysates prepared from HeLa cells transduced with the indicated MLP-shRNA constructs. A representative experiment of three independent replicates is shown. (G) Competition assay in NOMO-1 cells (human MLL-AF9+ AML) using the indicated shRNA constructs, as described for A. n = 3. (H) Summary of competition assay data from RN2 cells for 93 independent shRNAs targeting the indicated SWI/SNF subunits. The average fold decrease in GFP percentage over 10 d for four to six independent shRNAs is plotted. Bars are labeled in red if more than two independent shRNAs decreased the percentage of GFP+ more than threefold. All error bars represent SEM.
Figure 2.
Figure 2.
Brg1 maintains an undifferentiated cell state in AML. (A) Light microscopy of May-Grunwald/Giemsa-stained RN2 cells transduced with the indicated TRMPV-Neo shRNA constructs. Cells were treated with dox for 3 d. Imaging was performed with a 40× objective. A representative image of three independent biological replicates is shown. (B,C) Flow cytometry analysis of c-kit (B) and Mac-1 (C) surface expression after 96 h of dox treatment. A representative experiment of three biological replicates is shown. (D,E) GSEA of LSC and macrophage development gene sets following Brg1 knockdown. Microarray analysis was performed comparing three independent Ren.713 shRNA RN2 lines with three independent Brg1 shRNA RN2 lines (4935, 3364, and 3232). The dox-inducible TRMPV-Neo vector was used. Dox treatment was for 96 h. (NES) Normalized enrichment score; (FDR),false discovery rate.
Figure 3.
Figure 3.
Brg1 maintains Myc and Hoxa9 expression and represses proapoptotic genes in AML. (A) Heat map of gene expression changes following Brg1 knockdown using microarray data described above. Each protein-coding gene represented on the array is ranked based on fold change in expression, with the position of select genes indicated by horizontal lines. Results are the average of three independent Brg1 shRNAs. (BD) GSEA following Brg1 knockdown, as described in Figure 2. (E) Time-course Western blotting of Myc and Brg1 levels in RN2 cells following dox treatment of TRMPV-Neo RN2 lines with the indicated shRNAs. shRNA expression was triggered by dox for the indicated amount of time before lysate preparation. (F) Western blotting following 48 h of dox-induced Brg1 knockdown performed in AML (RN2) cells that were pretransduced with either MSCV-em (empty) or MSCV-Myc vectors. A representative experiment of three biological replicates is shown. (G) BrdU cell cycle analysis performed on day 3 of dox treatment. n = 3. (H) Imaging of cell morphology of the same cells as described in F. All error bars represent SEM.
Figure 4.
Figure 4.
Intergenic occupancy of Brg1 and Brd4 1.7 Mb downstream from Myc coincides with a region of recurrent focal amplification in AML. (A) ChIP-seq occupancy profiles of Brg1, Brd4, H3K27ac, and H3K4me3 obtained in RN2 cells (in reads per million). Myc is transcribed from left to right in this depiction. Validated transcript models from the mm8 genome assembly are depicted below. (*) Noncoding RNAs. (B) ChIP-seq data in a window of ∼130 kb surrounding the E1–E5 regions. (C) The locations of somatic copy number amplifications identified on human chromosome 8 from prior studies are represented as solid red lines (Radtke et al. 2009; Kuhn et al. 2012). The labels indicate sample IDs used in the prior studies. Locations are depicted on the hg19 genome assembly.
Figure 5.
Figure 5.
E1–E5 elements are a lineage-specific cluster of enhancers occupied by Brg1. (AE) ChIP-qPCR with Brg1 or control IgG antibodies. PCR primer amplicons are indicated along the X-axis. Neg refers to a negative control region in a gene desert region, and −2 kb is relative to the Myc transcription start site. n = 3. AC represent murine cell lines and primer pairs. D and E represent human lines and primer pairs. (F) ChIP-seq profiles of H3K27ac from the indicated normal mouse tissues, obtained from Shen et al. (2012). The AML H3K27ac data were obtained from RN2 cells. (BM) Bone marrow; (BMDM) BM-derived macrophages; (SmInt) small intestine. (G) Enhancer reporter assay. The indicated PGL4.23 constructs were transfected into HEK293T or K562 cells for 48 h followed by measurement of luciferase activity. Results were normalized to the empty vector control. n = 3. (H) ChIP-seq profiles of TF occupancy performed in HPC-7 cells, obtained from Wilson et al. (2010). (IM) ChIP-qPCR with the indicated TFs or control IgG antibodies performed in RN2 cells. PCR primer amplicons are indicated along the X-axis. Neg refers to a negative control region in a gene desert region. n = 3. All error bars represent SEM.
Figure 6.
Figure 6.
E1–E5 enhancers make contact with Myc in leukemia cells. (A) 4C-seq analysis with the indicated anchor points. The Y-axis measures the normalized contact intensities, which plot the relative proximity of various DNA fragments in this region to the anchor-point fragment within the three-dimensional nuclear space. E1–E5 enhancers are at the location indicated. A representative experiment of two independent biological replicates is shown. (B) 3C-qPCR analysis of the interaction frequency of the indicated restriction fragments with an anchor point fixed near the MYC gene. All PCR signals were normalized to digested/religated bacterial artificial chromosome (BAC) templates. The gray boxes highlight the regions containing the E1–E5 enhancer elements. n = 3–5. Error bars represent SEM.
Figure 7.
Figure 7.
Brg1 is required for enhancer–promoter proximity and occupancy of hematopoietic TFs at E1–E5. (A) 3C-qPCR analysis of the interaction frequency of the indicated restriction fragments with an anchor point fixed at the MYC gene. All PCR signals were normalized to digested/religated BAC templates. The green boxes highlight the regions containing the E1–E5 elements. The experiment was performed in NOMO-1 following 7 d of dox treatment to induce shRNA expression. n = 3–4. (BI) ChIP-qPCR analysis performed in RN2 cells following conditional Brg1 knockdown. RN2 clones transduced with TRMPV-Neo Brg1 shRNA constructs were treated with dox for 48 h. PCR primer amplicons are indicated along the X-axis. Neg refers to a negative control region found at a gene desert region. n = 3. (J) The effect of retroviral overexpression of Brg1 mutants (dominant negatives) on RN2 cell proliferation. Wild-type or mutant Brg1 cDNAs were expressed from an MSCV-IRES-GFP vector. The relative change in GFP percentage over time was used to infer relative proliferation rates. n = 2–3. All error bars represent SEM.

References

    1. Bakshi R, Hassan MQ, Pratap J, Lian JB, Montecino MA, van Wijnen AJ, Stein JL, Imbalzano AN, Stein GS 2010. The human SWI/SNF complex associates with RUNX1 to control transcription of hematopoietic target genes. J Cell Physiol 225: 569–576 - PMC - PubMed
    1. Bernt KM, Zhu N, Sinha AU, Vempati S, Faber J, Krivtsov AV, Feng Z, Punt N, Daigle A, Bullinger L, et al. 2011. MLL-rearranged leukemia is dependent on aberrant H3K79 methylation by DOT1L. Cancer Cell 20: 66–78 - PMC - PubMed
    1. Boyer LA, Plath K, Zeitlinger J, Brambrink T, Medeiros LA, Lee TI, Levine SS, Wernig M, Tajonar A, Ray MK, et al. 2006. Polycomb complexes repress developmental regulators in murine embryonic stem cells. Nature 441: 349–353 - PubMed
    1. Bultman SJ, Gebuhr TC, Magnuson T 2005. A Brg1 mutation that uncouples ATPase activity from chromatin remodeling reveals an essential role for SWI/SNF-related complexes in β-globin expression and erythroid development. Genes Dev 19: 2849–2861 - PMC - PubMed
    1. The Cancer Genome Atlas Research Network 2013. Genomic and epigenomic landscapes of adult de novo acute myeloid leukemia. N Engl J Med 368: 2059–2074 - PMC - PubMed

Publication types

MeSH terms