. 2014 Feb 1;74(3):908-20.
doi: 10.1158/0008-5472.CAN-13-2034. Epub 2013 Nov 27.

Blocking lactate export by inhibiting the Myc target MCT1 Disables glycolysis and glutathione synthesis

Affiliations

Blocking lactate export by inhibiting the Myc target MCT1 Disables glycolysis and glutathione synthesis

Joanne R Doherty et al. Cancer Res. .

Abstract

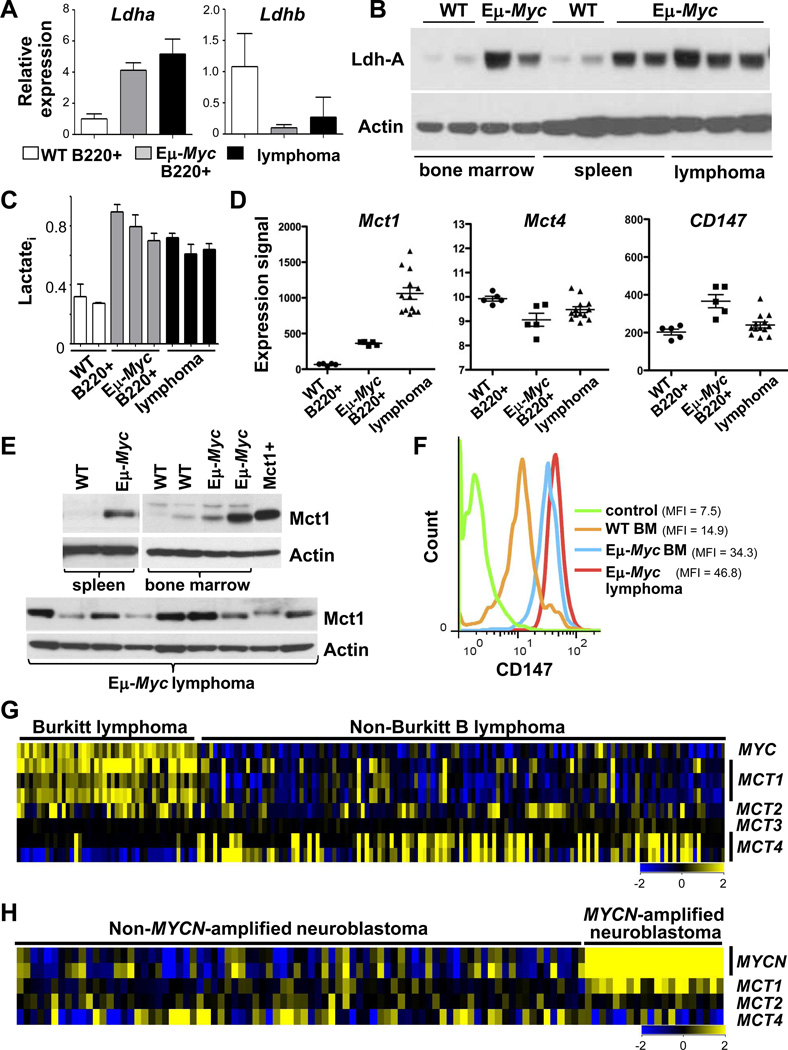
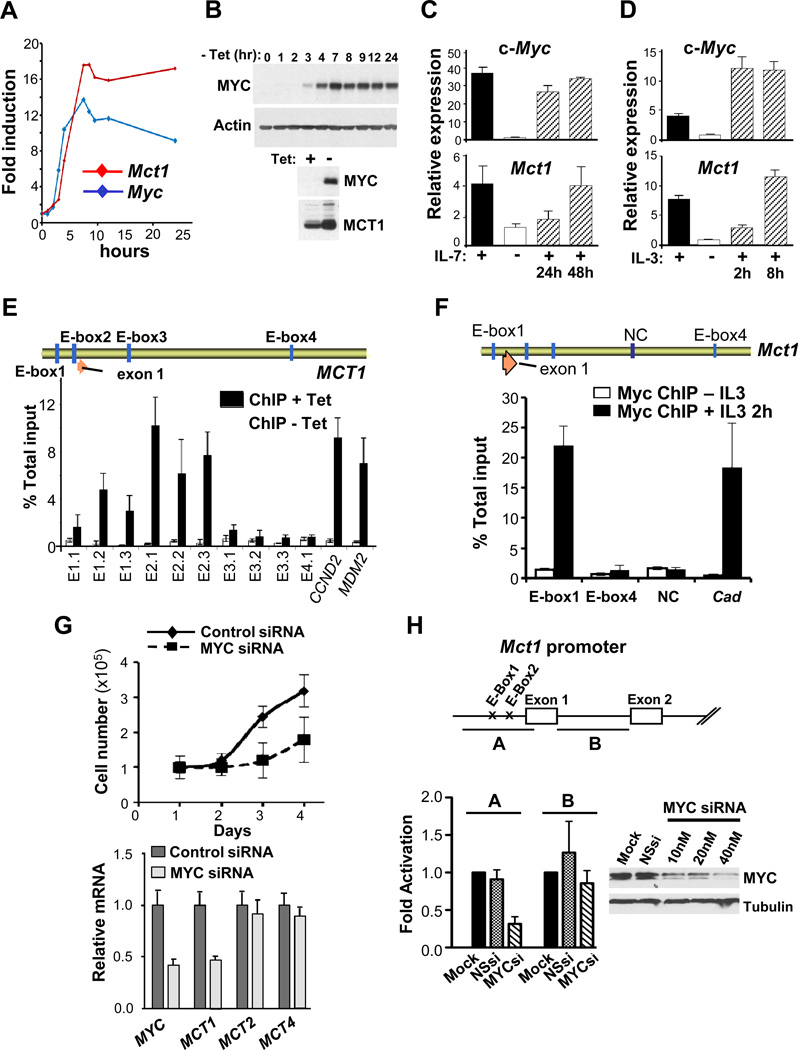
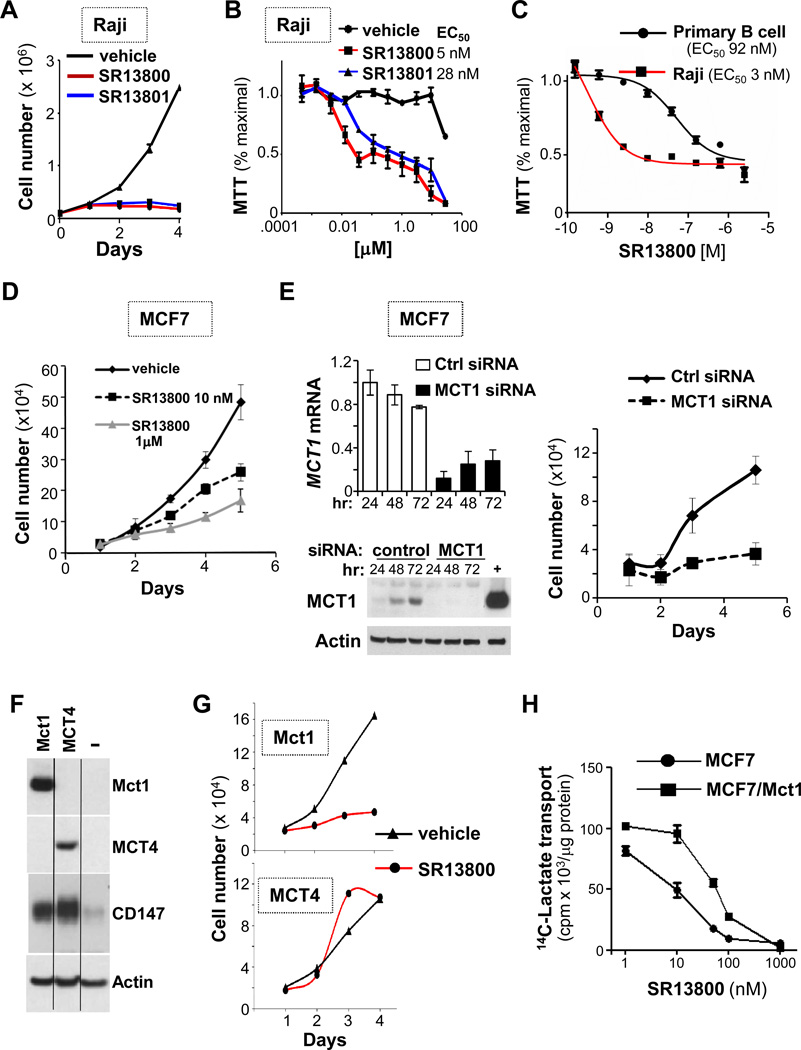
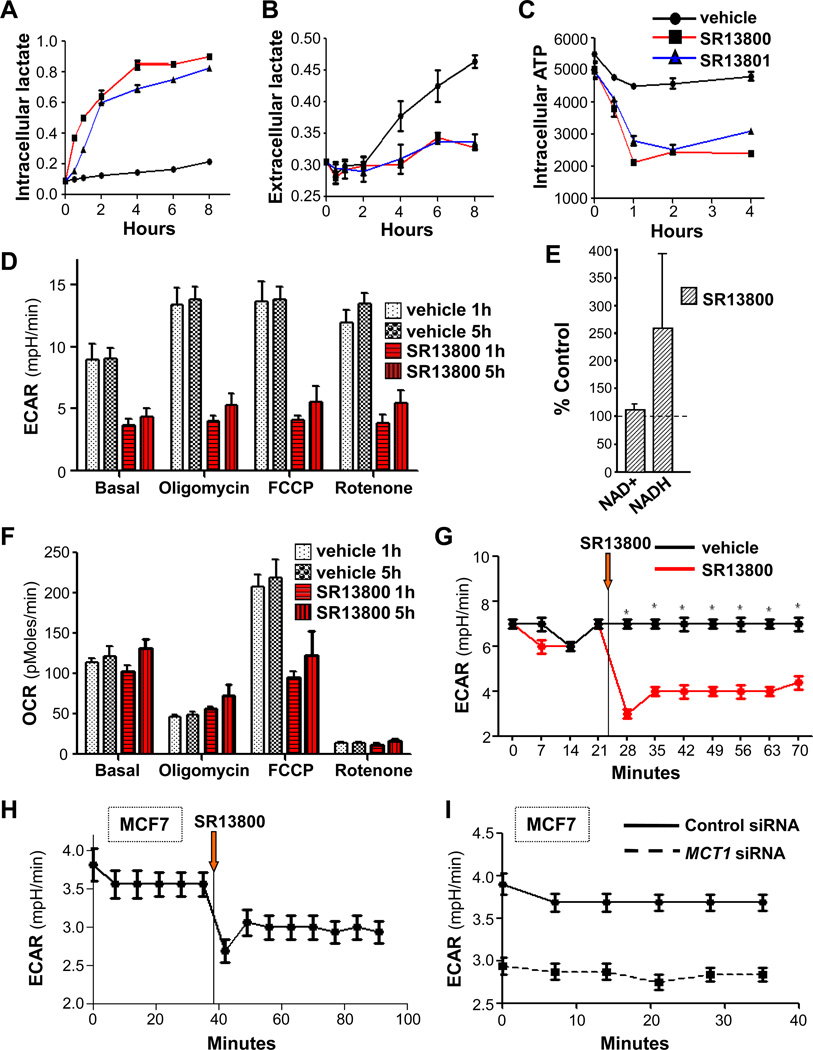
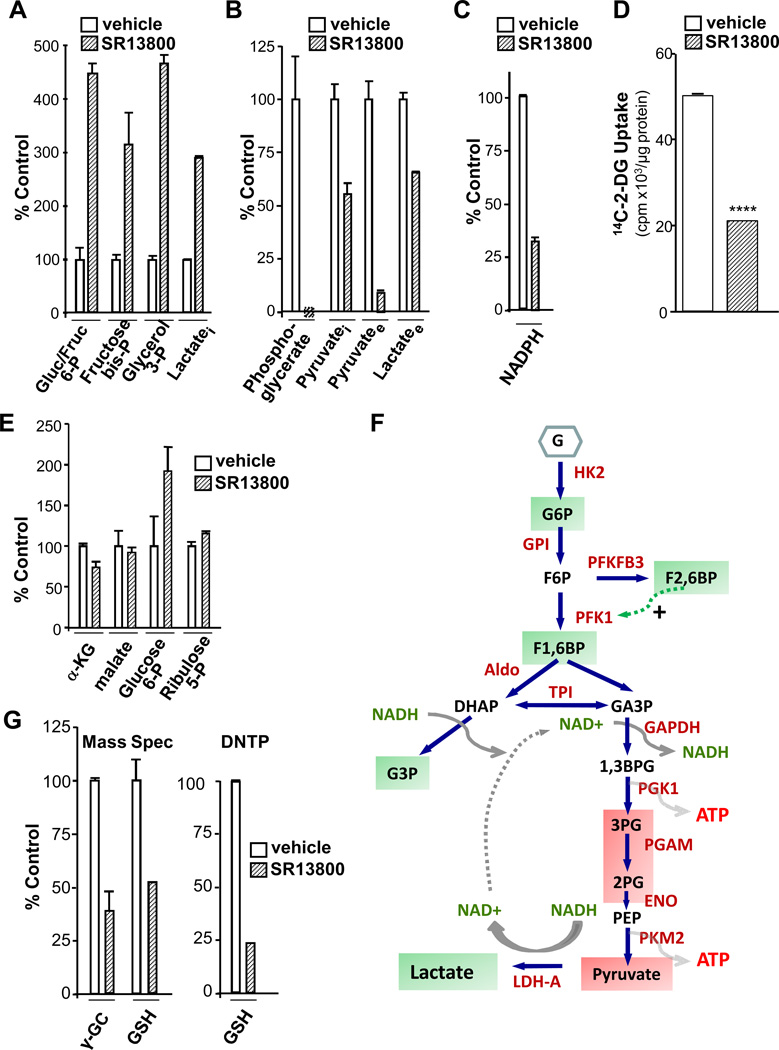
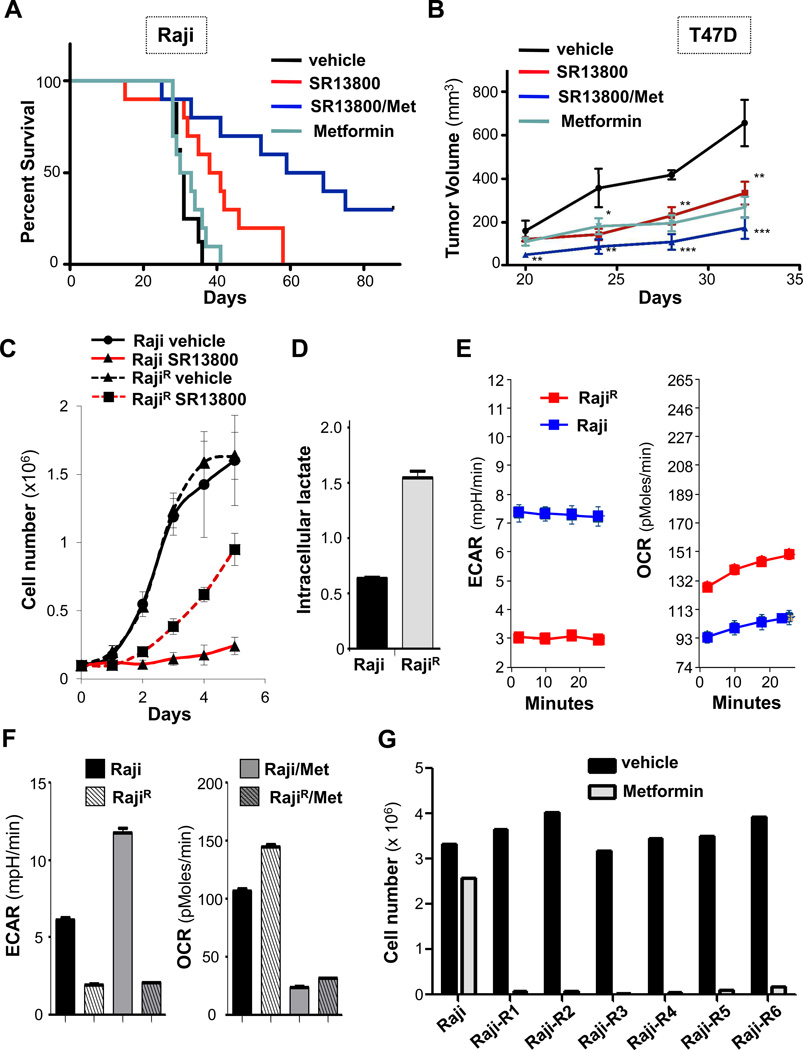
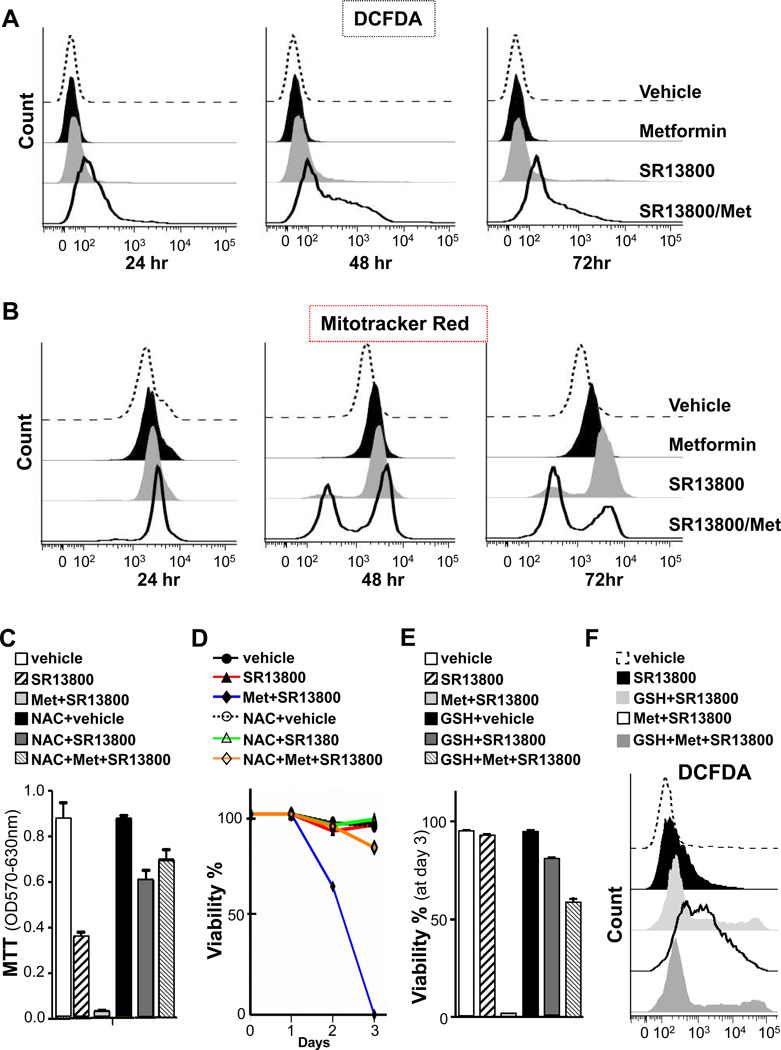
Myc oncoproteins induce genes driving aerobic glycolysis, including lactate dehydrogenase-A that generates lactate. Here, we report that Myc controls transcription of the lactate transporter SLC16A1/MCT1 and that elevated MCT1 levels are manifest in premalignant and neoplastic Eμ-Myc transgenic B cells and in human malignancies with MYC or MYCN involvement. Notably, disrupting MCT1 function leads to an accumulation of intracellular lactate that rapidly disables tumor cell growth and glycolysis, provoking marked alterations in glycolytic intermediates, reductions in glucose transport, and in levels of ATP, NADPH, and ultimately, glutathione (GSH). Reductions in GSH then lead to increases in hydrogen peroxide, mitochondrial damage, and ultimately, cell death. Finally, forcing glycolysis by metformin treatment augments this response and the efficacy of MCT1 inhibitors, suggesting an attractive combination therapy for MYC/MCT1-expressing malignancies.


Conflict of interest statement

Disclosure of Potential Conflicts of Interest: The authors declare that they have no potential conflicts of interest.

Figures

Figure 1
Figure 1
Myc augments lactate production and MCT1 expression. A–F, B220+ B cells isolated from bone marrow (BM) or spleen of 4–6 week old wild type (WT) or premalignant Eμ-Myc littermates or from Eμ-Myc lymphoma were analyzed: A, by qRT-PCR for Ldh-A (left) or Ldh-B (right) expression (WT BM, n = 2; premalignant Eμ-Myc,n = 2; lymphoma, n = 3; error bars are SD); B, for Ldh-A protein levels; C, intracellular lactate (Lactatei) (triplicate assays); D, by expression profiling analysis of Mct1, Mct4 and CD147 mRNA (circles, WT splenic B cells, n = 5; squares, premalignant Eμ-Myc, n = 5; triangles, lymphoma, n = 13) (significant differences in mean Mct1 levels in premalignant (p < 0.00002) and neoplastic (p < 0.000002) Eμ-Myc B cells versus WT B cells); E, for MCT1 protein levels (Mct1+, lysate from 293T cells expressing MCT1); and F, by flow cytometry for CD147 levels on B220+ BM B cells from WT (orange line) and premalignant Eμ-Myc (blue line) littermates, and of Eμ-Myc lymphoma (red line). MFI, mean fluorescence intensity. G, Gene expression profiling of MYC, MCT1, MCT2, MCT3 and MCT4 in human BL (n = 44) and non-BL (n = 129, from GSE4475, ref. 33). H, MCT1 expression in primary human MYCN-amplified neuroblastoma (n = 20) versus non-MYCN-amplified neuroblastoma (n = 81, from GSE3960, ref. 34).
Figure 2
Figure 2
MCT1 is a Myc transcription target. A, human P493-6 B lymphoma cells bearing a Tet-repressible c-Myc transgene were cultured for 72 hr in Tet (1µg/ml, Myc-Off), washed and cultured in medium lacking Tet (Myc-On) and assessed for MYC and MCT1 mRNA levels by qRT-PCR. B, Top, c-Myc protein levels at the indicated intervals following withdrawal of Tet from P493-6 cells. Bottom, MCT1 protein levels 24 hr after removal (−) of Tet. C and D, Primary BM-derived mouse pre-B cells grown in IL7 (C) and mouse 32D.3 myeloid cells grown in IL3 (D) were deprived of ligand for 16 hr and then re-stimulated with IL7 or IL3. Levels of c-Myc and Mct1 transcripts were determined by qRT-PCR (n = 3). Expression is relative to Ub. E, Top, schematic of human SLC16A1/MCT1. Vertical blue bars indicate four E-box (CACGTG) sequences and orange arrow indicates exon 1. Bottom, P493-6 cells cultured for 72 hr with Tet (white bars, Myc-Off) then washed and cultured for 8 hr without Tet (black bars, Myc-On) was chromatin immunoprecipitated with c-Myc antibody. Designated E-boxes and controls (cyclin D2 [CCND2] and MDM2) were amplified by qRT-PCR and compared to total input. F, Top, schematic of mouse Slc16a1/Mct1. Vertical blue bars denote four E-box sequences in the mouse Mct1 gene and an intronic region (NC) used as a control for ChIP analyses. Orange arrow indicates exon 1. Bottom, 32D.3 cells cultured without IL3 for 16 hr (white bars) and then stimulated with IL3 for 2 hr (black bars) were chromatin immunoprecipitated with c-Myc antibody. Mouse Cad was amplified as a positive control for c-Myc binding. G, MCF7 cells were transfected with control siRNA or c-MYC-specific siRNA. Top, cells were counted daily (n = 3). Bottom, 48 hr after transfection cells were harvested for qRT-PCR analyses. H, Top, mouse Mct1 promoter regions used to generate firefly luciferase reporters. Bottom left, fold activation of Mct1 promoter-reporters in HEK 293T cells transfected with 40 nM scambled siRNA (NSsi) or MYC-specific siRNA (MYCsi) relative to mock-transfected cells (n=3, in quadruplicate). Bottom right, c-MYC protein knockdown in HEK293T cells.
Figure 3
Figure 3
MCT1 inhibition blocks tumor cell proliferation. A, 1 × 10⁵ Raji cells/ml were treated with vehicle (black line), 100 nM SR13800 (red line) or SR13801 (blue line) and counted at the indicated times (n = 3, representative of three experiments). B, Raji cells were treated with indicated doses of SR13800 or SR13801 for 3 days and assayed by MTT (n = 3). C, MTT assay of Raji cells or primary mouse B cells treated with SR13800 for 3 days (n = 3). D, 1 × 10⁵ MCF7 cells treated with vehicle (black line), or 10 nM (dashed black line) or 1 µM SR13800 (gray line) and cell numbers were counted at the indicated times (n = 3, representative of two experiments). E, siRNA knockdown of MCT1 mRNA (top left) and MCT1 protein (bottom left) in MCF7 cells. “+”control lysate from 293T cells expressing Mct1. Right, cells transfected with control siRNA (black line) or MCT1 siRNA (dashed line) and counted (n = 3, representative of three experiments). F, MCF7 cells engineered to overexpress mouse Mct1 or human MCT4 were assessed for expression of MCT1, MCT4 and CD147 proteins. G, MCF7 cells overexpressing MCT1 or MCT4 were treated with vehicle (black lines) or SR13800 (1 µM, red lines) and cell number was determined daily (n = 3, representative of two experiments). H, 14C lactate transport in MCF7 cells overexpressing MCT1 and treated with indicated doses of SR13800 (10 minutes). (n = 4, representative of three experiments).
Figure 4
Figure 4
MCT1 inhibition derails lactate homeostasis and cancer cell metabolism. A–C, cells treated with vehicle (black lines) or 100 nM of SR13800 (red lines) or SR13801 (blue lines) and levels of intracellular (A) and extracellular (B) lactate, and of intracellular ATP (C), were determined (n = 3, representative of three experiments). D, ECAR and F, OCR, in Raji cells treated for 1 or 5 hr with vehicle or SR13800 (1 µM). Effects of addition of oligomycin, FCCP or rotenone are also shown (n = 6). E, Raji cells were treated for 8 hr with SR13800 (100 nM) or vehicle and levels of NAD+ and NADH (n = 3) were determined. Levels are shown relative to those of vehicle treated cells (dashed line). G, ECAR in Raji BL cells treated with vehicle (black line) or SR13800 (red line) at time indicated (orange arrow) (n = 6, representative of four experiments). H, ECAR in MCF7 cells treated with SR13800 at time indicated (orange arrow) (n = 6, representative of three experiments). I, ECAR in control and MCT1 siRNA transfected MCF7 cells (n = 6).
Figure 5
Figure 5
MCT1 inhibition impairs glucose transport and glycolysis, and reduces glutathione pools. A–C, Raji cells were treated for 8 hr with SR13800 (100 nM) or vehicle and levels of glycolytic metabolites were determined by (A, B) mass spectrometry (n = 6, representative of four experiments) and (C) levels of NADPH were determined by NADP/NADPH Quantification Kit (BioVision) (n=3). D, Uptake of 14C-2-deoxyglucose (14C-2-DG), (0.5 µCi for 1 hr in quadruplicate) in Raji cells pre-treated with vehicle or SR13800 (100 nM). (****, p <0.0001, representative of three experiments). E, Levels of pentose phosphate pathway and TCA cycle products from Raji cells treated for 8 hr with SR13800 (100 nM) or vehicle were assessed by mass spectrometry (n = 6). F, summary of effects of inhibition of lactate transport on glycolytic intermediates. Green boxes indicate accumulations and red boxes reductions of intermediates. G, Left, mass spectrometry of γ-GC and GSH levels from Raji cells treated with SR13800 (100 nM) for 8 hr (n = 6, representative of three experiments). Right, total GSH (GSH plus GSSG) levels in Raji cells assayed by DNTP (n = 3, representative of three experiments).
Figure 6
Figure 6
Metformin augments the anti-tumor activity of MCT1 inhibitors and overcomes resistance due to shifts to OXPHOS. A, Survival of NOD/SCID mice transplanted with Raji lymphoma. At day 3 mice were treated with water or water with 5 mg/kg metformin and daily injections of vehicle or 30 mg/kg SR13800. Median survival: vehicle (n=8), 30 days; metformin (n=10), 31 days; SR13800 (n=10), 39 days (p = 0.016); SR13800 + metformin (n=10), 64 days (p = 0.005). B, Tumor volumes measured with calipers in NOD/SCID mice injected sub-Q with T47D cells and treated as in (A). At day 32 there were significant differences in tumor volume for vehicle (n = 5) versus SR13800 (n = 9, p = 0.01), metformin (n = 8, p = 0.002) and SR13800/metformin (n = 10, p = 0.0005) cohorts. C, Parental Raji and SR13800-resistant Raji (RajiR) cells were treated with vehicle or 100 nM SR13800 and cell numbers determined (n = 4, representative of two experiments). D, levels of intracellular lactate in Raji and RajiR cells in normal growth medium (n = 3, representative of two experiments). E, ECAR (left) and OCR (right) measurements of Raji (blue lines) and RajiR cells (red lines) (n = 6, representative of two experiments). F, parental Raji and RajiR cells were assessed for ECAR and OCR +/− metformin (1 mM) for 16 hr (n = 6, representative of two experiments). Cell number of Raji or RajiR cells treated with vehicle (black bars) or metformin (1 mM, gray bars) for 24h (representative of two experiments).
Figure 7
Figure 7
MCT1 Inhibitor/metformin combination triggers increases in hydrogen peroxide, mitochondrial damage and cell death that is blocked by glutathione. Raji cells were treated with vehicle, SR13800 (1 µM), metformin (1 mM) or SR13800 plus metformin for the indicated times and analyzed by flow cytometry for: A, DCFDA; and B, Mitotracker Red stain (representative of three experiments). C–F, NAC (C, D) and GSH (E, F) override the anti-cancer effects of SR13800 +/− metformin. Raji cells were pretreated with or without NAC (10 mM) or glutathione ester (3 mM [D] or 5 mM [E, F]) for 1 hr and then treated with vehicle or SR13800 (100 nM [C–E] or 1 µM [F]) +/− metformin (1 mM). C, MTT assays after 3 days (n = 3). D, E, Cell survival by trypan blue dye exclusion (n = 3). F, DCFDA fluorescence after 24 hr of treatment (n = 3).

References

    1. Gardner L, Lee L, Dang C. The c-Myc Oncogenic Transcription Factor. The Encyclopedia of Cancer, Second Edition. 2002:555–561.
    1. Adams JM, Harris AW, Pinkert CA, Corcoran LM, Alexander WS, Cory S, et al. The c-myc oncogene driven by immunoglobulin enhancers induces lymphoid malignancy in transgenic mice. Nature. 1985;318:533–538. - PubMed
    1. Jain M, Arvanitis C, Chu K, Dewey W, Leonhardt E, Trinh M, et al. Sustained loss of a neoplastic phenotype by brief inactivation of MYC. Science. 2002;297:102–104. - PubMed
    1. Shachaf CM, Kopelman AM, Arvanitis C, Karlsson A, Beer S, Mandl S, et al. MYC inactivation uncovers pluripotent differentiation and tumour dormancy in hepatocellular cancer. Nature. 2004;431:1112–1117. - PubMed
    1. Ji H, Wu G, Zhan X, Nolan A, Koh C, De Marzo A, et al. Cell-type independent MYC target genes reveal a primordial signature involved in biomass accumulation. PLoS One. 2011;6e:26057. - PMC - PubMed

Publication types

MeSH terms