

Induced pluripotent stem cell modeling of multisystemic, hereditary transthyretin amyloidosis
- PMID: 24286032
- PMCID: PMC3841264
- DOI: 10.1016/j.stemcr.2013.10.003
Induced pluripotent stem cell modeling of multisystemic, hereditary transthyretin amyloidosis
Abstract
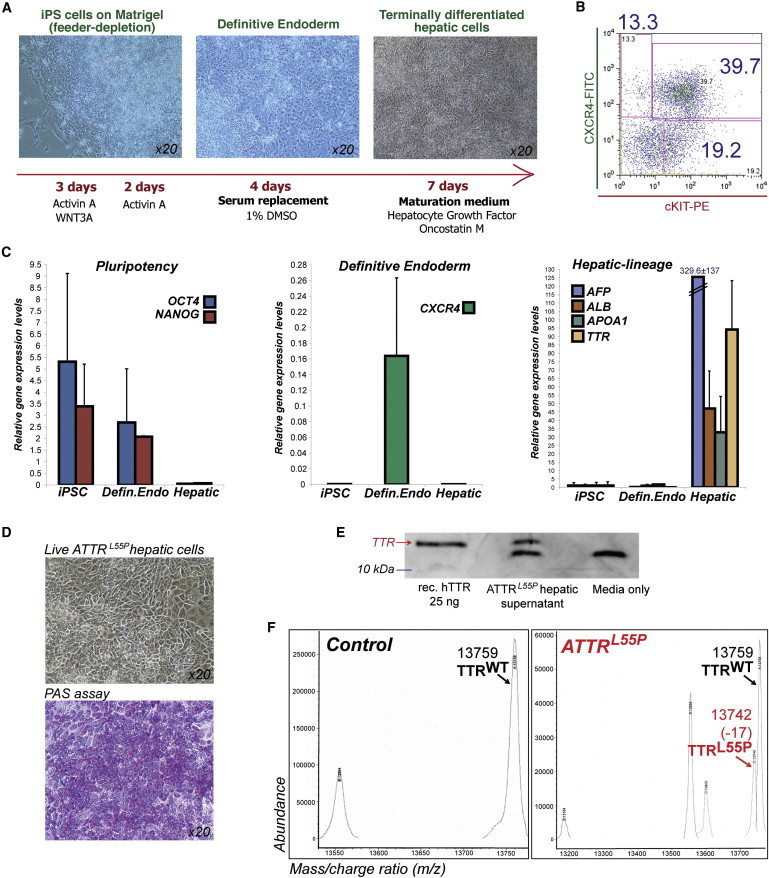
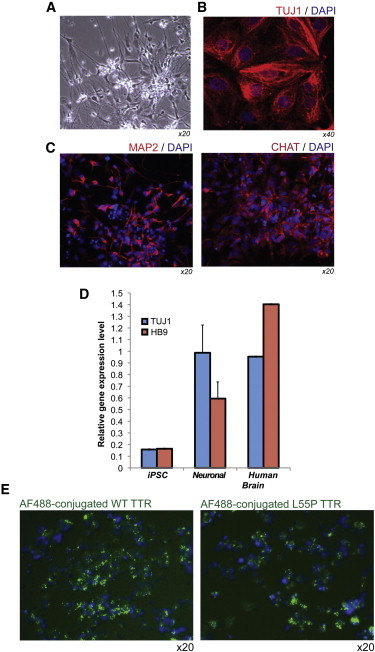
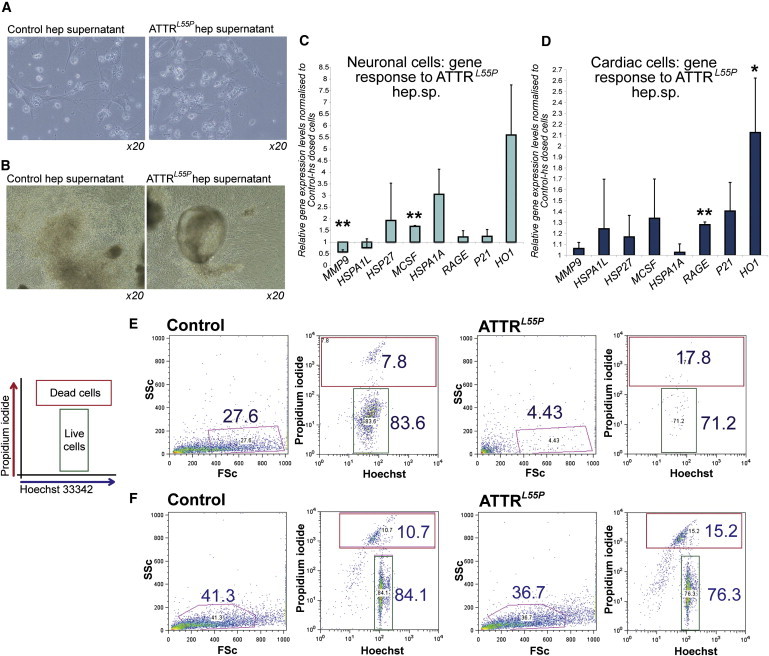
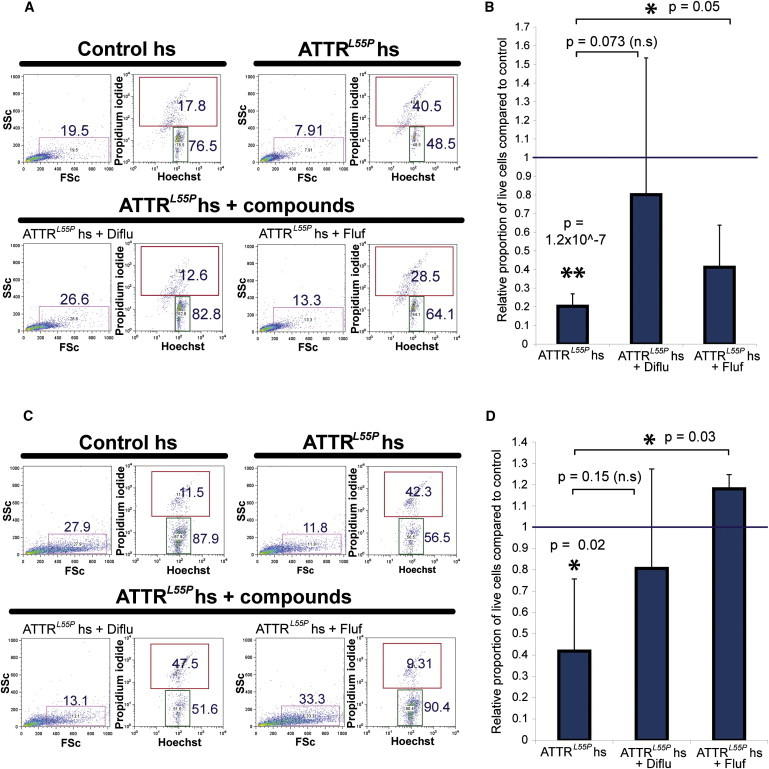
Familial transthyretin amyloidosis (ATTR) is an autosomal-dominant protein-folding disorder caused by over 100 distinct mutations in the transthyretin (TTR) gene. In ATTR, protein secreted from the liver aggregates and forms fibrils in target organs, chiefly the heart and peripheral nervous system, highlighting the need for a model capable of recapitulating the multisystem complexity of this clinically variable disease. Here, we describe the directed differentiation of ATTR patient-specific iPSCs into hepatocytes that produce mutant TTR, and the cardiomyocytes and neurons normally targeted in the disease. We demonstrate that iPSC-derived neuronal and cardiac cells display oxidative stress and an increased level of cell death when exposed to mutant TTR produced by the patient-matched iPSC-derived hepatocytes, recapitulating essential aspects of the disease in vitro. Furthermore, small molecule stabilizers of TTR show efficacy in this model, validating this iPSC-based, patient-specific in vitro system as a platform for testing therapeutic strategies.
Figures


Similar articles
-
Multisystemic Disease Modeling of Liver-Derived Protein Folding Disorders Using Induced Pluripotent Stem Cells (iPSCs).Methods Mol Biol. 2016;1353:261-70. doi: 10.1007/7651_2014_194. Methods Mol Biol. 2016. PMID: 25646614
-
A library of ATTR amyloidosis patient-specific induced pluripotent stem cells for disease modelling and in vitro testing of novel therapeutics.Amyloid. 2018 Sep;25(3):148-155. doi: 10.1080/13506129.2018.1489228. Epub 2018 Jul 21. Amyloid. 2018. PMID: 30032658 Free PMC article.
-
Generation of two induced pluripotent stem cell lines from hereditary amyloidosis patients with polyneuropathy carrying heterozygous transthyretin (TTR) mutation.Stem Cell Res. 2024 Feb;74:103265. doi: 10.1016/j.scr.2023.103265. Epub 2023 Nov 29. Stem Cell Res. 2024. PMID: 38100909 Free PMC article.
-
Transthyretin (ATTR) amyloidosis: clinical spectrum, molecular pathogenesis and disease-modifying treatments.J Neurol Neurosurg Psychiatry. 2015 Sep;86(9):1036-43. doi: 10.1136/jnnp-2014-308724. Epub 2015 Jan 20. J Neurol Neurosurg Psychiatry. 2015. PMID: 25604431 Review.
-
Liver transplantation in transthyretin amyloidosis: issues and challenges.Liver Transpl. 2015 Mar;21(3):282-92. doi: 10.1002/lt.24058. Epub 2015 Feb 2. Liver Transpl. 2015. PMID: 25482846 Review.
Cited by
-
Modeling Nonischemic Genetic Cardiomyopathies Using Induced Pluripotent Stem Cells.Curr Cardiol Rep. 2022 Jun;24(6):631-644. doi: 10.1007/s11886-022-01683-8. Epub 2022 Jun 3. Curr Cardiol Rep. 2022. PMID: 35657495 Free PMC article. Review.
-
The Evolution of Stem Cells, Disease Modeling, and Drug Discovery for Neurological Disorders.Stem Cells Dev. 2020 Sep 1;29(17):1131-1141. doi: 10.1089/scd.2019.0217. Epub 2020 May 6. Stem Cells Dev. 2020. PMID: 32024446 Free PMC article. Review.
-
Pluripotent stem cells in disease modelling and drug discovery.Nat Rev Mol Cell Biol. 2016 Mar;17(3):170-82. doi: 10.1038/nrm.2015.27. Epub 2016 Jan 28. Nat Rev Mol Cell Biol. 2016. PMID: 26818440 Review.
-
A Paracrine Mechanism Accelerating Expansion of Human Induced Pluripotent Stem Cell-Derived Hepatic Progenitor-Like Cells.Stem Cells Dev. 2015 Jul 15;24(14):1691-702. doi: 10.1089/scd.2014.0479. Epub 2015 Apr 28. Stem Cells Dev. 2015. PMID: 25808356 Free PMC article.
-
Evaluation of Therapeutic Oligonucleotides for Familial Amyloid Polyneuropathy in Patient-Derived Hepatocyte-Like Cells.PLoS One. 2016 Sep 1;11(9):e0161455. doi: 10.1371/journal.pone.0161455. eCollection 2016. PLoS One. 2016. PMID: 27584576 Free PMC article.
References
-
- Ackermann E.J., Guo S., Booten S., Alvarado L., Benson M., Hughes S., Monia B.P. Clinical development of an antisense therapy for the treatment of transthyretin-associated polyneuropathy. Amyloid. 2012;19(Suppl 1):43–44. - PubMed
-
- Ando Y., Nakamura M., Araki S. Transthyretin-related familial amyloidotic polyneuropathy. Arch. Neurol. 2005;62:1057–1062. - PubMed
-
- Araki S., Yi S., Murakami T., Watanabe S., Ikegawa S., Takahashi K., Yamarnura K. Systemic amyloidosis in transgenic mice carrying the human mutant transthyretin (Met 30) gene. Pathological and immunohistochemical similarity to human familial amyloidotic polyneuropathy, type I. Mol. Neurobiol. 1994;8:15–23. - PubMed
-
- Benson M.D., Teague S.D., Kovacs R., Feigenbaum H., Jung J., Kincaid J.C. Rate of progression of transthyretin amyloidosis. Am. J. Cardiol. 2011;108:285–289. - PubMed
Publication types
MeSH terms
Substances
Supplementary concepts
Grants and funding
LinkOut - more resources
Full Text Sources
Other Literature Sources
Research Materials
Miscellaneous
