. 2014 Mar;1840(3):951-7.
doi: 10.1016/j.bbagen.2013.11.018. Epub 2013 Nov 25.

Genetically encoded fluorescent indicator for imaging NAD(+)/NADH ratio changes in different cellular compartments

Affiliations

Genetically encoded fluorescent indicator for imaging NAD(+)/NADH ratio changes in different cellular compartments

Dmitry S Bilan et al. Biochim Biophys Acta. 2014 Mar.

Abstract

Background: The ratio of NAD(+)/NADH is a key indicator that reflects the overall redox state of the cells. Until recently, there were no methods for real time NAD(+)/NADH monitoring in living cells. Genetically encoded fluorescent probes for NAD(+)/NADH are fundamentally new approach for studying the NAD(+)/NADH dynamics.

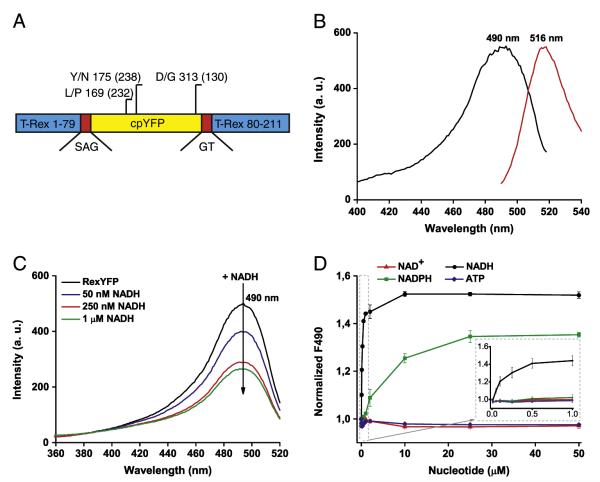
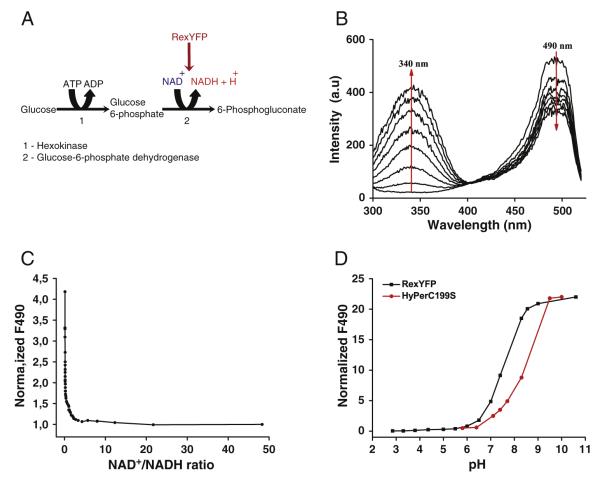
Methods: We developed a genetically encoded probe for the nicotinamide adenine dinucleotide, NAD(H), redox state changes by inserting circularly permuted YFP into redox sensor T-REX from Thermus aquaticus. We characterized the sensor in vitro using spectrofluorometry and in cultured mammalian cells using confocal fluorescent microscopy.

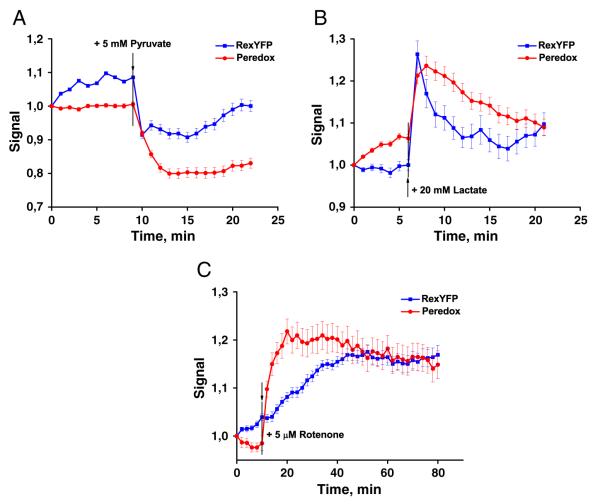
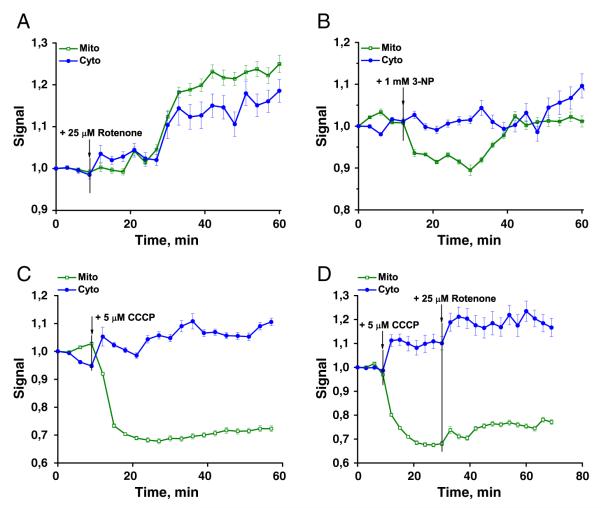
Results: The sensor, named RexYFP, reports changes in the NAD(+)/NADH ratio in different compartments of living cells. Using RexYFP, we were able to track changes in NAD(+)/NADH in cytoplasm and mitochondrial matrix of cells under a variety of conditions. The affinity of the probe enables comparison of NAD(+)/NADH in compartments with low (cytoplasm) and high (mitochondria) NADH concentration. We developed a method of eliminating pH-driven artifacts by normalizing the signal to the signal of the pH sensor with the same chromophore.

Conclusion: RexYFP is suitable for detecting the NAD(H) redox state in different cellular compartments.

General significance: RexYFP has several advantages over existing NAD(+)/NADH sensors such as smallest size and optimal affinity for different compartments. Our results show that normalizing the signal of the sensor to the pH changes is a good strategy for overcoming pH-induced artifacts in imaging.

Keywords: Fluorescent probe; NAD(+)/NADH ratio; Redox sensor.


Figures

Fig. 1
Fig. 1
A) Diagram of the RexYFP structure. RexYFP consists of cpYFP (yellow) integrated between residues 79 and 80 of T-Rex (blue) via short polypeptide linkers SAG and GT (red). The diagram shows mutations in the structure of RexYFP (numbers in parentheses indicate the position for EYFP). B) Fluorescence spectra of RexYFP. Excitation spectrum has a maximum at 490 nm. Emission spectrum has a maximum at 516 nm. C) Excitation spectrum of RexYFP (250 nM) in Tris–HCl (pH 7.5) with 150 mM NaCl and 10 mM MgCl2 upon addition of NADH (50, 250, 1000 nM) to the probe. Emission was measured at 530 nm. D) Dependence of RexYFP signal on concentrations of various nucleotides (NAD+, NADH, NADPH, ATP) in range of concentration from 10 nM to 50 μM in the probe (Tris–HCl (pH 7.5), 150 mM NaCl, 10 mM MgCl2). The RexYFP signal is expressed as 1/F490. Plotted line for each type of nucleotide is the result of five independent experiments.
Fig. 2
Fig. 2
A) The scheme of a coupled enzymatic system used to determine the dependence of the RexYFP signal on the NAD+/NADH ratio. B) Dynamics of changes in the excitation spectrum of the sample containing RexYFP and components of running coupled system. C) Dependence of the RexYFP signal from the NAD+/NADH ratio. Values of the RexYFP signal and the NAD+/ NADH ratio were calculated from the excitation spectra, which were detected in the sample containing RexYFP and components of the coupled system every 30 s, (3 experiments). D) The pH dependence of the fluorescence intensity (F490) of cpYFP chromophore in HyPer-C199S (red line) and RexYFP (black line), (2 experiments).
Fig. 3
Fig. 3
Responses of RexYFP (blue line) and Peredox (red line) to the addition of A) 5 mM pyruvate B) 20 mM lactate. HEK293 cells transiently expressing the sensors were imaging in presence of glucose (2 g/L). Peredox signal is calculated as F405/F561; RexYFP as F490HyPer-C199S/F490RexYFP. Signal values of RexYFP and Peredox were normalized to the initial value. Signals were averaged from 55 cells for RexYFP and 38 cells for Peredox in 3 experiments with pyruvate; from 36 cells for RexYFP and 50 cells for Peredox in 3 experiments with lactate. Error bars indicate standard error of mean. C) RexYFP (blue line) and Peredox (red line) responses in the cytoplasm of HeLa cells incubated with 5 μM rotenone. Signals were averaged from 43 cells for RexYFP and 57 cells for Peredox in 3 experiments; error bars indicate standard error of mean.
Fig. 4
Fig. 4
RexYFP signal (F490HyPer-C199S/F490RexYFP normalized to the initial value) in the cytoplasm (blue line) and in the mitochondria (green line) of HeLa cells after addition of A) 25 μM rotenone (signals were averaged from 36 cells with mito-localization of the sensor and 48 cells with cyto- in 3 experiments); B) 1 mM 3-NP (from 62 cells with mito- and 57 cells with cyto- in 4 experiments); C) 5 μM CCCP (from 38 cells with mito- and 49 cells with cyto- in 3 experiments); D) 5 μM CCCP with subsequent addition of 25 μM rotenone (from 42 cells with mito- and 37 cells with cyto- in 3 experiments). Error bars indicate standard error of mean.

References

    1. Veech RL, Eggleston LV, Krebs HA. The redox state of free nicotinamide-adenine di-nucleotide phosphate in the cytoplasm of rat liver. Biochem. J. 1969;115:609–619. - PMC - PubMed
    1. Stubbs M, Veech RL, Krebs HA. Control of the redox state of the nicotinamide-adenine dinucleotide couple in rat liver cytoplasm. Biochem. J. 1972;126:59–65. - PMC - PubMed
    1. Ying W. NAD+ and NADH in cellular functions and cell death. Front. Biosci. 2006;11:3129–3148. - PubMed
    1. Alano CC, Ying W, Swanson RA. Poly(ADP-ribose) polymerase-1-mediated cell death in astrocytes requires NAD+ depletion and mitochondrial permeability transition. J. Biol. Chem. 2004;279:18895–18902. - PubMed
    1. Alano CC, Garnier P, Ying W, Higashi Y, Kauppinen TM, Swanson RA. NAD+ depletion is necessary and sufficient for poly(ADP-ribose) polymerase-1-mediated neuronal death. J. Neurosci. 2010;30:2967–2978. - PMC - PubMed

Publication types