. 2013 Nov 25;27(4):438-51.
doi: 10.1016/j.devcel.2013.10.002.

Loss of dE2F compromises mitochondrial function

Affiliations

Loss of dE2F compromises mitochondrial function

Aaron M Ambrus et al. Dev Cell. .

Abstract

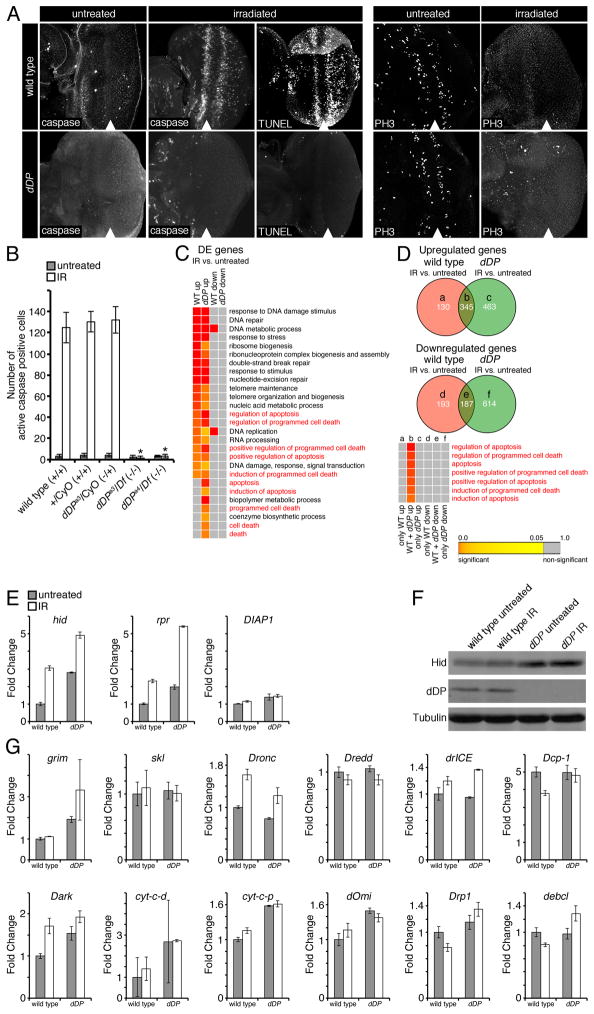
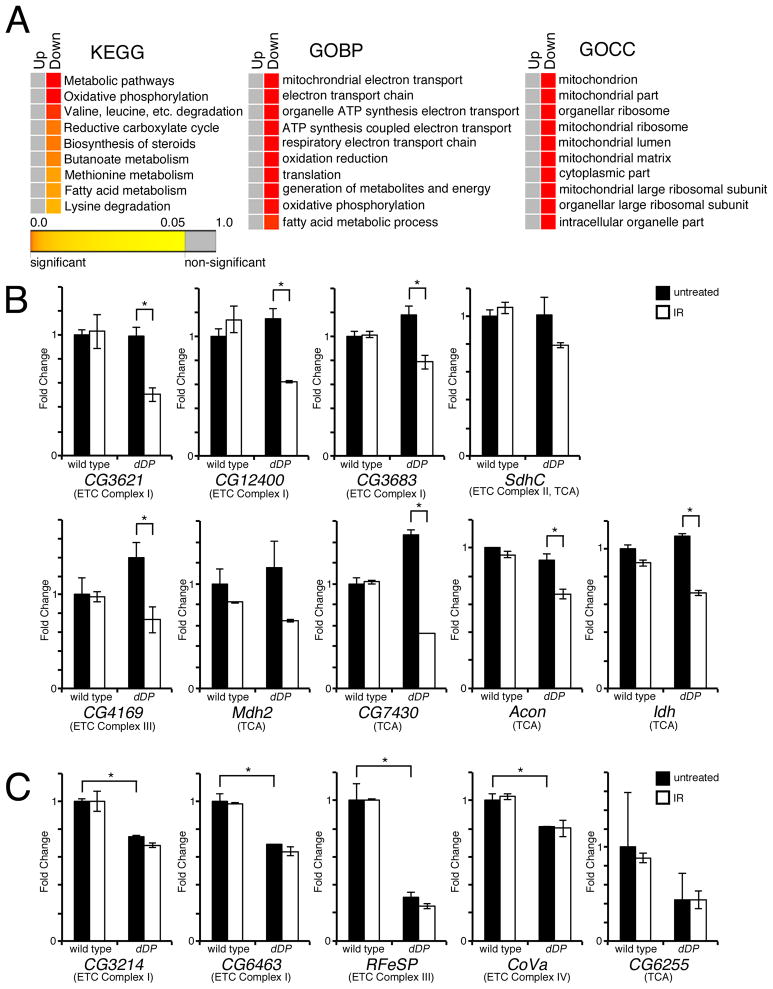
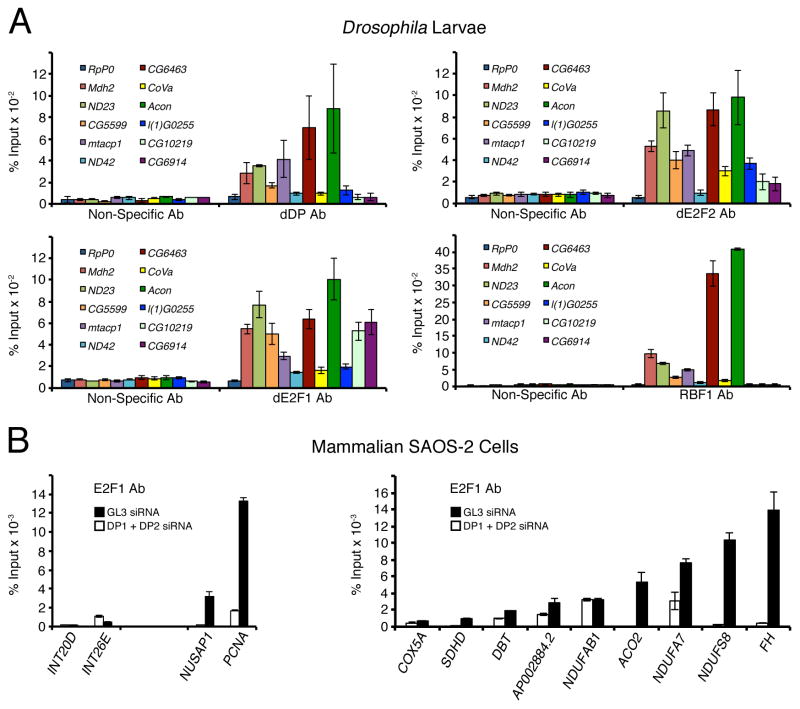
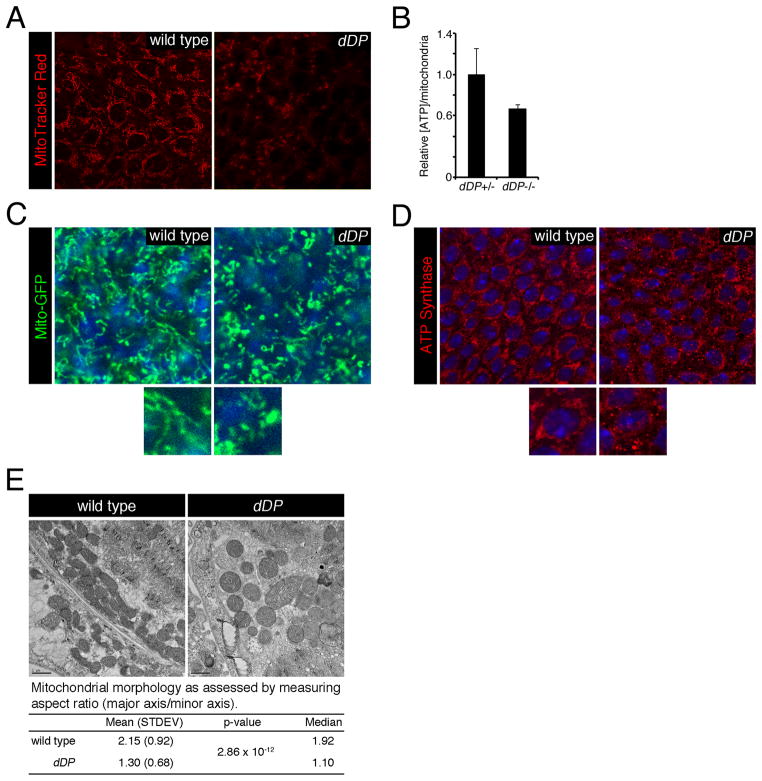
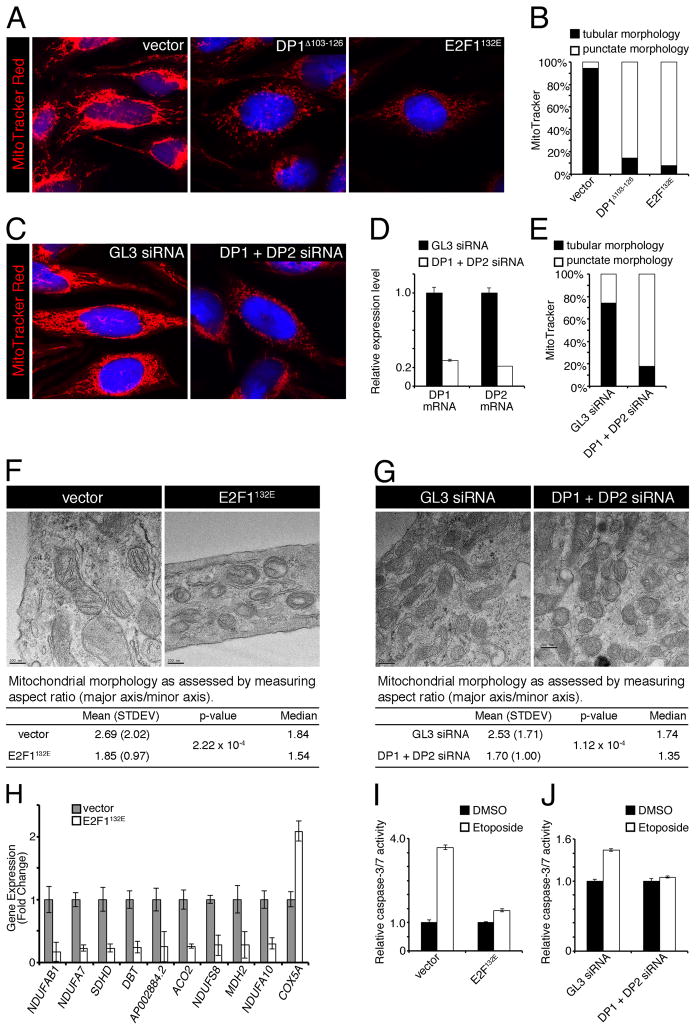
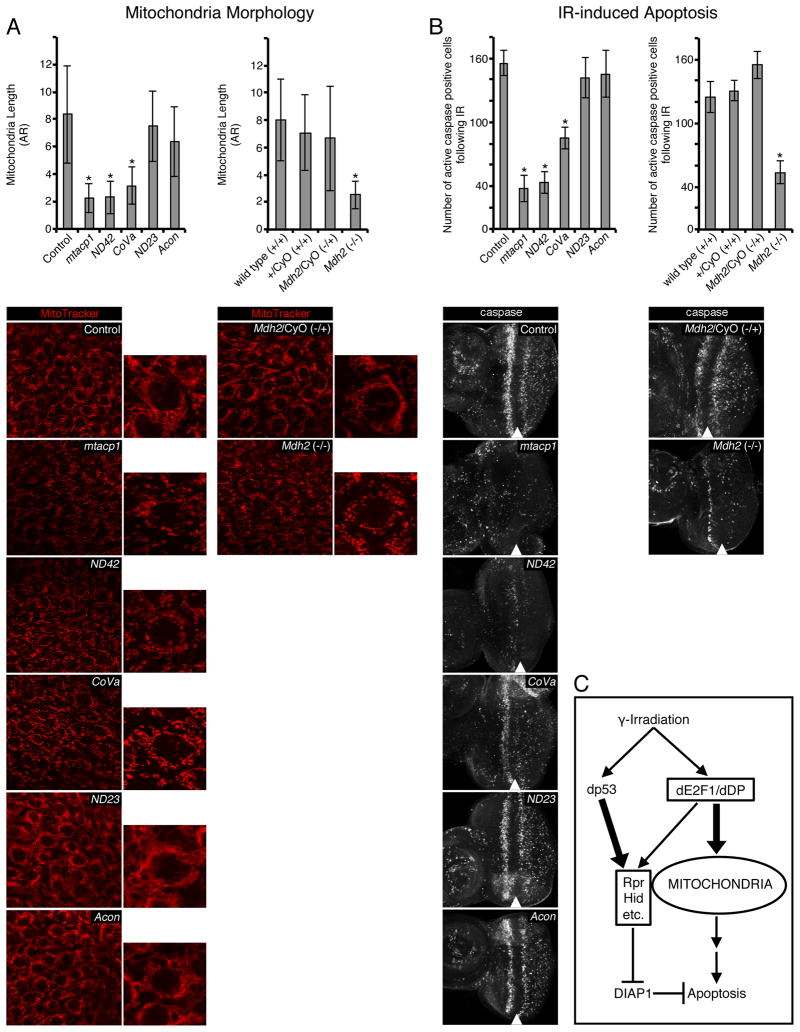
E2F/DP transcription factors regulate cell proliferation and apoptosis. Here, we investigated the mechanism of the resistance of Drosophila dDP mutants to irradiation-induced apoptosis. Contrary to the prevailing view, this is not due to an inability to induce the apoptotic transcriptional program, because we show that this program is induced; rather, this is due to a mitochondrial dysfunction of dDP mutants. We attribute this defect to E2F/DP-dependent control of expression of mitochondria-associated genes. Genetic attenuation of several of these E2F/DP targets mimics the dDP mutant mitochondrial phenotype and protects against irradiation-induced apoptosis. Significantly, the role of E2F/DP in the regulation of mitochondrial function is conserved between flies and humans. Thus, our results uncover a role of E2F/DP in the regulation of mitochondrial function and demonstrate that this aspect of E2F regulation is critical for the normal induction of apoptosis in response to irradiation.


Figures

Figure 1
Figure 1. dDP mutant eye discs fail to undergo DNA damage-induced apoptosis despite a normal apoptotic transcriptional response
Wild type and dDP mutant third instar larval eye discs were untreated or irradiated (IR) with 40 Gy of ionizing radiation. (A) Active caspase immunostaining or TUNEL was used to detect apoptotic cells 4h after IR. Phosphorylated histone H3 (PH3) immunostaining was used to detect mitotic cells 1h after IR. All eye discs are oriented with the posterior to the right. An arrowhead indicates the morphogenetic furrow (MF). (B) Quantification of active caspase cells in the posterior compartment of eye discs either untreated (gray bars) or 4h after IR (white bars) (± SD, with ten discs quantified for each genotype and treatment.) Asterisks (*) indicate that the number of active caspase cells in IR dDP mutant eye discs was statistically significantly different compared to IR control discs for all three control genotypes labeled. P< 0.05 in paired t-tests. (C and D) RNA was isolated from wild type and dDP mutant third instar larval eye discs either untreated or 4h after IR and transcriptional profiles were determined by microarrays. Differentially expressed (DE) genes comparing IR to untreated eye discs were determined for wild type and dDP mutants. Heat maps show enrichment of gene ontology biological process (GOBP) categories for wild type and dDP mutants with a false discovery rate cutoff of 0.05. The heat map colors represent the value of statistical significance of the enrichment. DE genes were separated into either upregulated (up) or downregulated (down) genes. (D) The Venn diagrams display the number of genes either uniquely or commonly differentially expressed following IR in either wild type or dDP mutant backgrounds. Letters denote gene lists corresponding to the respective compartments on the Venn diagrams. The heat map displays the most highly enriched apoptosis-related GOBP categories. (E and G) RNA was isolated from wild type and dDP mutant larvae which were either untreated or 4h after IR. Quantitative real-time PCR was used to measure the expression of the indicated genes. Expression levels of indicated genes for untreated (gray bars) or IR (white bars), for wild type and dDP mutant eye discs are normalized to wild type untreated (± SD, using 3 replicates for each genotype and treatment). (F) Western blot of Hid protein. See also Supplemental Figure S1 and Supplemental Table S1.
Figure 2
Figure 2. Oxidative phosphorylation genes are downregulated in dDP mutant eye discs following DNA damage-induced irradiation
(A) Differentially expressed (DE) genes comparing IR to untreated eye discs were determined for wild type and dDP mutants. The heat map colors represent the value of statistical significance of the enrichment. The enriched categories for heat maps of Kyoto encyclopedia of genes and genomes pathway analysis (KEGG), gene ontology biological process (GOBP), and gene ontology cellular compartment (GOCC) are shown. (B and C) qPCR shows expression levels of indicated genes for untreated (black bars) or IR (white bars), for wild type and dDP mutant eye discs (± SD, using 3 replicates for each genotype and treatment). (*) P < 0.05 in paired t-tests. See also Supplemental Table S2.
Figure 3
Figure 3. Mitochondria associated genes are direct dE2F/dDP targets
(A) ChIP of Drosophila larvae using dDP, dE2f1, dE2f2 or RBF1 antibodies to detect binding to promoters of oxidative phosphorylation genes (± SD, using 3 replicates for each genotype). A Myc (Non-specific) antibody was used as a negative control. Primers for each experimental gene were designed to flank predicted dE2F binding sites up to 2 kb upstream of the TSS. RpP0 was used as a negative control gene. (B) ChIP of SAOS-2 cells using an E2F1 antibody to detect binding to promoters of oxidative phosphorylation genes (± SD, using 3 replicates for each treatment). White bars indicate SAOS-2 cells treated with DP1 and DP2 siRNA. Primers targeting two intergenic regions, INT20D and INT26E, which lack E2F1 binding, were used as negative controls, while known E2F1 targets NUSAP1 and PCNA were used as positive controls.
Figure 4
Figure 4. Reduced mitochondria activity and abnormal mitochondrial morphology in dDP mutant eye discs
(A) MitoTracker (red) was used to examine the mitochondria membrane potential. (B) ATP levels were measured in the eye-antenna discs and brain of control and dDP mutant larvae (± SD, using 3 replicates for each genotype). The ATP levels were normalized to the relative number of mitochondria per animal. The relative number of mitochondria was determined by the ratio of mitochondria genome to nuclear genome content. (C and D) Mitochondria tagged GFP (mito-GFP, green), or immunostaining against ATP Synthase (red) was used to visualize mitochondrial morphology. DNA (blue) is stained with either DAPI (C) or PicoGreen (D). (E) Transmitting electron microscopy. For each genotype 100 mitochondria were measured (± SD) to determine mitochondrial aspect ratios.
Figure 5
Figure 5. Mitochondria activity and structure are compromised in SAOS-2 cells upon E2F inactivation
(A and C) MitoTracker (red) staining of SAOS-2 cells that were either transfected with empty vector, dominant negative DP1 (DP1Δ103-126), dominant negative E2F1 (E2F1132E), unrelated GL3 siRNA, or DP1 and DP2 siRNAs. (B and E) Cells represented by images from A and C were scored for displaying a tubular or punctate mitochondria phenotype. (D) DP1 and DP2 mRNA levels (± SD, using 3 replicates for each treatment) are efficiently depleted by siRNAs. (F and G) TEM of control or E2F/DP inactivated SAOS-2 cells. For each genotype 100 mitochondria were measured (± SD) to determine mitochondrial aspect ratios. (H) qPCR of mitochondria associated genes in SAOS-2 cells that were either transfected with empty vector (gray bars) or dominant negative E2F1 (E2F1132E) (white bars) (± SD, using 3 replicates for each treatment). (I and J) SAOS-2 cells transfected with the indicated plasmid or siRNAs, as described above, were treated with DMSO (black bars) or 25μM etoposide (white bars) for 24h. Apoptosis was quantified by luminescence emission by cleavage of a proluminescent caspase-3/7 DEVD-aminoluciferin substrate (± SD, using 3 replicates for each treatment). See also Supplemental Figure S2.
Figure 6
Figure 6. RNAi mediated knockdown of mitochondria associated dE2f/dDP targets mimics the mitochondrial and apoptosis defects indDP mutant eye discs
For each gene indicated, the corresponding dsRNA under Gal4-UAS control was expressed in the eye disc with ey-FLP; Act≫Gal4 except for the Mdh2 gene for which a mutant allele was used. (A) MitoTracker (red) was used to label mitochondria and mitochondrial aspect ratios were quantified (± SD, with 30 mitochondria from at least 5 discs quantified for each genotype). (B) Active caspase immunostaining was used to detect and quantify apoptotic cells 4h after irradiation (± SD, with at least 5 discs quantified for each genotype). (*) P < 0.05 in paired t-tests comparing the indicated line to an ey-FLP; Act≫Gal4 control except for Mdh2 which was compared to all three of the control genotypes indicated. We note that many controls were used and none of them were statistically significantly different from each other (Supplemental Figure S3A). (C) In irradiated cells, dp53, but not dE2f1, is primarily responsible for induction of the apoptotic gene expression program. In dDP mutants, mitochondrial activity is reduced, likely due to the reduction in expression of mitochondria associated E2F targets. This mitochondrial defect reduces the overall readiness of dDP mutants to undergo cell death and therefore, the properly induced irradiation transcriptional program is insufficient to trigger apoptosis. See also Supplemental Figure S3.

Comment in

References

    1. Abdelwahid E, Rolland S, Teng X, Conradt B, Hardwick JM, White K. Mitochondrial involvement in cell death of non-mammalian eukaryotes. Biochim Biophys Acta. 2011;1813:597–607. - PMC - PubMed
    1. Abdelwahid E, Yokokura T, Krieser RJ, Balasundaram S, Fowle WH, White K. Mitochondrial disruption in Drosophila apoptosis. Dev Cell. 2007;12:793–806. - PubMed
    1. Althammer S, González-Vallinas J, Ballaré C, Beato M, Eyras E. Pyicos: a versatile toolkit for the analysis of high-throughput sequencing data. Bioinformatics. 2011;27:3333–3340. - PMC - PubMed
    1. Ambrus AM, Nicolay BN, Rasheva VI, Suckling RJ, Frolov MV. dE2F2-independent rescue of proliferation in cells lacking an activator dE2F1. Mol Cell Biol. 2007;27:8561–8570. - PMC - PubMed
    1. Asano M, Nevins JR, Wharton RP. Ectopic E2F expression induces S phase and apoptosis in Drosophila imaginal discs. Genes Dev. 1996;10:1422–1432. - PubMed

Publication types

MeSH terms