

System factors to explain 2009 pandemic H1N1 state vaccination rates for children and high-risk adults in US emergency response to pandemic
- PMID: 24286836
- PMCID: PMC6132055
- DOI: 10.1016/j.vaccine.2013.11.018
System factors to explain 2009 pandemic H1N1 state vaccination rates for children and high-risk adults in US emergency response to pandemic
Abstract
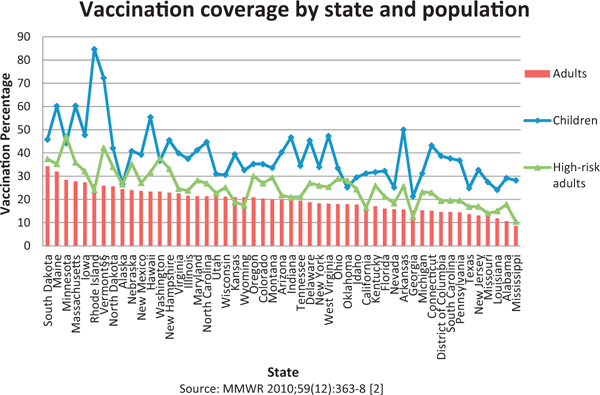
Introduction: During the 2009-2010 H1N1 pandemic, children and high-risk adults had priority for vaccination. Vaccine in short supply was allocated to states pro-rata by population, but vaccination rates as of January 2010 varied among states from 21.3% to 84.7% for children and 10.4% to 47.2% for high-risk adults. States had different campaign processes and decisions.
Objective: To determine program and system factors associated with higher state pandemic vaccination coverage for children and high-risk adults during an emergency response with short supply of vaccine.
Methods: Regression analysis of factors predicting state-specific H1N1 vaccination coverage in children and high-risk adults, including state campaign information, demographics, preventive or health-seeking behavior, preparedness funding, providers, state characteristics, and surveillance data.
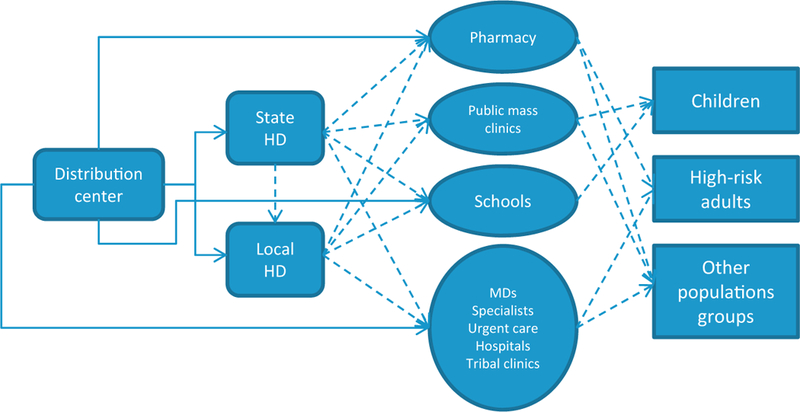
Results: Our modeling explained variation in state-specific vaccination coverage with an adjusted R-squared of 0.82 for children and 0.78 for high-risk adults. We found that coverage of children was positively associated with programs focusing on school clinics and with a larger proportion of doses administered in public sites; negatively with the proportion of children in the population, and the proportion not visiting a doctor because of cost. The coverage for high-risk adults was positively associated with shipments of vaccine to "general access" locations, including pharmacy and retail, with the percentage of women with a Pap smear within the past 3 years and with past seasonal influenza vaccination. It was negatively associated with the expansion of vaccination to the general public by December 4, 2009. For children and high-risk adults, coverage was positively associated with the maximum number of ship-to-sites and negatively associated with the proportion of medically underserved population.
Conclusion: Findings suggest that distribution and system decisions such as vaccination venues and providers targeted can positively impact vaccination rates for children and high-risk adults. Additionally, existing health infrastructure, health-seeking behaviors, and access affected coverage.
Keywords: Children and high-risk adults; Coverage; Estimates; Factors; Pandemic; State-specific.
Copyright © 2013 The Authors. Published by Elsevier Ltd.. All rights reserved.
Conflict of interest statement
Figures
Similar articles
-
System factors to explain H1N1 state vaccination rates for adults in US emergency response to pandemic.Vaccine. 2014 May 23;32(25):3088-93. doi: 10.1016/j.vaccine.2013.05.069. Epub 2013 May 30. Vaccine. 2014. PMID: 23727421
-
Interim results: state-specific influenza vaccination coverage--United States, August 2010-February 2011.MMWR Morb Mortal Wkly Rep. 2011 Jun 10;60(22):737-43. MMWR Morb Mortal Wkly Rep. 2011. PMID: 21659982
-
Surveillance of influenza vaccination coverage--United States, 2007-08 through 2011-12 influenza seasons.MMWR Surveill Summ. 2013 Oct 25;62(4):1-28. MMWR Surveill Summ. 2013. PMID: 24157710
-
Influenza vaccination coverage rate in children: reasons for a failure and how to go forward.Hum Vaccin Immunother. 2012 Jan;8(1):107-18. doi: 10.4161/hv.8.1.18278. Epub 2012 Jan 1. Hum Vaccin Immunother. 2012. PMID: 22252000 Review.
-
Seasonal Influenza Vaccination Programs in the Americas: A Platform for Sustainable Life-Course Immunization and Its Role for Pandemic Preparedness and Response.Vaccines (Basel). 2024 Dec 16;12(12):1415. doi: 10.3390/vaccines12121415. Vaccines (Basel). 2024. PMID: 39772075 Free PMC article. Review.
Cited by
-
The Impact of Meso-Level Factors on SARS-CoV-2 Vaccine Early Hesitancy in the United States.Int J Environ Res Public Health. 2023 Jul 7;20(13):6313. doi: 10.3390/ijerph20136313. Int J Environ Res Public Health. 2023. PMID: 37444159 Free PMC article.
-
State barriers to appropriating public health emergency response funds during the 2009 H1N1 response.Am J Public Health. 2015 Apr;105 Suppl 2(Suppl 2):S274-9. doi: 10.2105/AJPH.2014.302378. Epub 2015 Feb 17. Am J Public Health. 2015. PMID: 25689213 Free PMC article.
-
Facing a Health Threat in a Complex Information Environment: A National Representative Survey Examining American Adults' Behavioral Responses to the 2009/2010 A(H1N1) Pandemic.Health Educ Behav. 2018 Feb;45(1):77-89. doi: 10.1177/1090198117708011. Epub 2017 May 26. Health Educ Behav. 2018. PMID: 28548547 Free PMC article.
-
Supply, then demand? Health expenditure, political leanings, cost obstacles to care, and vaccine hesitancy predict state-level COVID-19 vaccination rates.Vaccine. 2022 Oct 26;40(45):6528-6548. doi: 10.1016/j.vaccine.2022.08.050. Epub 2022 Sep 8. Vaccine. 2022. PMID: 36202641 Free PMC article.
-
Multi-period vaccine allocation model in a pandemic: A case study of COVID-19 in Australia.Transp Res E Logist Transp Rev. 2022 May;161:102689. doi: 10.1016/j.tre.2022.102689. Epub 2022 Apr 11. Transp Res E Logist Transp Rev. 2022. PMID: 35431604 Free PMC article.
References
-
- Centers for Disease Control and Prevention.FOIA Request, H1N1 Shipments through December 9, 2009; 2009 [provided 17.12.09].
-
- Centers for Disease Control and Prevention. Interim results: state-specific influenza A (H1N1) 2009 monovalent vaccination coverage - United States, October 2009-January 2010. MMWR Morbidity and Mortality Weekly Report 2010;59(12):363–8 [April 2]. - PubMed
-
- National Automobile Dealers Association. Report on Average age and Number of Vehicles. National Automobile Dealers Association; 2006. [available from: http://www.swivel.com/workbooks/19617-Cars-per-state cited 03.05.10].
-
- The Henry J. Kaiser Family Foundation - Statehealthfacts.org. 50 State Comparisons; 2010. [available from: http://www.statehealthfacts.org/compare.jsp cited 12.07.10].
-
- Centers for Disease Control and Prevention. Vaccine Depos assigned to States; 2010 [provided 16.06.10].
Publication types
MeSH terms
Substances
Grants and funding
LinkOut - more resources
Full Text Sources
Other Literature Sources
Medical
Research Materials
Miscellaneous
