. 2014 Apr;59(4):769-77.
doi: 10.1007/s10620-013-2962-9. Epub 2013 Nov 28.

Intestinal and peripheral fibrinogen-like protein 2 expression in inflammatory bowel disease

Affiliations

Intestinal and peripheral fibrinogen-like protein 2 expression in inflammatory bowel disease

Xiuli Dong et al. Dig Dis Sci. 2014 Apr.

Abstract

Background: Fibrinogen-like protein 2 (FGL2), a new member of the fibrinogen-like family, has recently been identified as a novel immunosuppressive molecule.

Aim: The purpose of this work was to investigate intestinal and peripheral expression of FGL2 in patients with inflammatory bowel disease (IBD), mainly ulcerative colitis (UC) and Crohn's disease (CD).

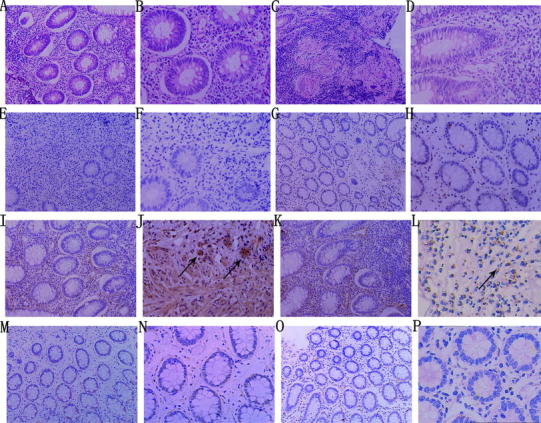
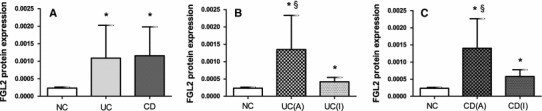
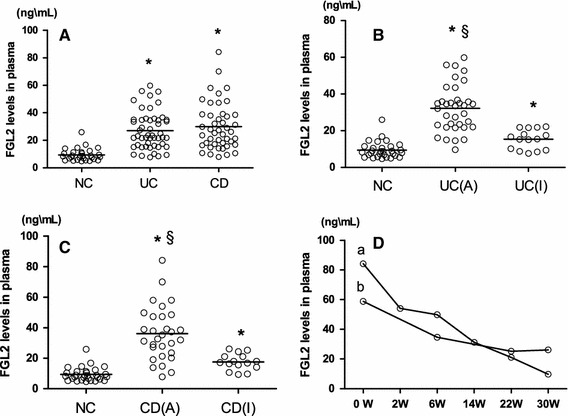
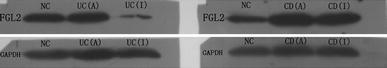
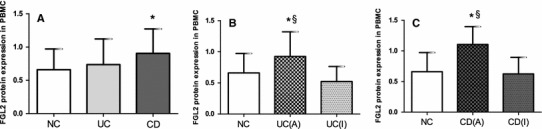
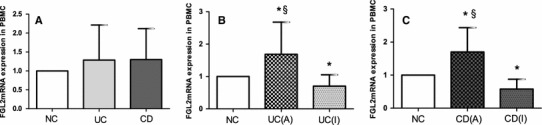
Methods: FGL2 expression in mucosal biopsies from three groups (UC group (n = 61), CD group (n = 54), and controls group (n = 35)) was detected by immunohistochemistry. Concentrations of FGL2 in plasma from 50 UC patients, 45 CD patients, and 30 controls were analyzed by enzyme-linked immunosorbent assay. Western blot of FGL2 protein and real-time fluorescent quantitative PCR of FGL2 mRNA expression by peripheral mononuclear cells was performed. Correlations of FGL2 expression with disease type, activity, and location, and with measured laboratory data, including C-reactive protein (CRP) and erythrocyte sedimentation rate (ESR), were examined.

Results: Intestinal and peripheral FGL2 protein data showed that FGL2 expression was significantly up-regulated in both UC and CD patients compared with controls (P < 0.001). Expression of FGL2 was higher in UC and CD patients with active disease than in those with inactive disease (P < 0.001). Moreover, FGL2 mRNA expression was significantly higher in patients with active disease than in those with inactive disease (P < 0.050). Expression of FGL2 protein was correlated with disease activity indices, CRP levels, and ESR levels.

Conclusion: Expression of FGL2 was up-regulated in IBD patients with active disease. Measurement of FGL2 may be used as a helpful biomarker for understanding immunopathogenesis and for assessment of IBD.


Figures

Fig. 1
Fig. 1
Representative photographs of hematoxylin–eosin (HE) staining and immunohistochemical staining of FGL2 in mucosal biopsy tissues. ad HE staining of tissues from patients with UC and CD; a large number of monocytes and neutrophils infiltrating the intestinal tissues were observed (a UC ×200, b UC ×400, c CD ×200, d CD ×400). e, f Negative controls showed no positive expression of FGL2 (e ×200, f ×400). g, h Normal controls showed little or no FGL2 expression (g ×200, h ×400). il FGL2 was strongly expressed in inflammatory infiltrating cells and endothelial cells (black arrows) of tissues from patients with active UC or CD (i active UC ×200, j active UC ×400, k active CD ×200, l active CD ×400). mp Expression of FGL2 was less in patients with inactive UC or CD (m inactive UC ×200, n inactive UC ×400, o inactive CD ×200, p inactive CD ×400)
Fig. 2
Fig. 2
FGL2 expression in mucosal biopsy tissues. a Column diagrams represent expression of FGL2 in the normal controls group (NC group, n = 35), ulcerative colitis group (UC group, n = 61), and Crohn’s disease group (CD group, n = 54). b Expression of FGL2 in the NC group (n = 35), the active UC group (n = 44), and the inactive UC group (n = 17). c Expression of FGL2 in the NC group (n = 35), the active CD group (n = 38), and the inactive CD group (n = 16). The clinical details of the subjects are listed in Table 1. Data are presented as mean ± SD. UC (A) active UC, UC (I) inactive UC, CD (A) active CD, CD (I) inactive CD. *Significance compared with NC (P < 0.001); §significance compared with patients with inactive disease (P < 0.001)
Fig. 3
Fig. 3
FGL2 levels in plasma. Each individual patient or control is shown as a circle, and bold lines are the mean values. a Levels of FGL2 in the NC group (n = 30), UC group (n = 50), and CD group (n = 45). b Levels of FGL2 in the NC group (n = 30), active UC group (n = 35), and inactive UC group (n = 15). c FGL2 levels in the NC group (n = 30), active CD group (n = 30), and inactive CD group (n = 15). The clinical details of the subjects are listed in Table 2. d Two CD patients with active disease, in both of whom the ileum and colon were involved, were both undergoing anti-TNF-α and azathioprine therapy. The line graphs labeled a and b represent the FGL2 levels of a 20-year-old female patient and a 24-year-old male patient, respectively, during the period of treatment. Each time is shown as a circle. UC (A) active UC, UC (I) inactive UC, CD (A) active CD, CD (I) inactive CD. *Significance compared with NC (P < 0.001); §significance compared with patients with inactive disease (P < 0.001)
Fig. 4
Fig. 4
Representative photographs of Western blot analysis of FGL2 protein expression. The molecular mass of FGL2 is 64 kDa, and that of GAPDH is 37 kDa. NC normal controls, UC (A) active UC, UC (I) inactive UC, CD (A) active CD, CD (I) inactive CD
Fig. 5
Fig. 5
FGL2 protein expression in peripheral blood mononuclear cells (PBMC). a Column diagrams represent expression of FGL2 in the NC group, UC group, and CD group. The NC group (n = 30) contained 18 males and 12 females; the mean age was 40.5 years. The UC group (n = 30) contained 17 males and 13 females; the mean age was 44.3 years. The CD group (n = 29) contained 17 males and 12 females; the mean age was 35.4 years. b Expression of FGL2 in the NC group, active UC group, and inactive UC group. The active UC group (n = 16) contained 9 males and 7 females; the mean age was 48.3 years. The inactive UC group (n = 14) contained 8 males and 6 females; the mean age was 40.3 years. c Expression of FGL2 in the NC group, active CD group, and inactive CD group. The active CD group (n = 17) included 10 males and 7 females; the mean age was 38.9 years. The inactive CD group (n = 12) contained 7 males and 5 females; the mean age was 32.0 years. Data are presented as mean ± SD. UC (A) active UC, UC (I) inactive UC, CD (A) active CD, CD (I) inactive CD. *Significance compared with NC (P < 0.001); §significance compared with patients with inactive disease (P < 0.001)
Fig. 6
Fig. 6
FGL2 mRNA expression in peripheral blood mononuclear cells (PBMC). a Column diagrams represent expression of FGL2 in the NC group, the UC group, and the CD group. The NC group (n = 24) contained 14 males and 10 females; the mean age was 40.3 years. The UC group (n = 27) contained 14 males and 13 females; the mean age was 46.1 years. The CD group (n = 28) contained 16 males and 12 females; the mean age was 36.9 years. b Expression of FGL2 mRNA in the NC group, the active UC group, and the inactive UC group. The active UC group (n = 16) contained 9 males and 7 females; the mean age was 50.8 years. The inactive UC group (n = 11) contained 5 males and 6 females; the mean age was 41.4 years. c Expression of FGL2 mRNA in the NC group, the active CD group, and the inactive CD group. The active CD group (n = 18) contained 10 males and 8 females; the mean age was 42.5 years. The inactive CD group (n = 10) contained 6 males and 4 females; the mean age was 31.3 years. Data are presented as mean ± SD. UC (A) active UC, UC (I), inactive UC, CD (A) active CD, CD (I) inactive CD. *Significance compared with NC (P < 0.050); §significance compared with patients with inactive disease (P < 0.050)

References

    1. Bernstein CN, Fried M, Krabshuis JH, et al. World Gastroenterology Organization practice guidelines for the diagnosis and management of IBD in 2010. Inflamm Bowel Dis. 2010;16:112–124. doi: 10.1002/ibd.21048. - DOI - PubMed
    1. Khor B, Gardet A, Xavier RJ. Genetics and pathogenesis of inflammatory bowel disease. Nature. 2011;474:307–317. doi: 10.1038/nature10209. - DOI - PMC - PubMed
    1. Nagalingam NA, Lynch SV. Role of the microbiota in inflammatory bowel diseases. Inflamm Bowel Dis. 2012;18:968–984. doi: 10.1002/ibd.21866. - DOI - PubMed
    1. Maloy KJ, Powrie F. Intestinal homeostasis and its breakdown in inflammatory bowel disease. Nature. 2011;474:298–306. doi: 10.1038/nature10208. - DOI - PubMed
    1. Rb S. Pathagenesis and immune mechanisms of chronic inflammatory bowel diseases. Am J Gastroenterol. 1997;92:5S–11S. - PubMed

Publication types