. 2014 Jun 1;522(8):1929-40.
doi: 10.1002/cne.23512.

Differential localization of NT-3 and TrpM5 in glomeruli of the olfactory bulb of mice

Affiliations

Differential localization of NT-3 and TrpM5 in glomeruli of the olfactory bulb of mice

S H Rolen et al. J Comp Neurol. .

Abstract

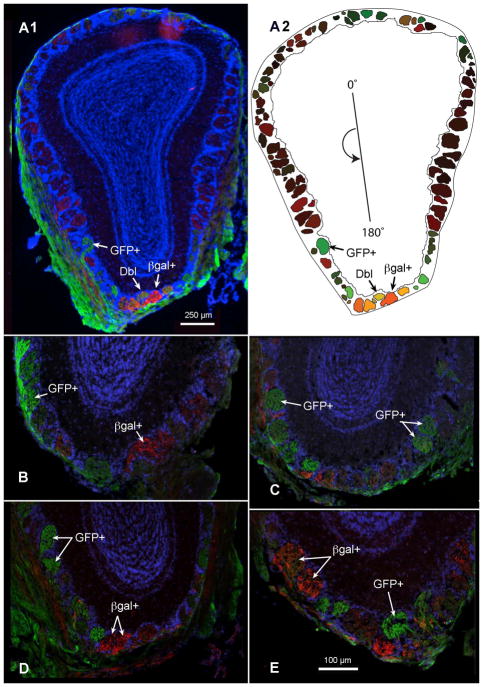
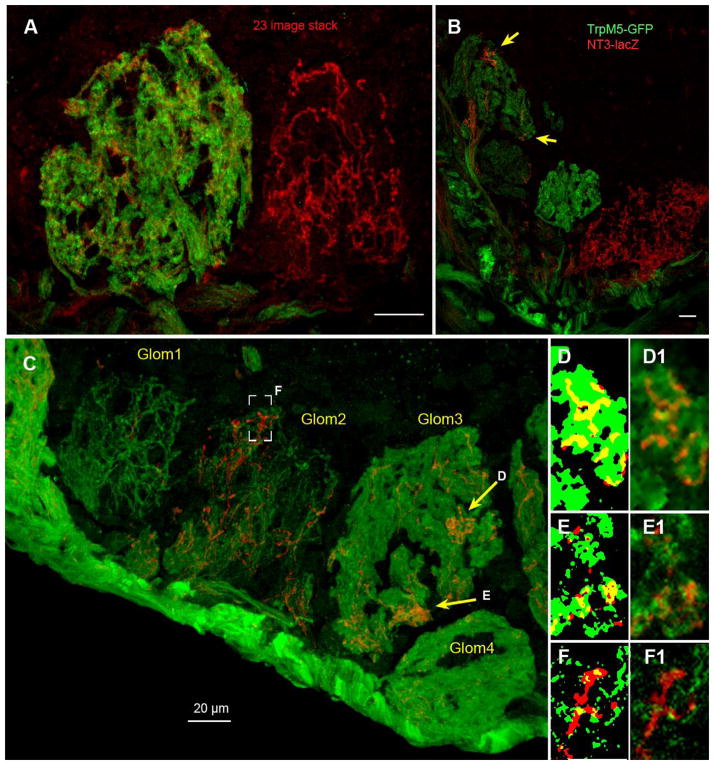
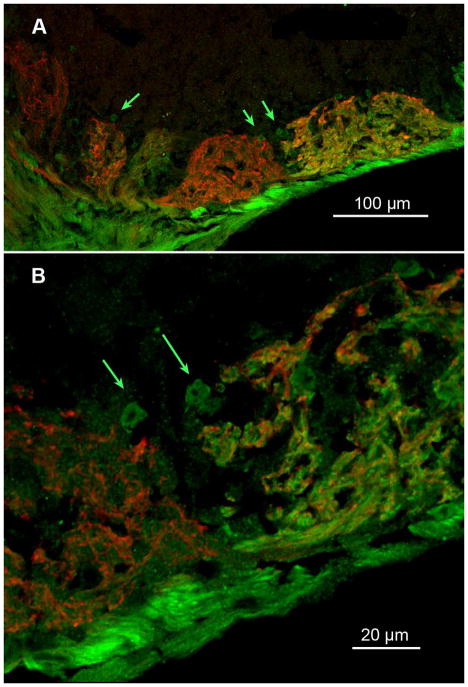
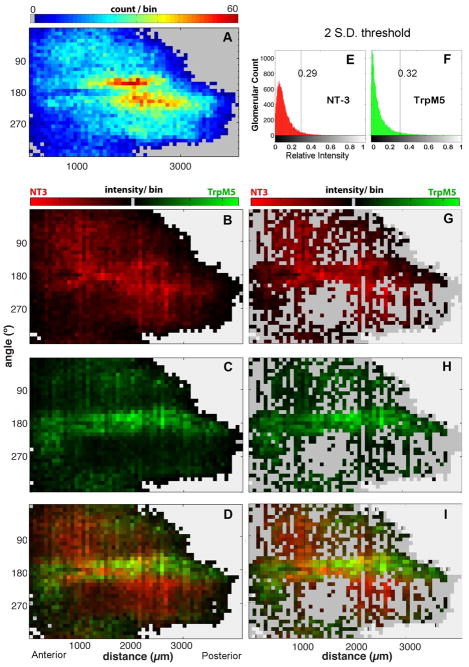
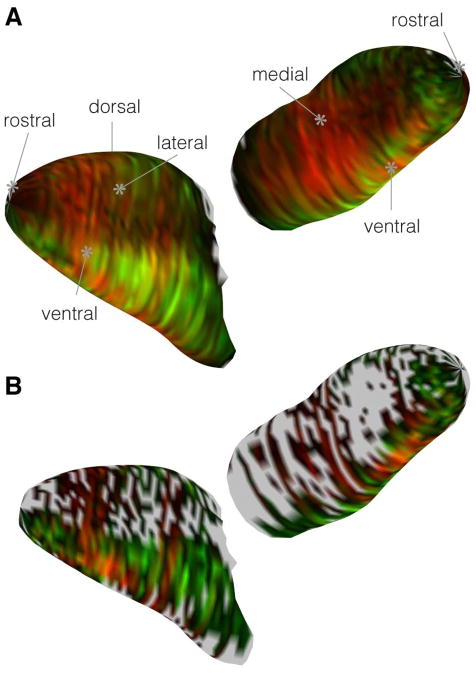
Olfactory sensory neurons that express transient receptor potential channel M5 (TrpM5) or neurotrophin-3 (NT-3) project to defined clusters of glomeruli situated ventrally in the main olfactory bulb. Using genetically labeled mice, we investigated whether expression of NT-3-driven βgal and TrpM5-driven GFP marked overlapping sets of glomeruli and whether expression of these markers was coordinated. Our results indicate that these markers largely characterize independent sets of olfactory sensory neuron axons and glomeruli. Further, in glomeruli in which both TrpM5-GFP and NT-3-βgal labeled axons occur, they are expressed independently. The nature of staining for these two markers also differs within glomeruli. Within each labeled TrpM5-positive glomerulus, the level of TrpM5-GFP expression was similar throughout the glomerular neuropil. In contrast, NT-3-driven βgal expression levels are heterogeneous even within heavily labeled glomeruli. In addition, a population of very small TrpM5-GFP positive glomeruli is apparent while no similar populations of NT-3-βgal glomeruli are evident. Taken together, these data suggest that TrpM5 and NT-3 characterize two largely independent receptor populations both conveying odorant information to the ventral olfactory bulb.

Keywords: olfaction, immunochemistry, mapping, semiochemical, microglomeruli.


Conflict of interest statement

Conflict of Interest Statement: The authors have no known conflicts of interest in relation to this publication.

Figures

Figure 1
Figure 1
Cross-sections through the olfactory bulbs of double transgenic mice expressing TrpM5-driven GFP (GFP+, green) and NT-3-driven β-galactosidase (βgal+, red). (A1) Labeled axons for both reporter genes terminate in glomeruli throughout the glomerular layer of the MOB. Arrows indicate a few strongly labeled for the two reporters: GFP+ or βgal+; Dbl − indicates a double-labeled glomerulus. (A2) Plot of each mapped glomerulus from the bulb cross-section in (A1). The origin line in the center of the plot indicates the counter-clockwise cylindrical coordinates of each glomerulus, where 0, 90, 180, and 270° indicate dorsal, lateral, ventral, and medial, respectively. The color in each glomerulus is determined by an RGB triplet in which the red and green values correspond to the mean red and green intensities of the pixels contained within the glomerular profile, and the blue value is set to zero. (B and C) GFP+ and βgal+ glomeruli are shown in the ventral MOB of a single female mouse and (D and E) a single male mouse. Immunolabeling was performed with antibodies against GFP (green) and βgal (red), reporter proteins for TrpM5 and NT-3 expression, respectively; DAPI counterstain, blue A–E. Scale bar = 100μm.
Figure 2
Figure 2
Confocal images of glomeruli in a double transgenic mouse: TrpM5-GFP/NT-3LacZ showing the variety and types of labeling observed. Scale bars = 20 μm. (A) Adjacent glomeruli in the ventral MOB can exhibit substantially different degrees of labeling. The left glomerulus shows the typical diffuse appearance of TrpM5-GFP staining (green) which is similar to that seen with OMP, i.e. when all incoming olfactory axons are labeled. In this same glomerulus, scattered NT-3-βgal fibers are evident throughout the glomerular neuropil. In contrast, the glomerulus on the right shows a moderately stained NT-3-positive glomerulus in which immunoreactive fibers appear as a bright network, suggesting that only some of the incoming axons exhibit immunoreactivity. Z-stack depth = 9.9 μm. (B) Three glomeruli in the ventromedial part of the MOB showing different degrees of labeling with the two markers. The glomerulus at upper left shows diffuse TrpM5-GFP label, but patchy distribution of fibers labeled for NT-3-βgal. Arrows indicate two areas of neuropil within this glomerulus with substantial NT-3-βgal innervation although the bulk of the glomerulus essentially lacks any NT-3-βgal+ fibers. Z-stack depth = 11.875 μm. (C) Four glomeruli along the ventral edge of the MOB showing different degrees and types of labeling for the two markers. Especially noteworthy is the patchy distribution (yellow arrows) of NT-3-βgal fibers (red) within Glom 3, which shows relatively homogeneous filling of the neuropil by TrpM5-GFP fibers (green). Glom1 is one of the relatively rare glomeruli, which exhibits sparse TrpM5-GFP label so that individual fibers can be discerned within the glomerular neuropil. Brackets indicate a subregion of Glom2 enlarged in panels F and F′. Z-stack depth = 8.7 μm. (DF) Enlargements of single confocal planes from regions shown in Panel C to show degree of co-localization. The left hand image of each pair has been thresholded to yield a binary image in each color plane to enable comparison of co-localized regions (yellow) with single labeled regions of each color. (D and D1) Enlargement of area indicated by the top right arrow in panel C. Note that NT-3-βgal+ fibers (red) occupy areas of the glomerulus filled by TrpM5-positive fibers and show substantial co-localization within the limits of resolution of the microscope. (E1) Enlargement of area indicated by the bottom right arrow in panel C. Although many co-localized pixels are evident, some pixels display only NT-33-βgal label (red). (F & F1) Enlargement of a single plane image from area in brackets. Although this glomerulus is double-labeled, nearly all pixels show label for only one of the two markers indicating the independent origins of these fiber systems.
Figure 3
Figure 3
(A) Confocal image (z-stack 6.0 μm deep) showing heterogeneous fields of glomerular neuropil in several glomeruli of the ventral MOB. The green arrows indicate small regions of neuropil that stain differently than the main body of the glomerulus. (B) Higher magnification of the region in panel A indicated by the paired arrows on the right side of (A) but shown in a z stack of 0.5 μm. Small round regions of TrpM5-GFP-positive neuropil are apparent at the margins of two neighboring glomeruli, one exhibiting dual label and the other being predominantly occupied by fibers exhibiting NT-3-βgal staining. A median digital filter was applied to reduce background pixel noise.
Figure 4
Figure 4
Standard GLOMMap 2D plots comparing staining patterns for glomeruli positive for TrpM5 or NT-3 with a plot of overall glomerular density in the MOB. Each square in the plots represents the collection of glomeruli in a bin of 72 μm and 10°. The X-axis plots the distance in microns from rostral tip of bulb (AP axis); the Y-axis gives the cylindrical coordinates around the perimeter of each bulb cross-section, where 0°, 90°, 180°, and 270° respectively indicate dorsal, lateral, ventral, and medial aspects. (A) A plot of the density of all glomeruli across location in the MOB (n = 8 bulbs). Warmer colors indicate more glomeruli per bin. Gray indicates outside of MOB. Two regions of increased glomerular density (red-yellow regions) occur on the ventrolateral and ventromedial surfaces of the mid-caudal bulb, between 160 and ~200° and between 1500 and 3000 μm AP. (BD) 2D plots of the identical glomerular bins from A, but with color indicating average normalized staining intensity in each bin (instead of count) for the two markers: brighter greens indicate stronger TrpM5 staining intensity, while brighter reds indicate stronger NT-3 staining intensity. Black indicates a background subtracted binned intensity value of zero. B. 2D intensity plot for NT-3 positive glomeruli. C. 2D intensity plot for TrpM5 positive glomeruli. D. True color overlay of the green and red intensity plots shown individually in panels B and C so that a yellow hue indicates an equivalence in intensity values. The region of maximal co-localization lies along the ventral margin of the bulb (180°), but anterior (1000 – 1500 μm AP) to the region of highest overall glomerular density (yellow-red regions of panel A) (E & F) Normalized brightness histograms for all glomeruli for each channel after applying a 2 S.D. threshold cut-off. E: For NT-3, the normalized cut-off relative value is 0.29. F: For TrpM5, the normalized cut-off value is 0.32. GI: GLOMMap 2D plots of normalized intensity of glomeruli above threshold similar to those of panels B–D, but showing only the brightest glomeruli (i.e. strongly positive for either marker) in which only those glomeruli with an intensity greater than two 2 S.D. above the mean in either color channel are plotted (leaving 9.3% of all glomeruli). Regions with no glomeruli above that cutoff are indicated by the darker gray. Few regions contain glomeruli that are heavily labeled by the two markers as indicated by yellow-orange hues.
Figure 5
Figure 5
3D visualization of the segregated intensity patterns. (A) The 2D histogram of the full glomerular dataset from 4D wrapped around a three-dimensional reconstruction of the MOB. (B) 3D plot of the brightest glomeruli reduced dataset from 4I.
FIGURE 6
FIGURE 6
Glomeruli positive for NT3 and TRPM5 show increasing anti-correlation at higher intensity. Each column in the figure (e.g. AM, BN, etc.) depicts glomeruli that exceed the intensity threshold criterion in 2 channel intensity space; the column headers indicate the intensity threshold (ranked from 0 to 1) and the percent of data remaining. In the first column (AM), no threshold was applied and 100% of the data are represented. In the subsequent columns, incrementally higher intensity thresholds were used (BN = 0.1; CO = 0.2; DP = 0.3) to reduce the dataset to smaller percentages representing brighter values. For each incremental subset, we increasingly eliminate glomeruli in which the normalized intensity of label fall below the indicated threshold in the 2 channels. For example, in the 0.1 column (BN), all glomeruli with normalized intensities below 0.1 in the red and green channels are eliminated (61.1% of glomeruli remain). Correspondingly, in the 0.3 column, glomeruli with intensities below 0.3 in the 2 channels are eliminated (11.2% of glomeruli remain). Row 1 (AD) Intensity histograms for the red channel across all datasets. In A, the inset shows the peak of the histogram. A large population of glomeruli with zero intensity can be seen here but are truncated in the full histogram. In BD, the histograms have two peaks, indicating two populations of glomeruli: a more strongly labeled population and a weaker labeled one. The weakly labeled glomeruli are those that are above threshold due to brightness in the green channel although relatively dim in red. This bimodal distribution more clearly resolves into two distinct populations in C and D. Row 2 (EH). Intensity histograms from the green channel displayed as in Row 1 and show a similar bimodal distribution. E. Inset shows peak of histogram truncated in the main panel. Row 3 (IL) Color scatter plots in 2 color intensity space: red channel intensity (x-axis) plotted against green channel intensity (y-axis). Each dot represents one glomerulus. Glomeruli eliminated by the threshold cut-off occupy the lower left hand corner of plot as indicated by the increasingly larger white region in that corner (JL). The statistical elimination of most glomeruli with even a low threshold indicates that most glomeruli are weakly or poorly stained by both TRPM5 and NT3. Furthermore, those glomeruli that are strongly labeled by one label tend to be weakly labeled by the other. Row 4 (MP) Color-coded angle histograms showing the relative staining of suprathreshold glomeruli in red and green channels. For ease of comparison, the histograms are normalized to maximum bin count. In these histograms, a glomerulus with a normalized intensity of 1.0 in the red channel, and a normalized green intensity of 0 would fall in the 0–10° bin. By comparison, a glomerulus with green intensity of 1.0 and a red intensity of 0 would fall in the 80–90° bin. The low number of glomeruli near the 45 degree angle demonstrates the paucity of double label. The intensity correlation quotient (ICQ, Li et al., 2004) is listed below each histogram is listed the intensity correlation quotient. ICQ values range from −0.5 to 0.5; an ICQ value close to zero indicates a random (or mixed) staining pattern. Positive ICQ values indicated dependent staining patterns and negative ICQ values indicate a segregated staining pattern. These results further confirm that glomeruli strongly labeled by one marker tend to be weakly labeled by the other; few glomeruli are strongly labeled by both markers.

Similar articles

Cited by

References

    1. Bader A, Klein B, Breer H, Strotmann J. Connectivity from OR37 expressing olfactory sensory neurons to distinct cell types in the hypothalamus. Front Neural Circuits. 2012;6:84. - PMC - PubMed
    1. Bolte S, Cordelieres FP. A guided tour into subcellular colocalization analysis in light microscopy. J Microsc. 2006;224:213–232. - PubMed
    1. Bozza T, Vassalli A, Fuss S, Zhang JJ, Weiland B, Pacifico R, Feinstein P, Mombaerts P. Mapping of class I and class II odorant receptors to glomerular domains by two distinct types of olfactory sensory neurons in the mouse. Neuron. 2009;61:220–233. - PMC - PubMed
    1. Chess A, Simon I, Cedar H, Axel R. Allelic inactivation regulates olfactory receptor gene expression. Cell. 1994;78:823–834. - PubMed
    1. Clapp TR, Medler KF, Damak S, Margolskee RF, Kinnamon SC. Mouse taste cells with G protein-coupled taste receptors lack voltage-gated calcium channels and SNAP-25. BMC Biol. 2006;4:7. - PMC - PubMed

Publication types