Controlled Clinical Trial
. 2014 Feb;27(2):163-74.
doi: 10.1002/nbm.3048. Epub 2013 Nov 28.

Assessment of ischemic penumbra in patients with hyperacute stroke using amide proton transfer (APT) chemical exchange saturation transfer (CEST) MRI

Affiliations
Controlled Clinical Trial

Assessment of ischemic penumbra in patients with hyperacute stroke using amide proton transfer (APT) chemical exchange saturation transfer (CEST) MRI

Anna Tietze et al. NMR Biomed. 2014 Feb.

Abstract

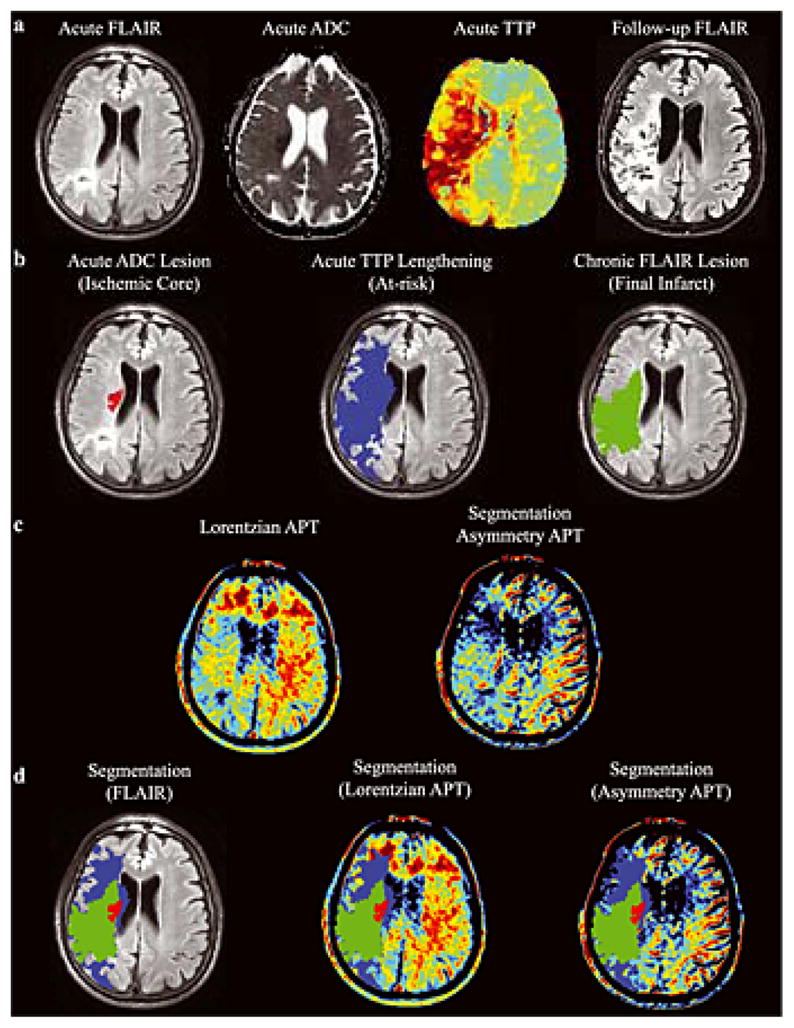
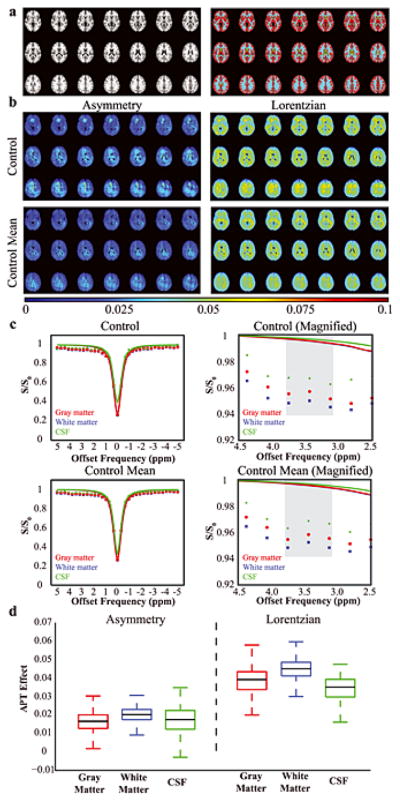
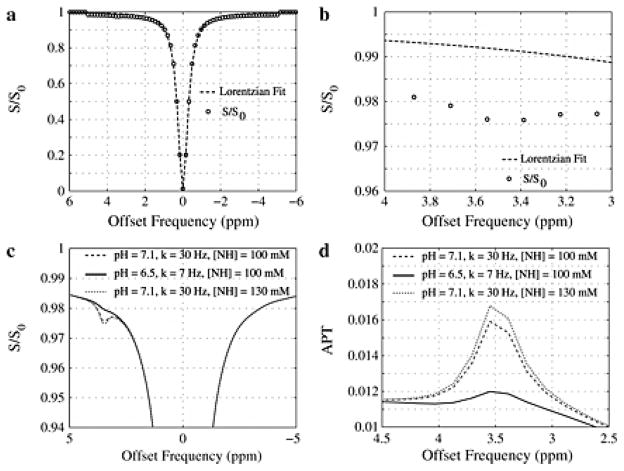
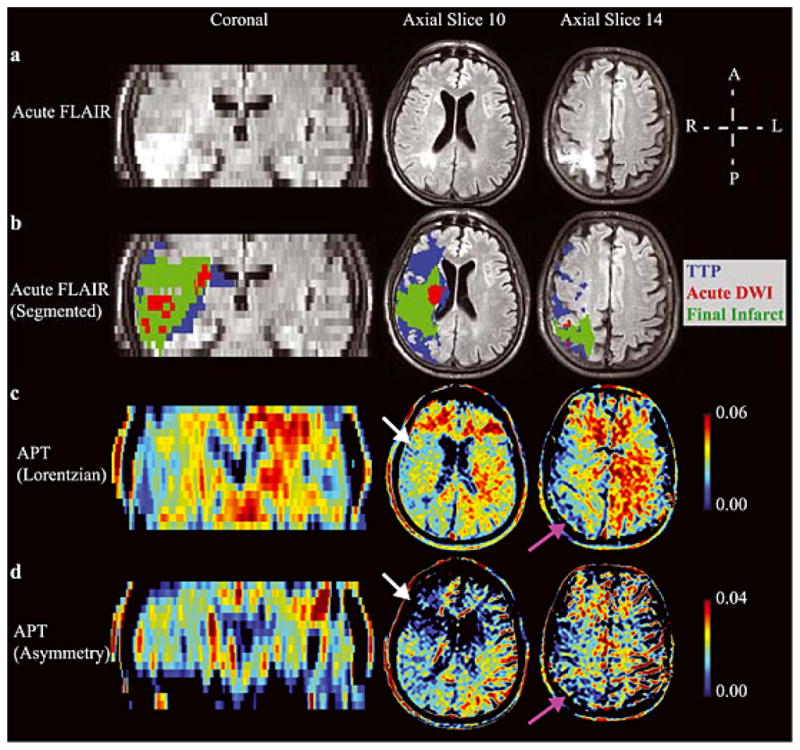
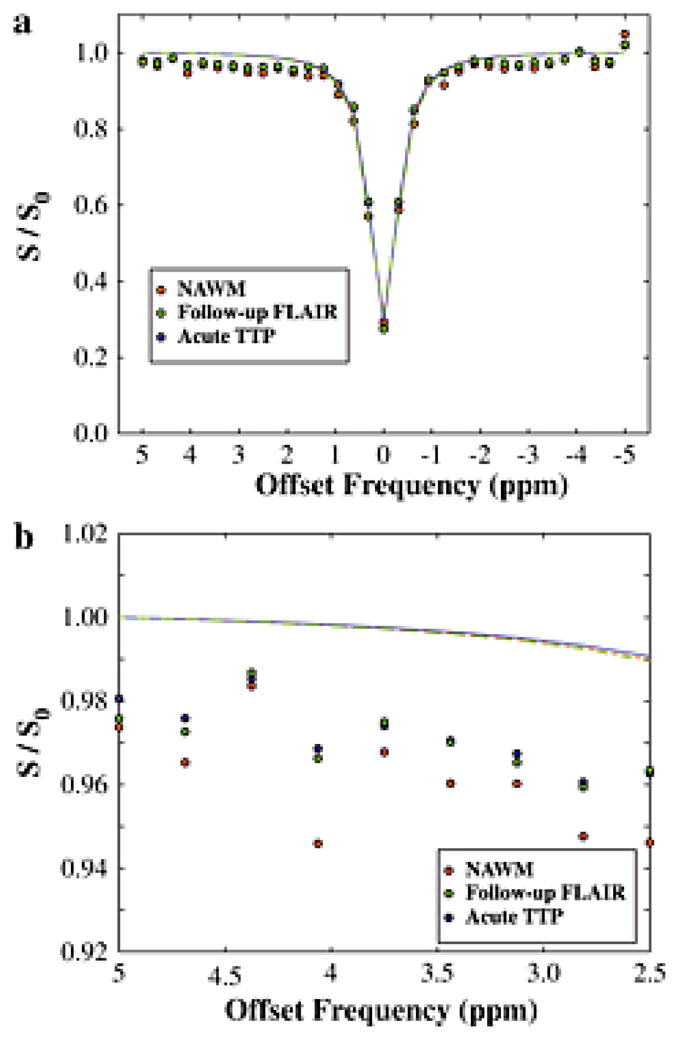
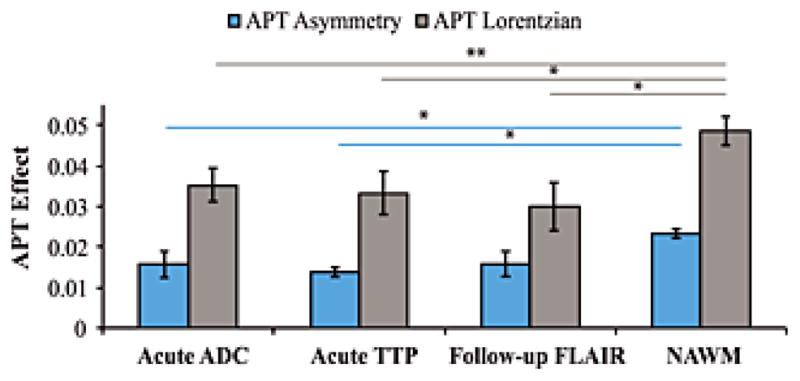
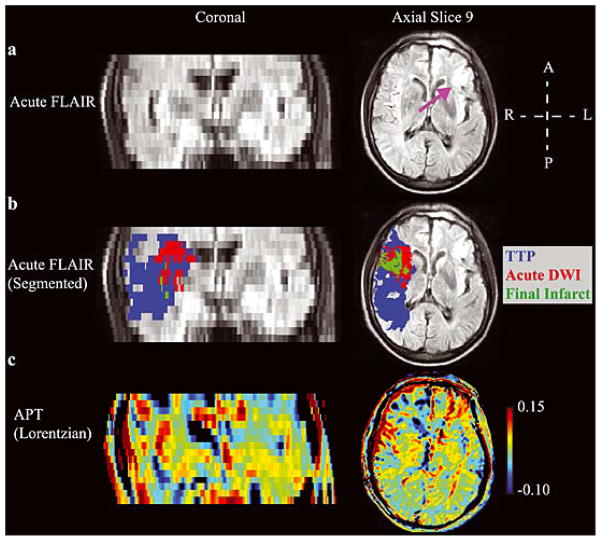
Chemical exchange saturation transfer (CEST)-derived, pH-weighted, amide proton transfer (APT) MRI has shown promise in animal studies for the prediction of infarction risk in ischemic tissue. Here, APT MRI was translated to patients with acute stroke (1-24 h post-symptom onset), and assessments of APT contrast, perfusion, diffusion, disability and final infarct volume (23-92 days post-stroke) are reported. Healthy volunteers (n = 5) and patients (n = 10) with acute onset of symptoms (0-4 h, n = 7; uncertain onset <24 h, n = 3) were scanned with diffusion- and perfusion-weighted MRI, fluid-attenuated inversion recovery (FLAIR) and CEST. Traditional asymmetry and a Lorentzian-based APT index were calculated in the infarct core, at-risk tissue (time-to-peak, TTP; lengthening) and final infarct volume. On average (mean ± standard deviation), control white matter APT values (asymmetry, 0.019 ± 0.005; Lorentzian, 0.045 ± 0.006) were not significantly different (p > 0.05) from APT values in normal-appearing white matter (NAWM) of patients (asymmetry, 0.022 ± 0.003; Lorentzian, 0.048 ± 0.003); however, ischemic regions in patients showed reduced (p = 0.03) APT effects compared with NAWM. Representative cases are presented, whereby the APT contrast is compared quantitatively with contrast from other imaging modalities. The findings vary between patients; in some patients, a trend for a reduction in the APT signal in the final infarct region compared with at-risk tissue was observed, consistent with tissue acidosis. However, in other patients, no relationship was observed in the infarct core and final infarct volume. Larger clinical studies, in combination with focused efforts on sequence development at clinically available field strengths (e.g. 3.0 T), are necessary to fully understand the potential of APT imaging for guiding the hyperacute management of patients.

Keywords: MRI; acute stroke; amide proton transfer; cerebrovascular disease; chemical exchange saturation transfer (CEST); lactate; pH; penumbra.


Conflict of interest statement

Conflict of Interest Disclosure

The authors do not have any conflict of interest to disclose with regards to the material in this manuscript.

Figures

Figure 1
Figure 1. Analysis pipeline
(a) Example of acute T2 FLuid Attenuated Inversion Recovery (T2 FLAIR), apparent diffusion coefficient (ADC), time-to-peak (TTP) and follow-up (>1 month) T2 FLAIR image. (b) Semi-automated segmentation is used to define the ischemic core, which outlines hypointensity in the acute ADC map, the at-risk tissue, defined as lengthening on the TTP map, and the final infarct volume, defined as hyperintensity on the follow-up T2 FLAIR. (c) The APT maps, calculated according to the Lorentzian and asymmetry approaches. (d) Each region is overlaid on the co-registered acute images and the mean intensity is calculated within the separate regions (acute T2 FLAIR and amide proton transfer, APT, maps shown).
Figure 2
Figure 2. Control volunteer results (n = 5)
(a) To allow for comparison between different tissue types, control data were co-registered to a standard T1-weighted atlas and gray matter (red), white matter (blue) and CSF (green) masks derived from the Harvard-Oxford Cortical Atlas were applied. (b) APT data from a representative control volunteer and from all control volunteers (mean), separately for the asymmetry and Lorentzian analysis approaches. (c) Z-spectra for the representative control volunteer and the mean of all control volunteers. On right, a magnification is show to highlight the small differences in the APT effect at 3.8–3.2 ppm (gray). The colored lines denote the Lorentzian fit to the full z-spectrum. Importantly, note that the Lorentzian fit is predominately sensitive to the data points near the water resonance where the residuals have the potential to be highest and is essentially unity near the amide resonance. (d) A boxplot showing the APT values in the different tissue types. The black line denotes the median, the upper and lower lines denote the upper 75th percentile of the data and lower 25th percentile of the data, and the whiskers extend to the remaining data points.
Figure 3
Figure 3. Simulations of expected contrast from the fast, low-power method
(a) The Lorentizan fit and corresponded simulated data shows a small reduction in signal intensity at 3.5 ppm, which is more obvious when (b) the plot is magnified. (c) Differences in the APT effect and (d) difference between the Lorentzian and simulated data for different exchange rates. Importantly, a reduction in pH will reduce the exchange rate and therefore APT effect.
Figure 4
Figure 4. Lorentzian vs. asymmetry analysis
(a) Acute FLuid Attenuated Inversion Recovery (FLAIR) and (b) the segmented regions-of-interest overlaid on the acute FLAIR image in an example patient (Patient 4; Table 1), along with the hyperacute amide proton transfer (APT) maps calculated from the (c) Lorentzian method (d) and asymmetry method. A coronal slice and two axial slices are shown. APT effects are reduced on the acutely ischemic (right) side (white arrows), as well as in regions of prior infarct (purple arrows). The Lorentzian method provides contrast more visually consistent with the pathology than does the asymmetry method, which may be attributed to intra-scan motion across offsets and concomitant MT/NOE/aliphatic contamination of the APT effect. Both methods are compared in Fig. 6.
Figure 5
Figure 5. Patient Z-spectrum
(a) The z-spectrum, along with Lorentzian fit, for the patient shown in Fig. 4. (b) Magnification of the z-spectrum in the region of the APT effect shows only a very slightly reduced APT effect in the region progressing to infarction and in the time-to-peak (TTP) lengthening region relative to normal-appearing-white-matter (NAWM). These very small effects are largely consistent in magnitude with simulation expectations (Fig. 3).
Figure 6
Figure 6. Comparison of APT analysis approaches
In 8/10 patients, the Lorentzian APT analysis was tightly correlated with the asymmetry analysis (R=0.72; P=0.02). However, in two patients the APT asymmetry analysis provided negative values that met outlier criteria (white circles; representative time-to-peak, TTP, maps shown with arrows pointing to TTP lengthened regions). As can be seen, these two patients had very small ischemic regions, suggesting the asymmetry analysis may be less reliable when considering very small regions-of-interest, likely owing to reduced SNR secondary to propagation of error arising from comparison of two data points acquired at different times.
Figure 7
Figure 7. Group results
Bar graph showing the amide proton transfer (APT) effect (separately for the asymmetry and Lorentzian approaches) for all patients in different segmented regions-of-interst. The two patients with negative asymmetry (Fig. 6) were excluded in the asymmetry analysis. In both analyses, normal appearing white matter (NAWM) gave larger APT effects than different ischemic regions (P=0.03), however no significant finding was observed between the size of the APT effect within the different ischemic regions. Error bars denote standard error. * P<0.05. **P≤0.01.
Figure 8
Figure 8. Example patient highlighting the multiple difficulties of performing APT imaging in human acute stroke patients
(a) The acute FLuid Attenuated Inversion Recovery (FLAIR) image denotes clear motion artifacts, which were observed in the majority of patients, as well as a right-sided prior infarct (purple arrow). (b) The segmentation results showing a large ischemic penumbra. In this patient, the region of diffusion weighted imaging (DWI) contrast largely co-localized with the final infarct volume (green). (c) The APT map shows less asymmetry than apparent in the patient presented in Fig. 4, which is partly consistent with more limited tissue acidosis. However, high APT values are observed in the sulcus on the right, which partial volumes with CSF. Additionally, regions of the right frontal lobe exhibit apparent reduced APT effects, yet these regions do not progress to infarct and in some instances appear to partial volume with the chronic infarct. Improved approaches for correcting motion and partial volume effects are likely required before more widespread testing of APT is pursued in acute stroke patients.

References

    1. Hacke W, Kaste M, Bluhmki E, Brozman M, Davalos A, Guidetti D, Larrue V, Lees KR, Medeghri Z, Machnig T, Schneider D, von Kummer R, Wahlgren N, Toni D. Thrombolysis with alteplase 3 to 4. 5 hours after acute ischemic stroke. The New England journal of medicine. 2008;359(13):1317–1329. - PubMed
    1. Wechsler LR. Intravenous thrombolytic therapy for acute ischemic stroke. The New England journal of medicine. 2011;364(22):2138–2146. - PubMed
    1. Hesselmann V, Niederstadt T, Dziewas R, Ritter M, Kemmling A, Maintz D, Koehler M, Seifarth H, Jacobs AH, Ringelstein EB, Heindel W. Reperfusion by combined thrombolysis and mechanical thrombectomy in acute stroke: effect of collateralization, mismatch, and time to and grade of recanalization on clinical and tissue outcome. AJNR Am J Neuroradiol. 2012;33(2):336–342. - PMC - PubMed
    1. Broderick JP, Palesch YY, Demchuk AM, Yeatts SD, Khatri P, Hill MD, Jauch EC, Jovin TG, Yan B, Silver FL, von Kummer R, Molina CA, Demaerschalk BM, Budzik R, Clark WM, Zaidat OO, Malisch TW, Goyal M, Schonewille WJ, Mazighi M, Engelter ST, Anderson C, Spilker J, Carrozzella J, Ryckborst KJ, Janis LS, Martin RH, Foster LD, Tomsick TA. Endovascular therapy after intravenous t-PA versus t-PA alone for stroke. The New England journal of medicine. 2013;368(10):893–903. - PMC - PubMed
    1. Fiehler J, Foth M, Kucinski T, Knab R, von Bezold M, Weiller C, Zeumer H, Rother J. Severe ADC decreases do not predict irreversible tissue damage in humans. Stroke. 2002;33(1):79–86. - PubMed

Publication types