. 2014 Feb;42(4):2245-56.
doi: 10.1093/nar/gkt1236. Epub 2013 Nov 27.

Establishment of active chromatin structure at enhancer elements by mixed-lineage leukemia 1 to initiate estrogen-dependent gene expression

Affiliations

Establishment of active chromatin structure at enhancer elements by mixed-lineage leukemia 1 to initiate estrogen-dependent gene expression

Kwang Won Jeong et al. Nucleic Acids Res. 2014 Feb.

Abstract

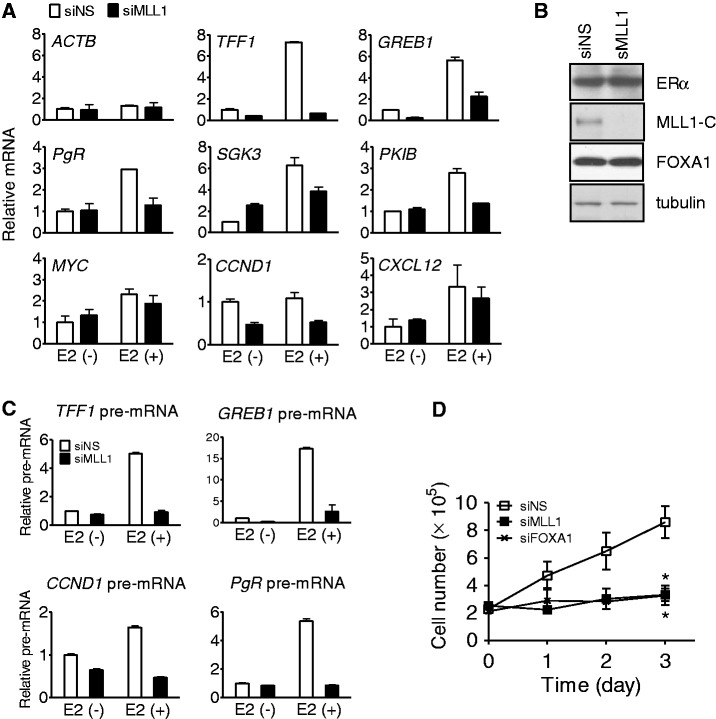
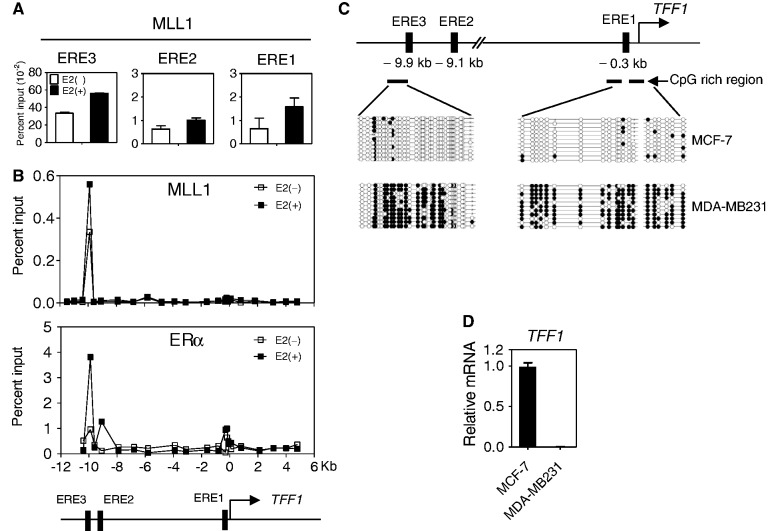
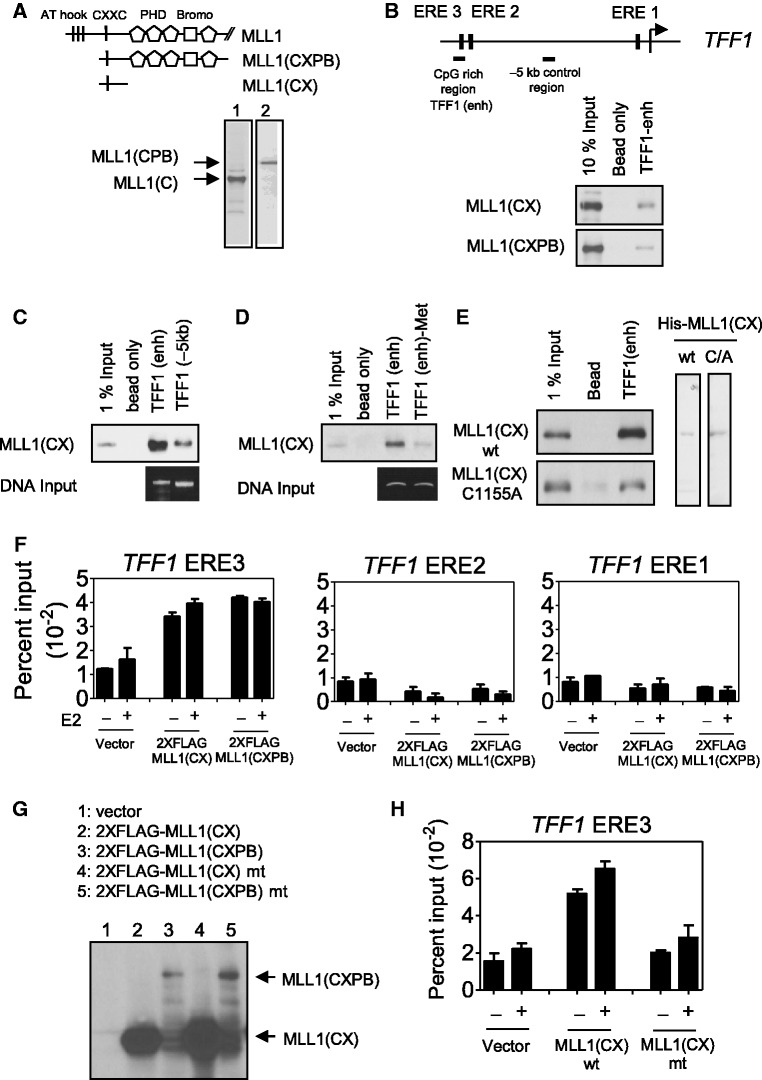
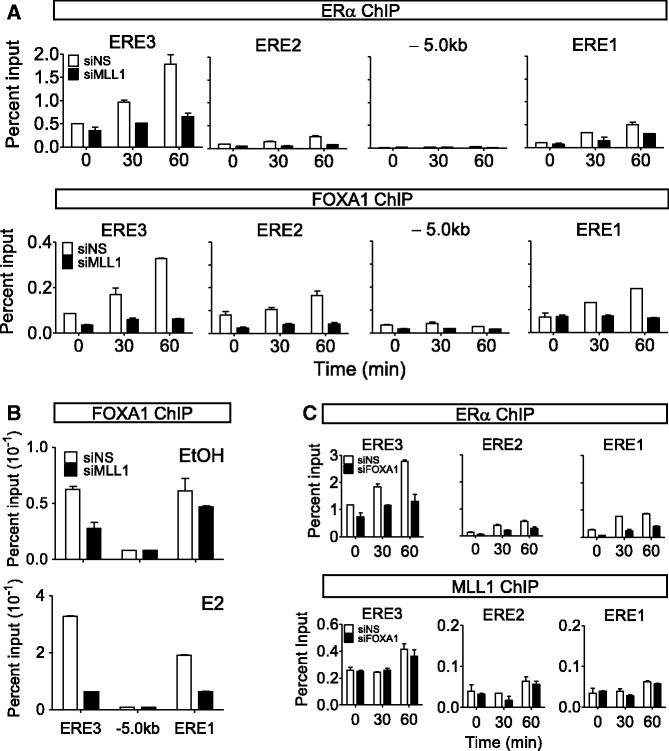
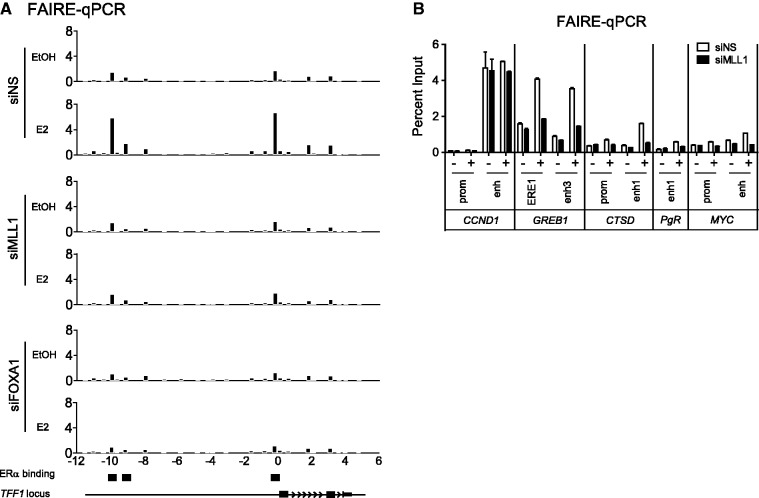
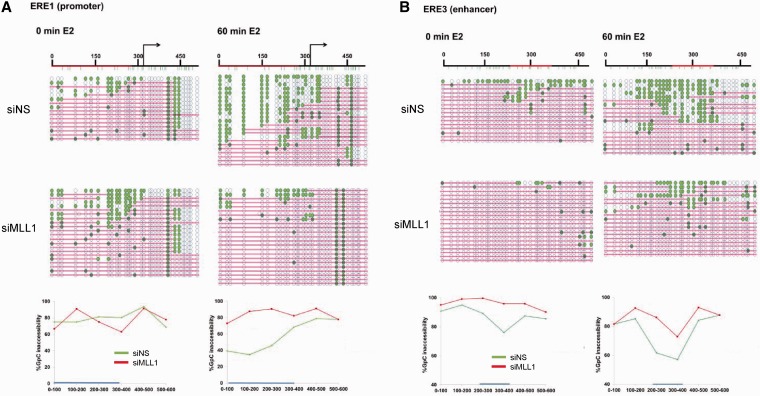
A number of genome-wide analyses have revealed that estrogen receptor α binding to and regulation of its target genes correlate with binding of FOXA1, a pioneer factor, to nearby DNA sites in MCF-7 breast cancer cells. The enhancer element-specific histone H3K4me1/2 mark is enriched at the specific FOXA1/ERα recruitment sites in chromatin, but the mechanism by which these enhancer marks are established in chromatin before hormone treatment is unclear. Here, we show that mixed-lineage leukemia 1 (MLL1) protein is a key determinant that maintains permissive chromatin structure of the TFF1 enhancer region. MLL1 occupies the TFF1 enhancer region and methylates H3K4 before hormone stimulation. In vitro, MLL1 binds directly to the CpG-rich region of the TFF1 enhancer, and its binding is dependent on hypomethylation of DNA. Furthermore, the depletion of MLL1 in MCF-7 cells results in a dramatic decrease of chromatin accessibility and recruitment of FOXA1 and ERα to the enhancer element. Our study defines the mechanism by which MLL1 nucleates histone H3K4 methylation marks in CpG-enriched regions to maintain permissive chromatin architecture and allow FOXA1 and estrogen receptor α binding to transcriptional regulatory sites in breast cancer cells.


Figures

Figure 1.
Figure 1.
Requirement of MLL1 for the expression of endogenous ERα target genes and cell proliferation. (A) Effect of reduced MLL1 on the expression of estrogen-responsive genes. MCF-7 cells were transfected with siRNA against MLL1 (siMLL1) or non-specific siRNA (siNS), and treated with E2 (10 nM) for 16 h before harvest. Total RNA was analyzed by qRT-PCR. Levels of all mRNAs were normalized to that of GAPDH mRNA; β-actin mRNA served as a control that was unaffected by E2 or by siMLL1. (B) Depletion of MLL1 protein by siRNA transfection. MCF-7 cells were transfected with siMLL1 or siNS as in (A) and grown in hormone-free media for 72 h. Levels of ERα, tubulin and C-terminal cleavage of MLL1 (MLL1-C) were assessed by immunoblotting. (C) The pre-mRNA levels in the MCF-7 cells transfected with siNS or siMLL1 were measured by qRT-PCR using primers spanning the 3′ end of exon 1 and the 5′ end of intron 1 of each gene. Cells were treated for 8 h with 10 nM E2. Results shown are the mean and range of variation of duplicate PCR reactions performed on the same cDNA sample; the results are from a single experiment that is representative of at least two independent experiments. (D) Cell proliferation was performed in MCF-7 cells transfected with siNS or siMLL1 and then cultured for 3 days in normal media supplemented with 10% fetal bovine serum. Cells transfected with siFOXA1 were used as a positive control. The data are the mean of independent replicates ± S.D.
Figure 2.
Figure 2.
Recruitment of MLL1 to the hypomethylated CpG-rich enhancer region of the TFF1 gene. (A) ChIP assays were performed with MCF-7 cells treated with E2 (100 nM) or ethanol for 1 h. The amount of the indicated regions surrounding the three TFF1 ER binding sites precipitated by MLL1 antibody was determined by qPCR. Results shown are the mean and range of variation of duplicate PCR reactions performed on the same DNA sample. Results were expressed as percent of input chromatin (before immunoprecipitation) and were derived from a single experiment, which is representative of at least two independent experiments. (B) ChIP scanning of the TFF1 locus. DNA precipitated with the indicated antibody was analyzed by qPCR with primer sets spaced at 1-kb intervals and spanning the region from −10 to +5 kb relative to the TSS (designated by a horizontal arrow in the diagram) of the TFF1 gene. Primer sequences for ChIP scanning are available on request. (C) The TFF1 gene displays cell type-specific methylation patterns. The DNA methylation of the TFF1 promoter and enhancer regions in MCF-7 and MDA-MB231 cells was analyzed by bisulfite sequencing. Filled and open circles represent methylated and unmethylated CpG sites, respectively. Schematic diagrams of the TFF1 promoter and enhancer regions are shown. CpG-rich regions were determined by CpG Island Searcher. (D) mRNA levels of TFF1 was determined in MCF-7 and MDA-MB231 cells grown in normal media.
Figure 3.
Figure 3.
Direct interaction of MLL1 with the unmethylated CpG region of TFF1 gene. (A) Expression of truncated MLL1 fragment containing CXXC motif only (MLL1-CX), or CXXC motif, three PHD domains and one Bromodomain (MLL1-CXPB) in 293T cells. (B) The DNA-pull down assay was performed using total cell lysate of 293T cells transfected with FLAG-tagged MLL1-CX or MLL1-CXPB and incubated with biotinylated genomic PCR product of the CpG-rich region of the TFF1 enhancer region bound to streptavidin-Sepharose beads. Bound proteins were analyzed by immunoblotting with anti-FLAG antibody. (C) FLAG-tagged MLL1-CX was incubated with biotinylated genomic PCR product of the CpG-rich TFF1 enhancer region or the −5 kb control region bound to streptavidin-Sepharose beads. (D) The biotinylated CpG-rich enhancer region of TFF1 gene was methylated in vitro using the CpG Methyltransferase (M.SssI), immobilized on streptavidin-agarose beads and then incubated with MLL1-CX proteins. (E) Recombinant wild-type (wt) MLL1-CX or MLL1-CX with mutation (Cys1155 to Ala) in CXXC motif were tested for binding to the biotinylated CpG-rich region of TFF1 enhancer. (F) FLAG-tagged MLL1-CX or MLL1-CXPB was transiently expressed in the MCF-7 cells, which were then grown in hormone-free media for 48 h and then treated with 100 nM E2 for 1 h before performing the ChIP assay with anti-FLAG antibody. Precipitated DNA was analyzed by qPCR with primers representing the ER binding sites of the TFF1 genes. (G) The expression of MLL1-CX or MLL1-CXPB in the MCF-7 cells was monitored by immunoblotting using antibodies against the FLAG epitope. (H) FLAG-tagged wild-type MLL1-CX or AXXC mutant was transiently expressed in the MCF-7 cells. After E2 treatment for 1 h, the ChIP assay was performed with anti-FLAG antibody. The precipitated DNA was analyzed by qPCR using primers representing the ERE3 site of the TFF1 gene.
Figure 4.
Figure 4.
Effect of MLL1 depletion on the recruitment of ERαand FOXA1 to TFF1 EREs. (A-C) ChIP assays were performed as detailed in Figure 2 after transfection with siNS, siMLL1 or siFOXA1. The MCF-7 cells were treated with E2 (100 nM) or ethanol for the indicated times (A, C) or 60 min (B). The amount of the indicated region of the TFF1 gene precipitated by ERα, MLL1 or FOXA1 antibodies was determined by qPCR.
Figure 5.
Figure 5.
MLL1 is required for open chromatin structure. (A) Chromatin accessibility at the TFF1 locus was assessed by FAIRE-qPCR analysis using chromatin samples prepared from the MCF-7 cells transfected with siNS, siMLL1 or siFOXA1. Data are normalized against non–cross-linked genomic DNA for each primer pair. (B) The FAIRE-qPCR analysis was performed at the promoter and enhancer regions of CCND1, GREB1, CTSD, PgR and MYC in MLL1-depleted or control MCF-7 cells treated with E2 or ethanol for 60 min.
Figure 6.
Figure 6.
Nucleosome occupancy of the TFF1 enhancer is regulated by MLL1. (A and B) Nucleosome occupancy at the TFF1 promoter and enhancer was analyzed by NOMe-seq in siNS transfected or MLL1-depleted MCF-7 cells. Blue circles represent GpC sites of the DNA (unfilled blue circles represent GpC sites that are inaccessible to GpC methyltransferase; teal-filled circles represent cytosines accessible to GpC methyltransferase). Pink bars represent regions of inaccessibility large enough to accommodate a nucleosome (∼150 bp).

References

    1. Birney E, Stamatoyannopoulos JA, Dutta A, Guigo R, Gingeras TR, Margulies EH, Weng Z, Snyder M, Dermitzakis ET, Thurman RE, et al. Identification and analysis of functional elements in 1% of the human genome by the ENCODE pilot project. Nature. 2007;447:799–816. - PMC - PubMed
    1. Heintzman ND, Stuart RK, Hon G, Fu Y, Ching CW, Hawkins RD, Barrera LO, Van Calcar S, Qu C, Ching KA, et al. Distinct and predictive chromatin signatures of transcriptional promoters and enhancers in the human genome. Nat. Genet. 2007;39:311–318. - PubMed
    1. Koch CM, Andrews RM, Flicek P, Dillon SC, Karaoz U, Clelland GK, Wilcox S, Beare DM, Fowler JC, Couttet P, et al. The landscape of histone modifications across 1% of the human genome in five human cell lines. Genome Res. 2007;17:691–707. - PMC - PubMed
    1. Zentner GE, Tesar PJ, Scacheri PC. Epigenetic signatures distinguish multiple classes of enhancers with distinct cellular functions. Genome Res. 2011;21:1273–1283. - PMC - PubMed
    1. Rada-Iglesias A, Bajpai R, Swigut T, Brugmann SA, Flynn RA, Wysocka J. A unique chromatin signature uncovers early developmental enhancers in humans. Nature. 2010;470:279–283. - PMC - PubMed

Publication types