. 2014 Jan;42(Database issue):D633-42.
doi: 10.1093/nar/gkt1244. Epub 2013 Nov 27.

Ribosomal Database Project: data and tools for high throughput rRNA analysis

Affiliations

Ribosomal Database Project: data and tools for high throughput rRNA analysis

James R Cole et al. Nucleic Acids Res. 2014 Jan.

Abstract

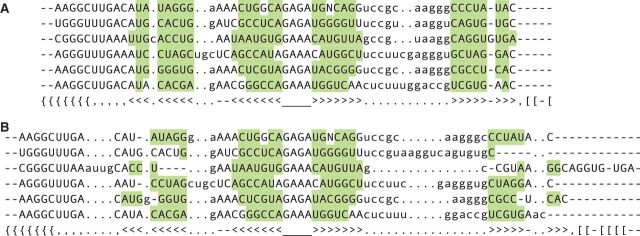
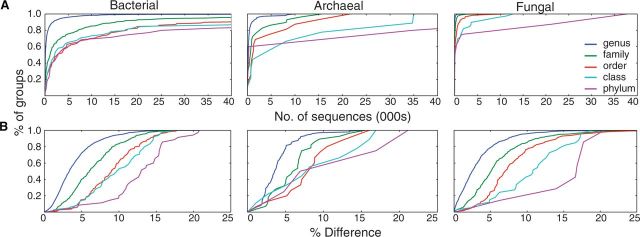
Ribosomal Database Project (RDP; http://rdp.cme.msu.edu/) provides the research community with aligned and annotated rRNA gene sequence data, along with tools to allow researchers to analyze their own rRNA gene sequences in the RDP framework. RDP data and tools are utilized in fields as diverse as human health, microbial ecology, environmental microbiology, nucleic acid chemistry, taxonomy and phylogenetics. In addition to aligned and annotated collections of bacterial and archaeal small subunit rRNA genes, RDP now includes a collection of fungal large subunit rRNA genes. RDP tools, including Classifier and Aligner, have been updated to work with this new fungal collection. The use of high-throughput sequencing to characterize environmental microbial populations has exploded in the past several years, and as sequence technologies have improved, the sizes of environmental datasets have increased. With release 11, RDP is providing an expanded set of tools to facilitate analysis of high-throughput data, including both single-stranded and paired-end reads. In addition, most tools are now available as open source packages for download and local use by researchers with high-volume needs or who would like to develop custom analysis pipelines.


Figures

Figure 1.
Figure 1.
Gene coverage: number of sequences from RDP release 11.1 covering the indicated positions on the reference sequence. (A) Bacterial SSU rRNA gene. Positions relative to Escherichia coli sequence GenBank accession J01695.1. Gray bars indicate variable regions (1). (B) Archaeal SSU rRNA gene. Positions relative to E. coli sequence GenBank accession J01695.1. (C) Fungal LSU rRNA gene. Positions relative to S. cerevisiae GenBank accession NC_001144.5 LSU gene. D1 and D2 indicate hypervariable regions initially used for discrimination among Fusarium spp. (2). The D2 region is among the most highly variable eukaryotic LSU regions in terms of both length and structure (3). Such high diversity may improve the performance of the RDP Classifier when discriminating between closely related genera. Gene coverage charts are available online and updated with each incremental RDP release.
Figure 2.
Figure 2.
Multiple sequence alignment of partial bacterial 16S rRNA sequences corresponding to the region between common V6 variable region amplification primers (15). Uppercase columns correspond to modeled positions. Lowercase columns correspond to regions where hypervariability in size and structure preclude assignment of homologous residues. These columns are normally ‘masked out’ before phylogenetic analysis. (A) Using the new RDP 11 alignment model. This matches the alignment for this region obtained with full-length sequences. (B) Using the RDP 10 alignment model. The alignment of the full-length sequences is almost identical in this V6 region between the two models, except one G-U pair in RDP 11 appears as inserts in the RDP 10 alignment. Bases highlighted in green color are canonical base pairs matching the conserved secondary structure. From top to bottom, the GenBank accessions are AB006164, AB006178, AB021164, AB015577, AB003932 and AB004715.
Figure 3.
Figure 3.
Accumulation curves showing (A) taxon size and (B) intra-taxon distance. All aligned sequences in RDP release 11.1 in each of the three RDP collections were clustered as described. The average distance between pairs of sequences in a taxon is shown in (B). The shape of the phylum curves, and to a lesser extent class curves, for archaea and fungi, are likely influenced by the small number of taxa and the skewed representation of sequences in these taxa.
Figure 4.
Figure 4.
Comparing per base error rates for three paired-end read assembly tools. The error rates were calculated using assembled reads filtered by either read Q score (Assembler and original PANDAseq; 38) or delta Q score (mothur; 39). Recommended read Q score of 27 for Assembler and base Q score (deltaq) of 6 for mothur are marked. (A) Sample M_20130714 and (B) Sample M_20130819.

Similar articles

Cited by

References

    1. Neefs JM, Van de Peer Y, De Rijk P, Chapelle S, De Wachter R. Compilation of small ribosomal subunit RNA structures. Nucleic Acids Res. 1993;21:3025–3049. - PMC - PubMed
    1. Guadet J, Julien J, Lafay JF, Brygoo Y. Phylogeny of some Fusarium species, as determined by large-subunit rRNA sequence comparison. Mol. Biol. Evol. 1989;6:227–242. - PubMed
    1. Schnare MN, Damberger SH, Gray MW, Gutell RR. Comprehensive comparison of structural characteristics in Eukaryotic cytoplasmic large subunit (23S-like) ribosomal RNA. J. Mol. Biol. 1996;256:701–719. - PubMed
    1. Liu K-L, Porras-Alfaro A, Kuske CR, Eichorst S, Xie G. Accurate, rapid taxonomic classification of fungal large subunit rRNA genes. Appl. Environ. Microbiol. 2012;78:1523–1533. - PMC - PubMed
    1. Nakamura Y, Cochrane G, Karsch-Mizrachi I International Nucleotide Sequence Database Collaboration. The International Nucleotide Sequence Database Collaboration. Nucleic Acids Res. 2013;41:D21–D24. - PMC - PubMed

Publication types

Substances