. 2014 Feb;42(4):2736-49.
doi: 10.1093/nar/gkt1171. Epub 2013 Nov 27.

Mapping Hfq-RNA interaction surfaces using tryptophan fluorescence quenching

Affiliations

Mapping Hfq-RNA interaction surfaces using tryptophan fluorescence quenching

Kirsten E Robinson et al. Nucleic Acids Res. 2014 Feb.

Abstract

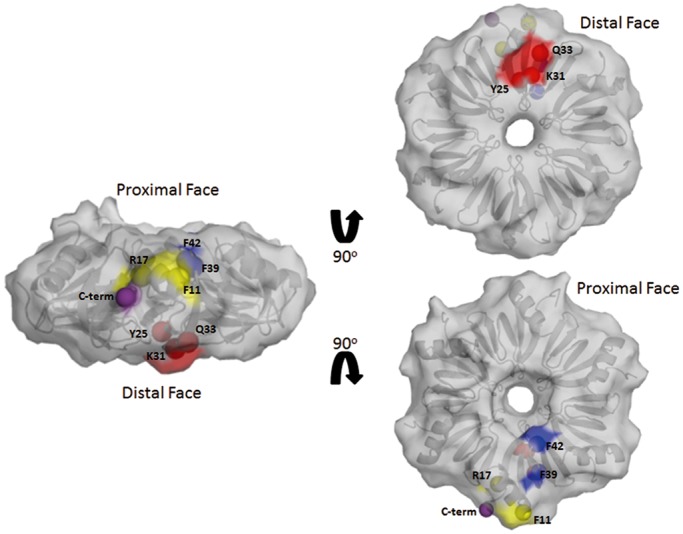
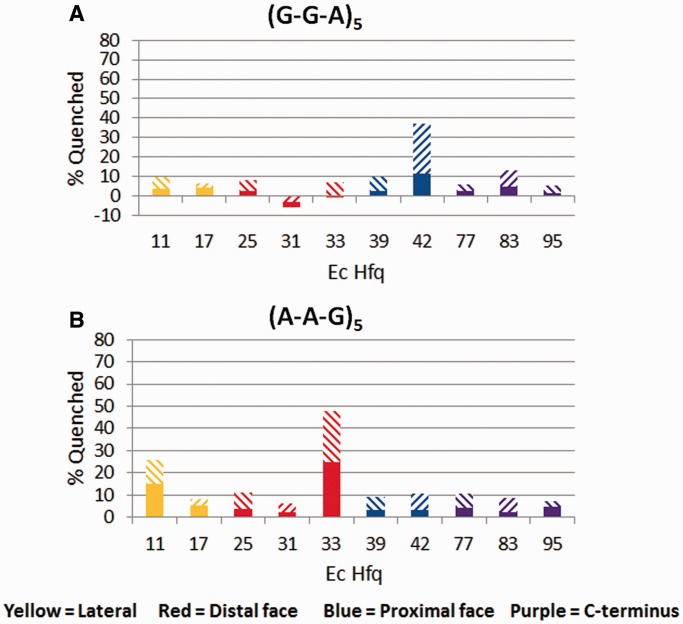
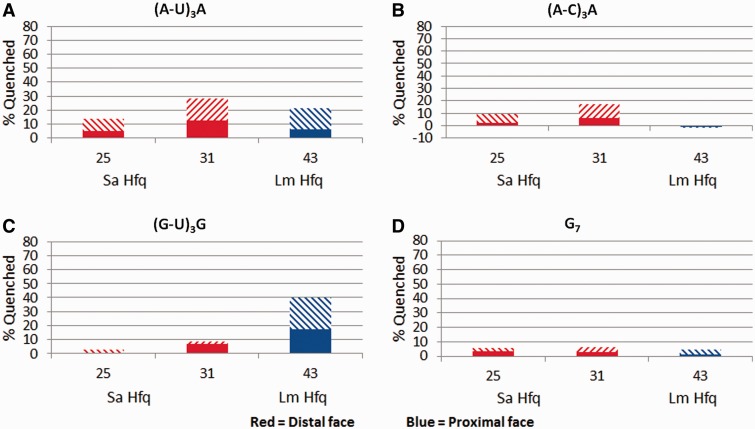
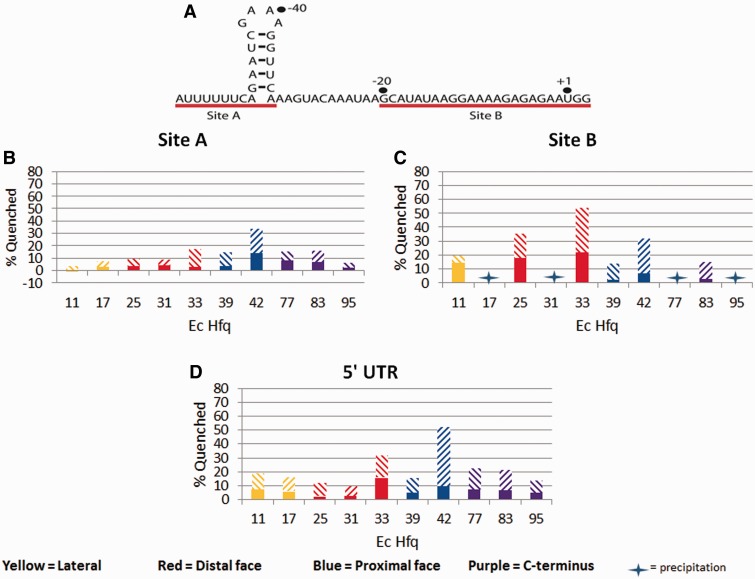
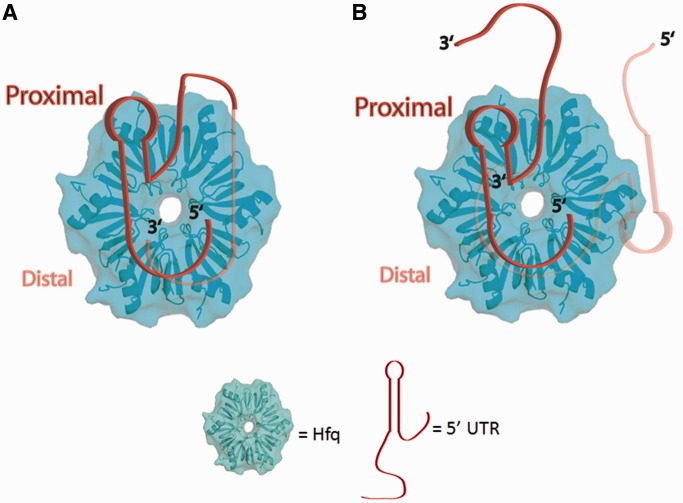
Hfq is a posttranscriptional riboregulator and RNA chaperone that binds small RNAs and target mRNAs to effect their annealing and message-specific regulation in response to environmental stressors. Structures of Hfq-RNA complexes indicate that U-rich sequences prefer the proximal face and A-rich sequences the distal face; however, the Hfq-binding sites of most RNAs are unknown. Here, we present an Hfq-RNA mapping approach that uses single tryptophan-substituted Hfq proteins, all of which retain the wild-type Hfq structure, and tryptophan fluorescence quenching (TFQ) by proximal RNA binding. TFQ properly identified the respective distal and proximal binding of A15 and U6 RNA to Gram-negative Escherichia coli (Ec) Hfq and the distal face binding of (AA)3A, (AU)3A and (AC)3A to Gram-positive Staphylococcus aureus (Sa) Hfq. The inability of (GU)3G to bind the distal face of Sa Hfq reveals the (R-L)n binding motif is a more restrictive (A-L)n binding motif. Remarkably Hfq from Gram-positive Listeria monocytogenes (Lm) binds (GU)3G on its proximal face. TFQ experiments also revealed the Ec Hfq (A-R-N)n distal face-binding motif should be redefined as an (A-A-N)n binding motif. TFQ data also demonstrated that the 5'-untranslated region of hfq mRNA binds both the proximal and distal faces of Ec Hfq and the unstructured C-terminus.


Figures

Figure 1.
Figure 1.
Surface representation of the WT Ec Hfq structure and the positions of the tryptophan-substituted residues. Highlighted in red are residues on the distal face that were mutated to tryptophan (Trp); in yellow are the lateral residues that were mutated to Trp, in blue the proximal face residues that were mutated to Trp and in purple the position to indicate the beginning to the C-terminal 44 residues of Ec Hf. A cartoon of the underlying hexamer is shown in grey. PDB accession number for the WT Ec Hfq structure is 1HK9 (33).
Figure 2.
Figure 2.
Representative intrinsic TFQ titration experiment. To provide the initial value of tryptophan fluorescence, 1 μM Hfq mutant F42W in the absence of RNA was excited at 298 nm and the emission scanned from 320–400 nm. The maximum fluorescence intensity is found at 343 nm (denoted by a solid vertical red line). RNA quenching of the tryptophan fluorescence is calculated by measuring the intensity differences at wavelength 343 nm after addition of an RNA aliquot, employing the equation Quenching (%) = (1 − ((FR−FB)/(F0−FB))) × 100, and carrying out the appropriate corrections as described in the ‘Materials and Methods’ section.
Figure 3.
Figure 3.
Control TFQ experiments for Ec, Sa and Lm Hfq Trp mutants using A15, a distal face-binding RNA, or U6, a proximal face-binding RNA. Panels (A) (left) and (B) (left) show A15 quenching of Ec and Sa/Lm Hfq Trp mutants, respectively. Panels (A) (right) and (B) (right) show U6 quenching of Ec and Sa/Lm Hfq Trp mutants, respectively. The x-axis labels under each bar graph refer to the tryptophan-substituted residue within that Hfq protein. The percent quenching is shown on the y-axis. The bar graphs are coloured by location on Hfq as shown in Figure 1. The solid bar represents the percent quenching by 1 µM RNA while the diagonal striped bar above the solid bar represents the percent quenching by 4 µM RNA. (C) A sequence alignment of the Sa and Lm Hfq proteins. The key proximal-face U6 binding residues Sa Y42 and Lm F43 are boxed. Identical residues between the two proteins are shown below the alignment.
Figure 4.
Figure 4.
(A) Overlays of the structures of WT Ec Hfq and distal (Y25W), lateral (F11W), proximal edge (F39W) and proximal pore (F42W) Hfq tryptophan mutants. All proteins are shown as cartoons with WT Hfq coloured cyan, Y25W coloured green, F11W coloured red, F39W coloured yellow and F42W coloured blue. The calculated RMSD (listed within the grey box) reveals that each mutation does not affect the protomeric structures significantly. (B) Two close up views of the overlay of the structures of the WT Ec Hfq bound to A15 (blue carbon sticks) and the (Y25W) distal face mutation (green carbon sticks) near the position of the substitution and R-site. Y25W takes two conformations, one of which occurs in 2 out of 6 protomers (left). This conformation would block adenine insertion into the R-site (red box). The second conformation (right) occurs in 5 out of 6 protomers and allows base stacking with adenine. However the 2′ oxygen of the ribose clashes with the indole ring (red arc), requiring adjustment of either the phosphodiester or polypeptide backbone or both to relieve the clash. These two structural problems are likely the cause for the significant reduction in A15 binding to this distal face mutant. (C) Close up of the area about the β2 and β5 strands after overlaying WT Ec Hfq and the F11W hexamers. The two major conformational differences between the F11W protein and WT Hfq are enclosed within the red boxes with position 11 shown and numbered in the rightmost figure.
Figure 5.
Figure 5.
TFQ of Ec Hfq by two (A-R-N)n motif RNAs. (A) TFQ by (GGA)5. (B) TFQ by (AAG)5. The x-axis labels under each bar graph refer to the tryptophan-substituted residue within that Hfq protein. The percent quenching is shown on the y-axis. The bar graphs are coloured by location on Hfq and are defined at the bottom of the figure. The solid bar represents the percent quenching by 1 µM RNA, while the diagonal bar above the solid bar represents the observed quenching by 4 µM RNA.
Figure 6.
Figure 6.
TFQ of Sa or Lm Hfq by (R-L)n motif containing RNAs. (A) TFQ by (AU)3 A. (B) TFQ by (AC)3 A. (C) TFQ by (GU)3 G. (D) TFQ by (G7). The x-axis labels under each bar graph refer to the tryptophan-substituted residue within that Hfq protein. The percent quenching is shown on the y-axis. The bar graphs are coloured by location on Hfq and are defined at the bottom of the figure. The solid bar represents the percent quenching by 1 µM RNA, while the diagonal bar above the solid bar represents the observed quenching by 4 µM RNA.
Figure 7.
Figure 7.
TFQ of Ec Hfq by the 5′-UTR of hfq mRNA and its Site A and Site B components. (A) The sequence and proposed secondary structure of the 5′-UTR of Ec hfq mRNA. The red lines identify the previously identified Site A, which includes a hairpin structure, and the AG-rich Site B Hfq binding sites. (B) TFQ by hfq mRNA site A. (C) TFQ by hfq mRNA site B. (D) TFQ by the 5′-UTR of hfq mRNA. The x-axis labels under each bar graph refer to the tryptophan-substituted residue within that Hfq protein The percent quenching is shown on the y-axis. The bar graphs are coloured by location on Hfq and are defined at the bottom of the figure. The solid bar represents the percent quenching by 1 µM RNA, while the diagonal bar above the solid bar represents the percent quenching by 4 µM RNA.
Figure 8.
Figure 8.
Potential models for Ec Hfq binding to the 5′-UTR of hfq mRNA. (A) hfq mRNA binding such that a single mRNA uses all sets of identified binding sites to interact with both faces of Ec Hfq with the linker between the two binding sites wrapping around the outside of the Hfq hexamer. (B) Two hfq mRNA binding to the proximal and distal faces of a single Hfq hexamer. The 5′-UTR of the hfq mRNA is shown as a ribbon with its 5′ and 3′ ends labelled. The 5′ end of the mRNA contains Site A, which should wrap about the proximal pore and lead to the rim/lateral surface. The 3′ end of the mRNA contains Site B, which has a preference for the distal face and C-terminal region of Hfq. The 5′-UTR of the hfq mRNA is modelled onto a surface rendering of Hfq generated in Pymol using PDB ID: 1HK9 (33).

Similar articles

Cited by

References

    1. Sun X, Zhulin I, Wartell RM. Predicted structure and phyletic distribution of the RNA-binding protein Hfq. Nucleic Acids Res. 2002;30:3662–3671. - PMC - PubMed
    1. Valentin-Hansen P, Eriksen M, Udesen C. The bacterial Sm-like protein Hfq: a key player in RNA transactions. Mol. Microbiol. 2004;51:1525–1533. - PubMed
    1. Tsui HC, Leung HC, Winkler ME. Characterization of broadly pleiotropic phenotypes caused by an hfq insertion mutation in Escherichia coli K-12. Mol. Microbiol. 1994;13:35–49. - PubMed
    1. De Lay N, Schu DJ, Gottesman S. Bacterial small RNA-based negative regulation: Hfq and its accomplices. J. Biol. Chem. 2013;288:7996–8003. - PMC - PubMed
    1. Mura C, Randolph PS, Patterson J, Cozen AE. Archaeal and eukaryotic homologs of Hfq: a structural and evolutionary perspective on Sm function. RNA Biol. 2013;10:636–651. - PMC - PubMed

Publication types