. 2013 Oct 27:2013:512313.
doi: 10.1155/2013/512313. eCollection 2013.

Immigrant health inequalities in the United States: use of eight major national data systems

Affiliations

Immigrant health inequalities in the United States: use of eight major national data systems

Gopal K Singh et al. ScientificWorldJournal. .

Abstract

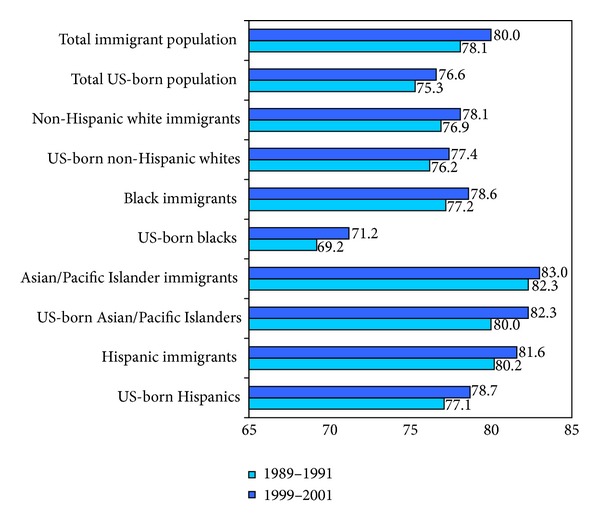
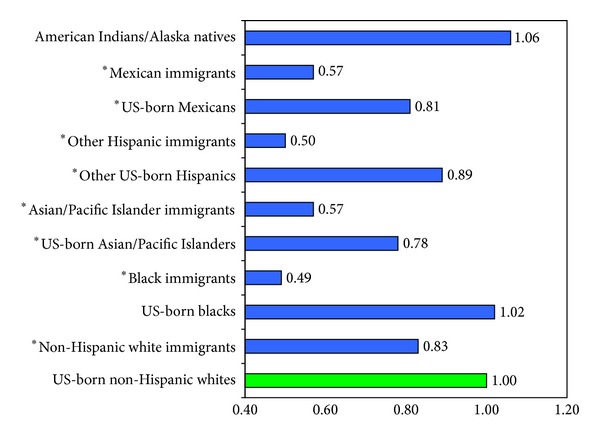
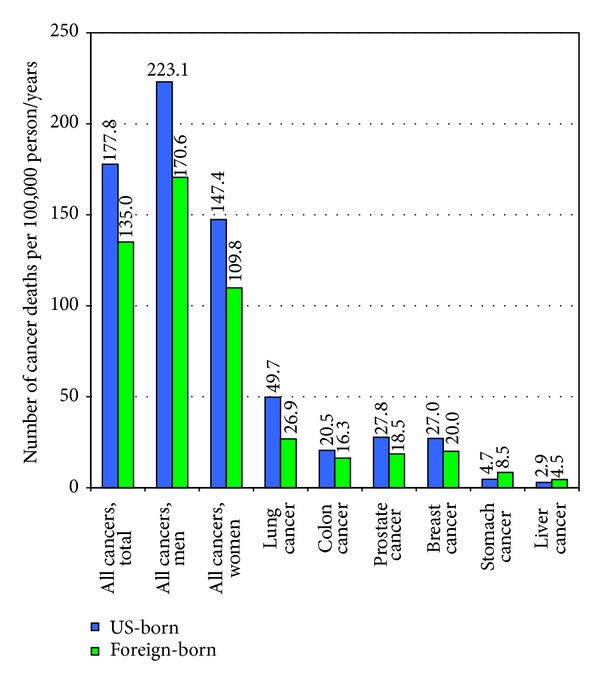
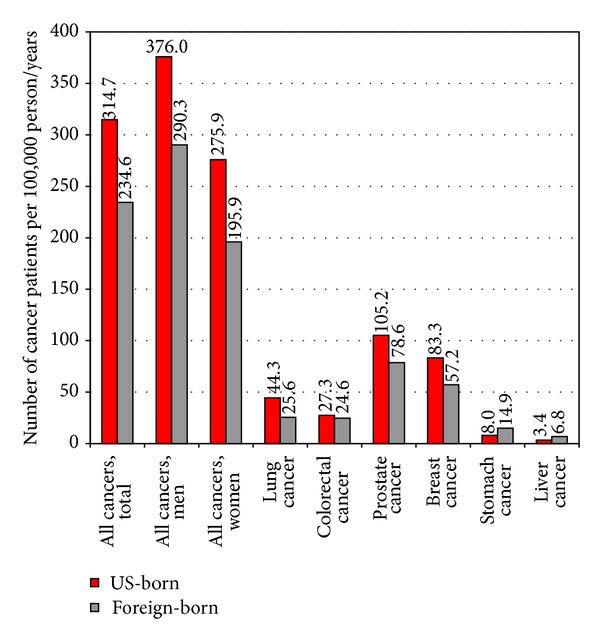
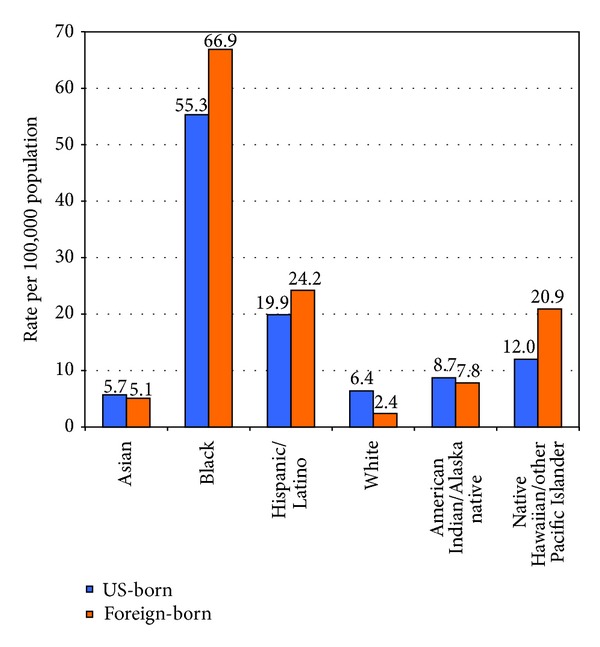
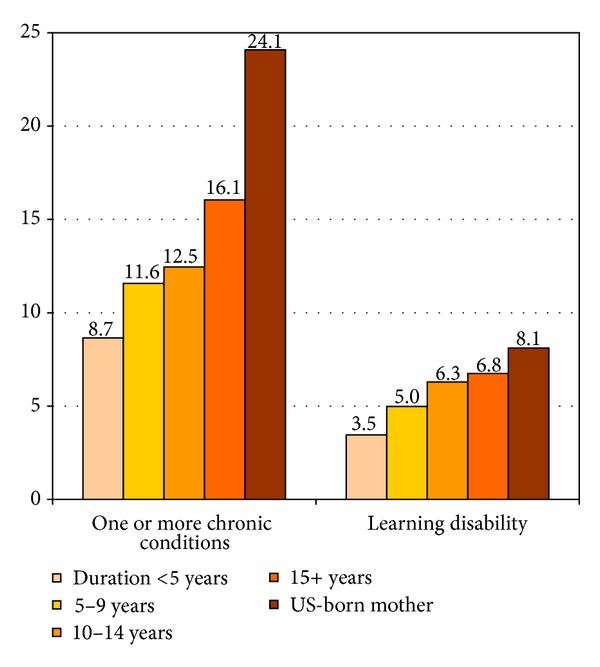
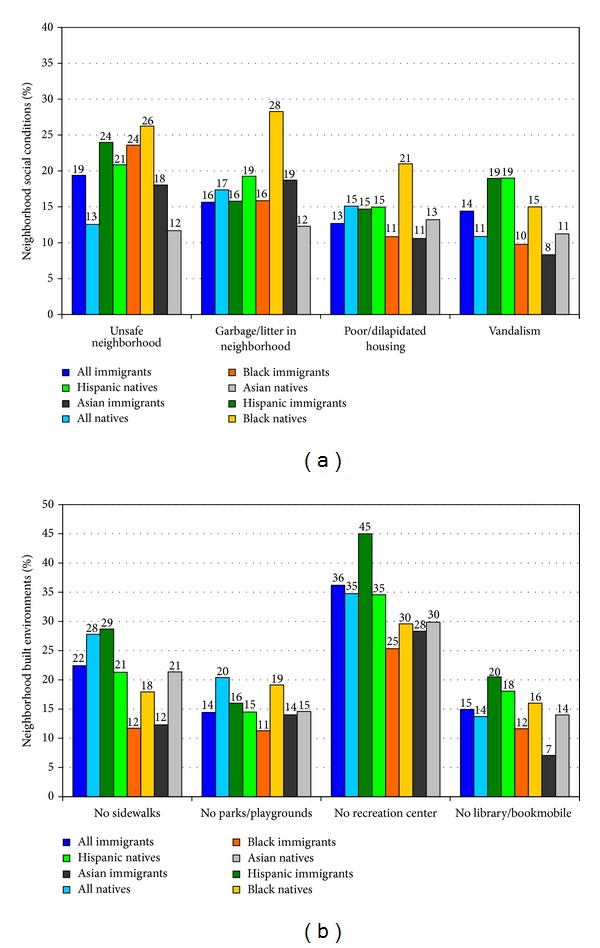
Eight major federal data systems, including the National Vital Statistics System (NVSS), National Health Interview Survey (NHIS), National Survey of Children's Health, National Longitudinal Mortality Study, and American Community Survey, were used to examine health differentials between immigrants and the US-born across the life course. Survival and logistic regression, prevalence, and age-adjusted death rates were used to examine differentials. Although these data systems vary considerably in their coverage of health and behavioral characteristics, ethnic-immigrant groups, and time periods, they all serve as important research databases for understanding the health of US immigrants. The NVSS and NHIS, the two most important data systems, include a wide range of health variables and many racial/ethnic and immigrant groups. Immigrants live 3.4 years longer than the US-born, with a life expectancy ranging from 83.0 years for Asian/Pacific Islander immigrants to 69.2 years for US-born blacks. Overall, immigrants have better infant, child, and adult health and lower disability and mortality rates than the US-born, with immigrant health patterns varying across racial/ethnic groups. Immigrant children and adults, however, fare substantially worse than the US-born in health insurance coverage and access to preventive health services. Suggestions and new directions are offered for improvements in health monitoring and for strengthening and developing databases for immigrant health assessment in the USA.


Figures

Figure 1
Figure 1
Life expectancy at birth (average lifetime in years) by race/ethnicity and immigrant status, United States, 1989–2001. Source: based on data from the US National Vital Statistics System, 1989–2001. Also, see [7].
Figure 2
Figure 2
Ethnic-immigrant differentials in US all-cause mortality (hazard ratio or relative risk): The US National Longitudinal Mortality Study, 1980–1998 (N = 304, 594). Adjusted by Cox regression for age, sex, marital status, household size, education, family income, employment status, and rural/urban residence. *P < 0.05. US-born non-Hispanic whites were the reference group. Source: updated analysis of data presented [32].
Figure 3
Figure 3
Site-specific US cancer mortality rates by nativity/immigrant status: The US National Longitudinal Mortality Study, 1980–1998 (N = 304, 594). Mortality rates are age-adjusted to the 2000 US standard population. Differences in mortality rates between US- and foreign-born individuals were statistically significant at the 0.05 level. Source: updated analysis of data presented in [31].
Figure 4
Figure 4
US cancer incidence rates by nativity/immigrant status: The US National Longitudinal Mortality Study Linked with 11 SEER Registries, 1980–1998. SEER: surveillance, epidemiology, and end results. Incidence rates are age-adjusted to the 2000 US standard population. Differences in incidence rates between US-born and foreign-born individuals were statistically significant at the 0.05 level for all cancers combined, lung, prostate, breast, and stomach cancers. The 11 SEER registries include Iowa, Hawaii, Seattle, Connecticut, Detroit, Utah, Los Angeles, San Francisco/Oakland/San Jose/Monterey, Greater California, Louisiana, and Kentucky.
Figure 5
Figure 5
Rates of human immunodeficiency virus (HIV) diagnoses by race/ethnicity and nativity/immigrant status, 46 US states and 5 US territories, 2007–2010. Source: Prosser AT, Tang T, Hall HI. HIV in persons born outside the United States, 2007–2010, [17]. The relevant population denominator data are from the 2008–2010 American Community Survey. Estimated HIV numbers resulted from statistical adjustment that accounted for missing country of birth reporting delays and missing risk factor information, but not for incomplete reporting. For further details, see Prosser et al. [15]. Hispanics/Latinos can be of any race.
Figure 6
Figure 6
Prevalence (%) of chronic conditions and learning disability among children aged <18 years by mother's duration of residence in the United States, 2007. Source: The 2007 National Survey of Children's Health (N = 91, 642).
Figure 7
Figure 7
Neighborhood environments for immigrant and native-born children, United States, 2007. Source: The 2007 National Survey of Children's Health (N = 91, 642) Immigrant children: children of immigrant parents; native-born children: children of US-born parents.

References

    1. Walters LP, Trevelyan EN. The Newly Arrived Foreign-Born Population of the United States: 2010. American Community Survey Briefs. Washington, DC, USA: US Census Bureau; 2011.
    1. Grieco EM, Trevelyan EN. Place of Birth of the Foreign-Born Population: 2009. American Community Survey Briefs. Washington, DC, USA: US Census Bureau; 2010.
    1. Grieco EM. Race and Hispanic Origin of the Foreign-Born Population in the United States: 2007. American Community Survey Briefs. Washington, DC, USA: US Census Bureau; 2010.
    1. Larsen LJ. The Foreign-Born Population in the United States: 2003. Current Population Reports, P20-551. Washington, DC, USA: US Census Bureau; 2003.
    1. US Census Bureau. The 2011 American Community Survey. Washington, DC, USA, US Census Bureau, 2012, http://www.census.gov/acs/www/

MeSH terms