Coarse-grained model for colloidal protein interactions, B(22), and protein cluster formation
- PMID: 24289039
- PMCID: PMC4108795
- DOI: 10.1021/jp409300j
Coarse-grained model for colloidal protein interactions, B(22), and protein cluster formation
Abstract
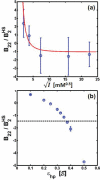
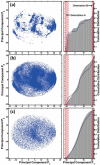
Reversible protein cluster formation is an important initial step in the processes of native and non-native protein aggregation, but involves relatively long time and length scales for detailed atomistic simulations and extensive mapping of free energy landscapes. A coarse-grained (CG) model is presented to semiquantitatively characterize the thermodynamics and key configurations involved in the landscape for protein oligomerization, as well as experimental measures of interactions such as the osmotic second virial coefficient (B22). Based on earlier work (Grüenberger et al., J. Phys. Chem. B 2013, 117, 763), this CG model treats proteins as rigid bodies composed of one bead per amino acid, with each amino acid having specific parameters for its size, hydrophobicity, and charge. The net interactions are a combination of steric repulsions, short-range attractions, and screened long-range charge-charge interactions. Model parametrization was done by fitting simulation results against experimental value of B22 as a function of solution ionic strength for α-chymotrypsinogen A and γD-Crystallin (gD-Crys). The CG model is applied to characterize the pairwise interactions and dimerization of gD-Crys and the dependence on temperature, protein concentration, and ionic strength. The results illustrate that at experimentally relevant conditions where stable dimers do not form, the entropic contributions are predominant in the free-energy of protein cluster formation and colloidal protein interactions, arguing against interpretations that treat B22 primarily from energetic considerations alone. Additionally, the results suggest that electrostatic interactions help to modulate the population of the different stable configurations for protein nearest-neighbor pairs, while short-range attractions determine the relative orientations of proteins within these configurations. Finally, simulation results are combined with Principal Component Analysis to identify those amino-acids/surface patches that form interprotein contacts at conditions that favor dimerization of gD-Crys. The resulting regions agree with previously found aggregation-prone sites, as well as suggesting new ones that may be important.
Figures


Similar articles
-
Biophysical characterization and molecular simulation of electrostatically driven self-association of a single-chain antibody.Protein Sci. 2018 Jul;27(7):1275-1285. doi: 10.1002/pro.3415. Epub 2018 May 3. Protein Sci. 2018. PMID: 29637646 Free PMC article.
-
Structure and thermodynamics of colloidal protein cluster formation: comparison of square-well and simple dipolar models.J Chem Phys. 2009 Sep 28;131(12):125104. doi: 10.1063/1.3238569. J Chem Phys. 2009. PMID: 19791922 Free PMC article.
-
Predicting Protein Interactions of Concentrated Globular Protein Solutions Using Colloidal Models.J Phys Chem B. 2017 May 11;121(18):4756-4767. doi: 10.1021/acs.jpcb.7b02183. Epub 2017 Apr 27. J Phys Chem B. 2017. PMID: 28422503
-
Modeling Structural Dynamics of Biomolecular Complexes by Coarse-Grained Molecular Simulations.Acc Chem Res. 2015 Dec 15;48(12):3026-35. doi: 10.1021/acs.accounts.5b00338. Epub 2015 Nov 17. Acc Chem Res. 2015. PMID: 26575522 Review.
-
Colloidal behavior of proteins: effects of the second virial coefficient on solubility, crystallization and aggregation of proteins in aqueous solution.Curr Pharm Biotechnol. 2005 Dec;6(6):427-36. doi: 10.2174/138920105775159313. Curr Pharm Biotechnol. 2005. PMID: 16375727 Review.
Cited by
-
Computational models for studying physical instabilities in high concentration biotherapeutic formulations.MAbs. 2022 Jan-Dec;14(1):2044744. doi: 10.1080/19420862.2022.2044744. MAbs. 2022. PMID: 35282775 Free PMC article. Review.
-
Biophysical characterization and molecular simulation of electrostatically driven self-association of a single-chain antibody.Protein Sci. 2018 Jul;27(7):1275-1285. doi: 10.1002/pro.3415. Epub 2018 May 3. Protein Sci. 2018. PMID: 29637646 Free PMC article.
-
Calculation of Second Virial Coefficients of Atomistic Proteins Using Fast Fourier Transform.J Phys Chem B. 2019 Oct 3;123(39):8203-8215. doi: 10.1021/acs.jpcb.9b06808. Epub 2019 Sep 19. J Phys Chem B. 2019. PMID: 31490691 Free PMC article.
-
Predicting Protein-Protein Interactions of Concentrated Antibody Solutions Using Dilute Solution Data and Coarse-Grained Molecular Models.J Pharm Sci. 2018 May;107(5):1269-1281. doi: 10.1016/j.xphs.2017.12.015. Epub 2017 Dec 21. J Pharm Sci. 2018. PMID: 29274822 Free PMC article.
-
Predicting unfolding thermodynamics and stable intermediates for alanine-rich helical peptides with the aid of coarse-grained molecular simulation.Biophys Chem. 2016 Oct;217:8-19. doi: 10.1016/j.bpc.2016.07.002. Epub 2016 Jul 22. Biophys Chem. 2016. PMID: 27486699 Free PMC article.
References
-
- Stradner A, Sedgwick H, Cardinaux F, Poon WCK, Egelhaaf SU, Schurtenberger P. Equilibrium Cluster Formation in Concentrated Protein Solutions and Colloids. Nature. 2004;432:492–495. - PubMed
-
- Li Y, Ogunnaike BA, Roberts CJ. Multi-Variate Approach to Global Protein Aggregation Behavior and Kinetics: Effects of pH, Nacl, and Temperature for Alpha-Chymotrypsinogen A. J. Pharm. Sci. 2010;99:645–662. - PubMed
-
- Zhang J, Liu XY. Effect of Protein-Protein Interactions on Protein Aggregation Kinetics. J. Chem. Phys. 2003;119:10972–10976.
-
- Shire SJ, Shahrokh Z, Liu J. Challenges in the Development of High Protein Concentration Formulations. J. Pharm. Sci. 2004;93:1390–1402. - PubMed
Publication types
MeSH terms
Substances
Grants and funding
LinkOut - more resources
Full Text Sources
Other Literature Sources

