. 2013 Nov 28;139(20):204108.
doi: 10.1063/1.4832900.

Origin of parameter degeneracy and molecular shape relationships in geometric-flow calculations of solvation free energies

Affiliations

Origin of parameter degeneracy and molecular shape relationships in geometric-flow calculations of solvation free energies

Michael D Daily et al. J Chem Phys. .

Abstract

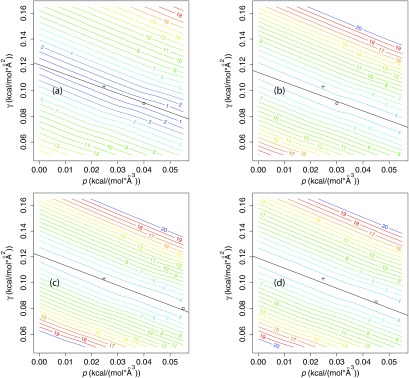
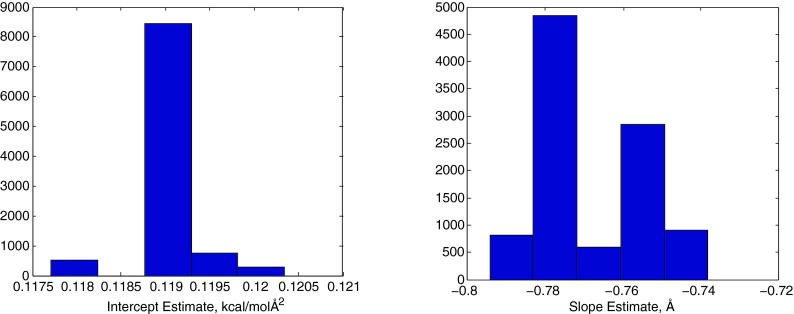
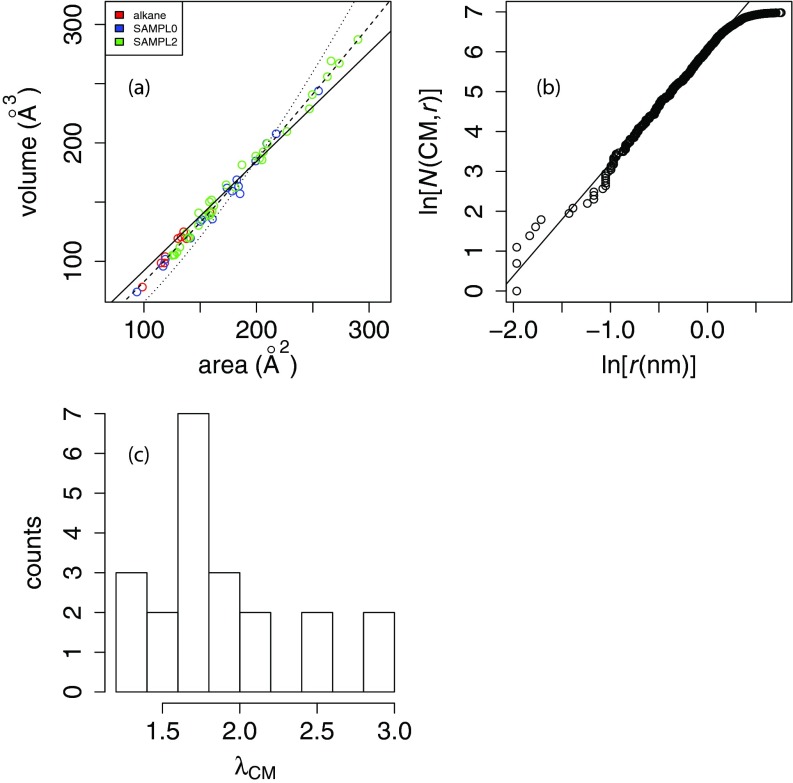
Implicit solvent models are important tools for calculating solvation free energies for chemical and biophysical studies since they require fewer computational resources but can achieve accuracy comparable to that of explicit-solvent models. In past papers, geometric flow-based solvation models have been established for solvation analysis of small and large compounds. In the present work, the use of realistic experiment-based parameter choices for the geometric flow models is studied. We find that the experimental parameters of solvent internal pressure p = 172 MPa and surface tension γ = 72 mN/m produce solvation free energies within 1 RT of the global minimum root-mean-squared deviation from experimental data over the expanded set. Our results demonstrate that experimental values can be used for geometric flow solvent model parameters, thus eliminating the need for additional parameterization. We also examine the correlations between optimal values of p and γ which are strongly anti-correlated. Geometric analysis of the small molecule test set shows that these results are inter-connected with an approximately linear relationship between area and volume in the range of molecular sizes spanned by the data set. In spite of this considerable degeneracy between the surface tension and pressure terms in the model, both terms are important for the broader applicability of the model.


Figures

Figure 1
Figure 1
Root-mean-squared error (RMSE) in solvation free energy for different sets of molecules as a function of solvent internal pressure p and surface tension γ for a solute dielectric constant ɛm = 1.8 using the OPLS-AA force field. (a) Linear, branched, and cyclic alkane set of Levy and Gallicchio; (b) SAMPL0 set; (c) SAMPL2 set; (d) pooled set. The RMSE is normalized by RT = 0.592 kcal mol−1 at 298 K, shown as contours. The linear regression fit of γmin (p) vs. p is indicated in black, where γmin (p) is the choice of γ at any given p which minimizes the RMSE (values provided in Table 1). The experimental values for the pressurep = 0.0248 kcal mol−1 Å−3 and surface tension γ = 0.103 kcal mol−1 Å−2 are indicated with a cross on each plot and the minimum (γ, p) values are indicated with a circle.
Figure 2
Figure 2
Histograms of the intercept (left panel) and slope (right panel) for linear fits of the optimal surface tension γmin  and p based on 10 000 random sets of 53 small molecule compounds drawn randomly and without replacement from the set of 58 compounds.
Figure 3
Figure 3
Area/volume relationship for small molecule test sets. In panel (a), the solid line indicates a linear least-squares fit with a slope of 1.1 ± 0.014 Å, an intercept of −27.3 ± 2.44 Å3 and a Pearson correlation coefficient of R2 = 0.99. The dotted line indicates a nonlinear least-squares “spherical” fit (V = αA3/2), where α = 0.066 ± 0.001, and the dashed line indicates a “free exponent” fit V = αAβ where α = 0.38 ± 0.03 and β = 1.17 ± 0.02. The nonlinear least-squares fits were performed with the nls function in R (www.R-project.org). Panel (b) shows the natural log of the radial counting function about the center of mass vs. log (r) for the protein villin. The first 2/3 of the points, representing the “interior volume,” can be fit with a slope of 2.83, which is the fractal density dimension λCM. Panel (c) shows the distribution of fractal density dimensions λCM for small molecules in the pooled set for which the correlation coefficient of log atom count vs. log (r) is greater than 0.9. 38 of the 58 molecules in the unified set met this criterion.

Similar articles

Cited by

References

    1. Tjong H. and Zhou H.-X., J. Chem. Theory Comput. 4, 507 (2008).10.1021/ct700319x - DOI - PMC - PubMed
    1. Connolly M. L., Science 221, 709 (1983).10.1126/science.6879170 - DOI - PubMed
    1. Dzubiella J., Swanson J. M., and McCammon J. A., Phys. Rev. Lett. 96, 087802 (2006).10.1103/PhysRevLett.96.087802 - DOI - PubMed
    1. Dzubiella J., Swanson J. M., and McCammon J. A., J. Chem. Phys. 124, 084905 (2006).10.1063/1.2171192 - DOI - PubMed
    1. Bates P. W., Wei G. W., and Zhao S., J. Comput. Chem. 29, 380 (2008).10.1002/jcc.20796 - DOI - PubMed

Publication types