

Mapping the FACT-G cancer-specific quality of life instrument to the EQ-5D and SF-6D
- PMID: 24289488
- PMCID: PMC4220776
- DOI: 10.1186/1477-7525-11-203
Mapping the FACT-G cancer-specific quality of life instrument to the EQ-5D and SF-6D
Abstract
Objective: To help facilitate economic evaluations of oncology treatments, we mapped responses on cancer-specific instrument to generic preference-based measures.
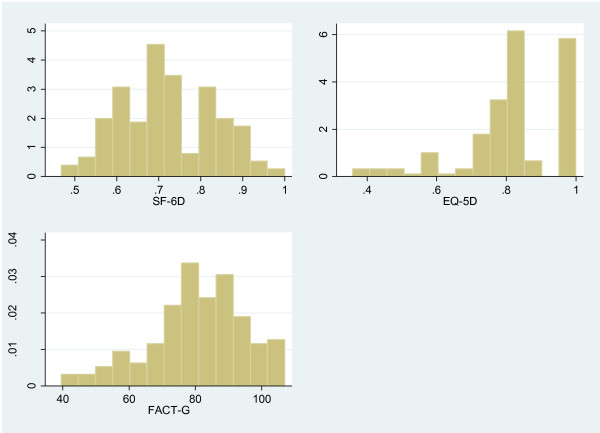
Methods: Cancer patients (n = 367) completed one cancer-specific instrument, the FACT-G, and two preference-based measures, the EQ-5D and SF-6D. Responses were randomly divided to form development (n = 184) and cross-validation (n = 183) samples. Relationships between the instruments were estimated using ordinary least squares (OLS), generalized linear models (GLM), and censored least absolute deviations (CLAD) regression approaches. The performance of each model was assessed in terms of how well the responses to the cancer-specific instrument predicted EQ-5D and SF-6D utilities using mean absolute error (MAE) and root mean squared error (RMSE).
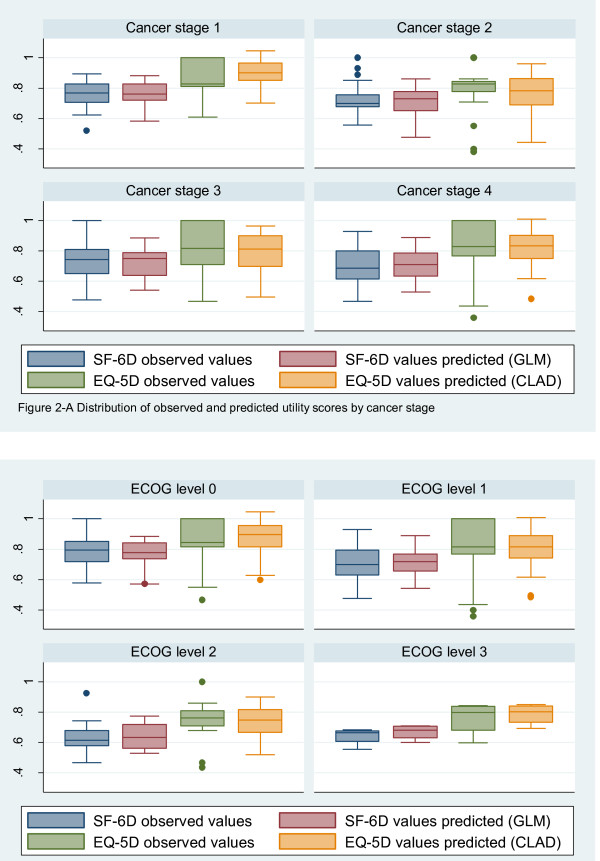
Results: Physical, functional, and emotional well-being domain scores of the FACT-G best explained the EQ-5D and SF-6D. In terms of accuracy of prediction as measured in RMSE, the CLAD model performed best for the EQ-5D (RMSE = 0.095) whereas the GLM model performed best for the SF-6D (RMSE = 0.061). The GLM predicted SF-6D scores matched the observed values more closely than the CLAD and OLS.
Conclusion: Our results demonstrate that the estimation of both EQ-5D and SF-6D utility indices using the FACT-G responses can be achieved. The CLAD model for the EQ-5D and the GLM model for the SF-6D are recommended. Thus, it is possible to estimate quality-adjusted life years for economic evaluation from studies where only cancer-specific instrument have been administered.
Figures
Similar articles
-
Mapping QLQ-C30 Onto EQ-5D-5L and SF-6D-V2 in Patients With Colorectal and Breast Cancer From a Developing Country.Value Health Reg Issues. 2021 May;24:57-66. doi: 10.1016/j.vhri.2020.06.006. Epub 2021 Jan 25. Value Health Reg Issues. 2021. PMID: 33508752
-
Using the Multiple Sclerosis Impact Scale to estimate health state utility values: mapping from the MSIS-29, version 2, to the EQ-5D and the SF-6D.Value Health. 2012 Dec;15(8):1084-91. doi: 10.1016/j.jval.2012.07.007. Epub 2012 Nov 4. Value Health. 2012. PMID: 23244811 Clinical Trial.
-
Mapping the cancer-specific QLQ-C30 onto the generic EQ-5D-5L and SF-6D in colorectal cancer patients.Expert Rev Pharmacoecon Outcomes Res. 2019 Feb;19(1):89-96. doi: 10.1080/14737167.2018.1517046. Epub 2018 Sep 3. Expert Rev Pharmacoecon Outcomes Res. 2019. PMID: 30173585
-
Validity and responsiveness of EuroQol-5 dimension (EQ-5D) versus Short Form-6 dimension (SF-6D) questionnaire in chronic pain.Health Qual Life Outcomes. 2013 Jul 1;11:110. doi: 10.1186/1477-7525-11-110. Health Qual Life Outcomes. 2013. PMID: 23815777 Free PMC article. Review.
-
Comparison of the minimally important difference for two health state utility measures: EQ-5D and SF-6D.Qual Life Res. 2005 Aug;14(6):1523-32. doi: 10.1007/s11136-004-7713-0. Qual Life Res. 2005. PMID: 16110932 Review.
Cited by
-
Systematic review of health state utility values for economic evaluation of colorectal cancer.Health Econ Rev. 2016 Dec;6(1):36. doi: 10.1186/s13561-016-0115-5. Epub 2016 Aug 19. Health Econ Rev. 2016. PMID: 27541298 Free PMC article. Review.
-
Prediction of the SF-6D utility score from Lung cancer FACT-L: a mapping study in China.Health Qual Life Outcomes. 2023 Nov 14;21(1):122. doi: 10.1186/s12955-023-02209-8. Health Qual Life Outcomes. 2023. PMID: 37964348 Free PMC article.
-
Does Methodological Guidance Produce Consistency? A Review of Methodological Consistency in Breast Cancer Utility Value Measurement in NICE Single Technology Appraisals.Pharmacoecon Open. 2018 Jun;2(2):97-107. doi: 10.1007/s41669-017-0040-5. Pharmacoecon Open. 2018. PMID: 29623616 Free PMC article. Review.
-
Mapping health-related quality of life scores from FACT-G, FAACT, and FACIT-F onto preference-based EQ-5D-5L utilities in non-small cell lung cancer cachexia.Eur J Health Econ. 2019 Mar;20(2):181-193. doi: 10.1007/s10198-017-0930-6. Epub 2017 Sep 25. Eur J Health Econ. 2019. PMID: 28948436 Free PMC article. Clinical Trial.
-
Converting Parkinson-Specific Scores into Health State Utilities to Assess Cost-Utility Analysis.Patient. 2018 Dec;11(6):665-675. doi: 10.1007/s40271-018-0317-5. Patient. 2018. PMID: 29876865
References
-
- Canadian Cancer Society. Canadian Cancer Statistics 2011. 2011. Source: http://www.cancer.ca/ Accessed March 8, 2013.
-
- Statistics Canada. Leading Causes of Death in Canada, 2008. Ottawa; 2011. http://www.statcan.gc.ca/pub/84-215-x/2011001/hl-fs-eng.htm Accessed March 8, 2013. ISBN 1913–7826.
-
- Levine MN, Ganz PA, Haller DG. Economic evaluation in the journal of clinical oncology: past, present, and future. J Clin Oncol. 2007;25(6):614–616. doi: 10.1200/JCO.2006.10.1659. - DOI
-
- Raftery JP. Paying for costly pharmaceuticals: regulation of new drugs in Australia, England and New Zealand. Med J Aust. 2008;188(1):26–28. - PubMed
-
- Guidelines for the economic evaluation of health technologies: Canada. 3rd edition. Ottawa: Canadian Agency for Drugs and Technologies in Health; 2006.
Publication types
MeSH terms
LinkOut - more resources
Full Text Sources
Other Literature Sources
Medical
