. 2013 Nov 15;111(20):204301.
doi: 10.1103/PhysRevLett.111.204301. Epub 2013 Nov 12.

Ultrasonically encoded photoacoustic flowgraphy in biological tissue

Affiliations

Ultrasonically encoded photoacoustic flowgraphy in biological tissue

Lidai Wang et al. Phys Rev Lett. .

Abstract

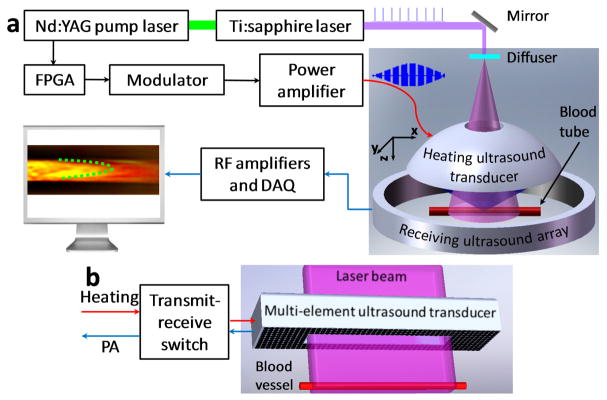
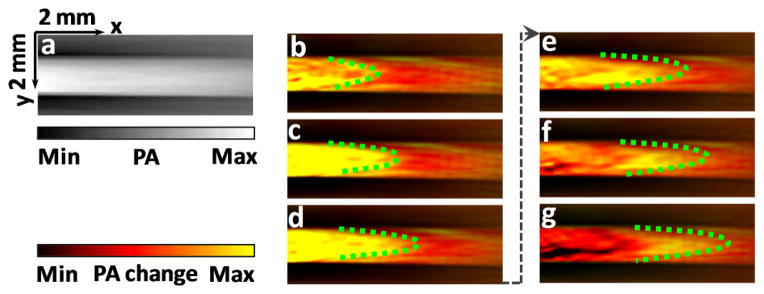
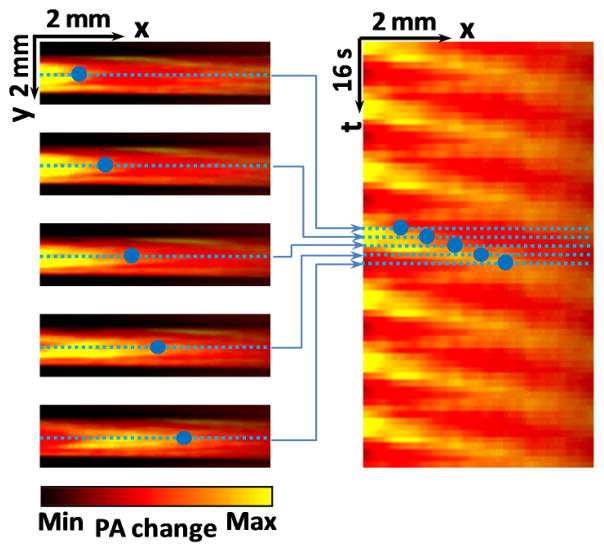
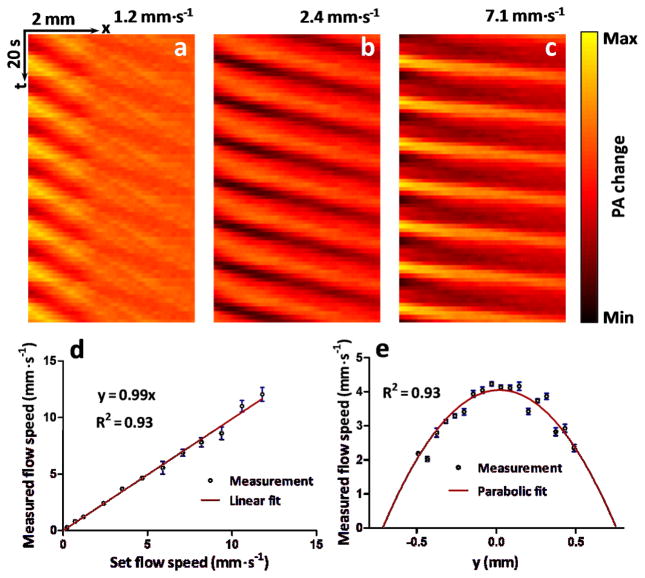
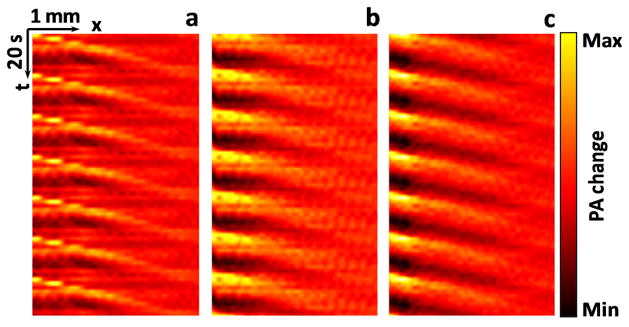
Blood flow speed is an important functional parameter. Doppler ultrasound flowmetry lacks sufficient sensitivity to slow blood flow (several to tens of millimeters per second) in deep tissue. To address this challenge, we developed ultrasonically encoded photoacoustic flowgraphy combining ultrasonic thermal tagging with photoacoustic imaging. Focused ultrasound generates a confined heat source in acoustically absorptive fluid. Thermal waves propagate with the flow and are directly visualized in pseudo color using photoacoustic computed tomography. The Doppler shift is employed to calculate the flow speed. This method requires only acoustic and optical absorption, and thus is applicable to continuous fluid. A blood flow speed as low as 0.24 mm·s(-1)} was successfully measured. Deep blood flow imaging was experimentally demonstrated under 5-mm-thick chicken breast tissue.


Figures

Figure 1
Figure 1
(Color online) (a), Schematic of an ultrasonically encoded photoacoustic flowgraphy (UE-PAF) system. (b) Conceptual design of a reflection-mode UE-PAF probe.
Figure 2
Figure 2
(Color online) (a), A typical photoacoustic image of blood flow without ultrasonically encoding. (b)–(g), Ultrasonically-encoded photoacoustic flow images of whole blood in a tube. Time interval between adjacent images is 1.6 seconds. Dashed line highlights a parabolic heating peak propagating with blood flow. PA: photoacoustic.
Figure 3
Figure 3
(Color online) Flow trajectories in x-t plane. Each horizontal line in the right figure is extracted from one photoacoustic image along the flow direction. The blue dots represent a trajectory of a thermally tagged feature. PA: photoacoustic.
Figure 4
Figure 4
(Color online) (a)–(c), Representative thermal trajectories at different blood flow speeds. (d), Measured flow speed versus set flow speed. Error bars represent standard errors. N=8 for each flow speed. (e), Flow speed distribution along the radial direction (y-axis) of a cylindrical tube. PA: photoacoustic.
Figure 5
Figure 5
(Color online) Thermal trajectories imaged beneath chicken breast tissue. (a) Without tissue, average of 7 heating cycles. (b) 3-mm-thick tissue, average of 21 heating cycles. (c) 5-mm-thick tissue, average of 35 heating cycles. The flow speed was set to 1.4 mm·s−1. The measured flow speeds for (a)–(c) were 1.5±0.1 mm·s−1, 1.6±0.2 mm·s−1, and 1.5±0.2 mm·s−1 (mean ± standard error, N=8), respectively. PA: photoacoustic.

References

    1. Benchimol DKBA. JAMA. 1983;249:1502.
    1. Mace E, et al. Nat Meth. 2011;8:662. - PubMed
    1. Rowland KJ, et al. Journal of Pediatric Surgery. 2012;47:1143. - PMC - PubMed
    1. Krumholz A, et al. Journal of Biomedical Optics. 2012;17:060502. - PMC - PubMed
    1. Ting TH, Newhouse VL, Li Y. Ultrasonics. 1992;30:225. - PubMed

Publication types

MeSH terms