

Discriminant value of custom ocular response analyzer waveform derivatives in keratoconus
- PMID: 24289916
- PMCID: PMC4031747
- DOI: 10.1016/j.ophtha.2013.09.013
Discriminant value of custom ocular response analyzer waveform derivatives in keratoconus
Abstract
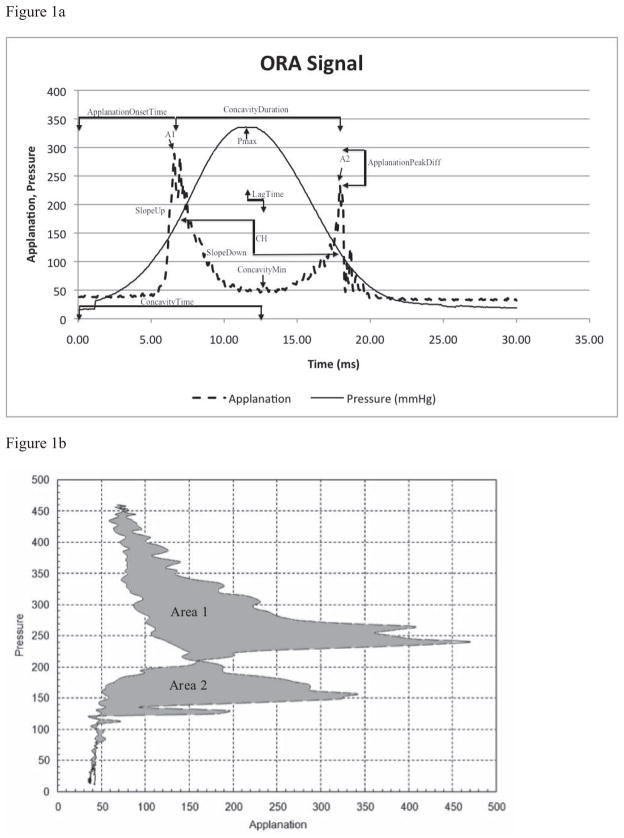
Purpose: To evaluate the performance of corneal hysteresis (CH), corneal resistance factor, and 16 investigator-derived Ocular Response Analyzer (ORA) variables in distinguishing keratoconus (KC) from the nondiseased state.
Design: Retrospective case series.
Participants: Fifty-four eyes of 27 unaffected patients and 49 eyes of 25 KC patients from the Instituto de Olhos, Rio de Janeiro, Brazil.
Methods: Sixteen candidate variables were derived from exported ORA signals to characterize putative indicators of biomechanical behavior. Area under the receiver operating characteristic curve (AUC) and the Z statistic were used to compare diagnostic performance.
Main outcome measures: Discriminant value of standard and derived ORA variables as measured by AUC.
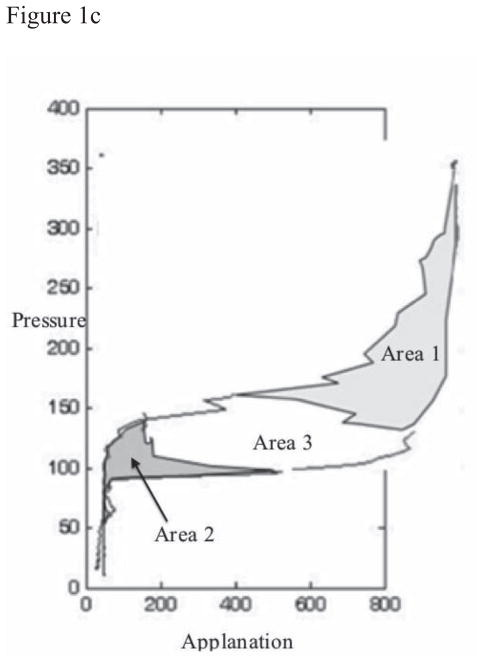
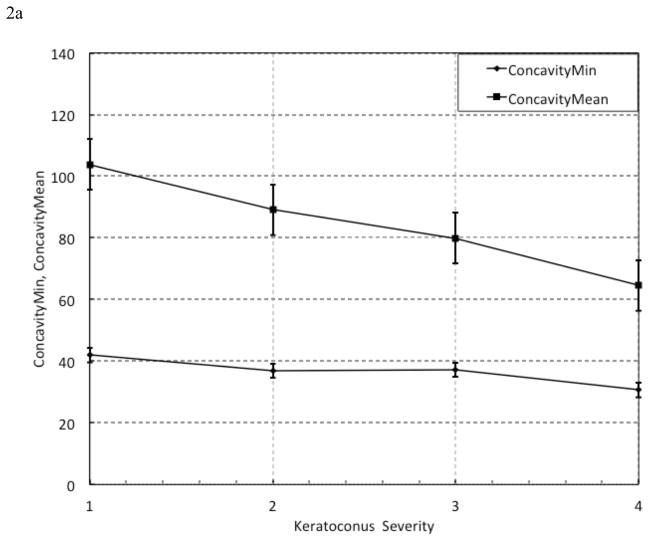
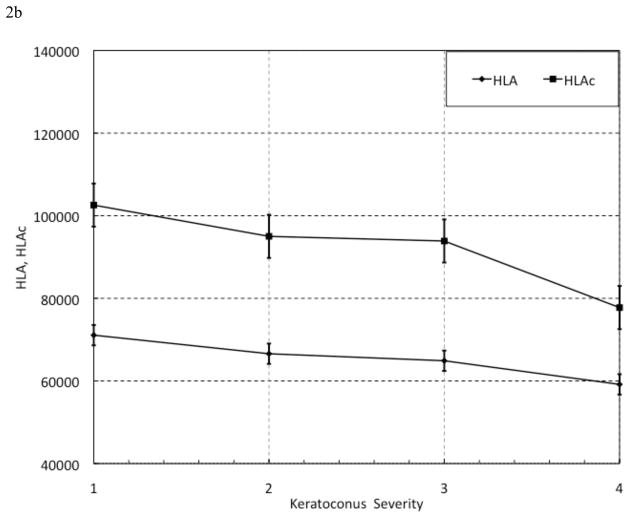
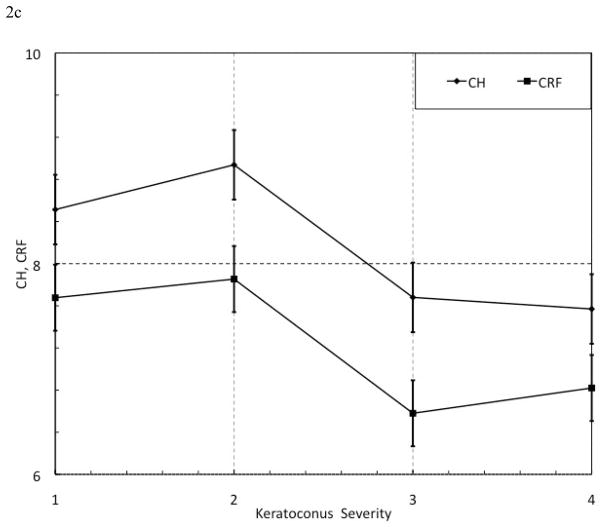
Results: Fifteen of 16 candidate variables performed significantly better than chance (AUC, >0.5) at discriminating KC. Diagnostic performance was greatest for a custom variable related to the depth of deformation as defined by the minimum applanation signal intensity during corneal deformation (concavity(min); mean AUC ± standard error, 0.985 ± 0.002) and a new measure incorporating the pressure-deformation relationship of the entire response cycle (hysteresis loop area, 0.967 ± 0.002). Z statistics assessing the discriminative value of each of the top 5 variables demonstrated superiority to CH (AUC, 0.862 ± 0.002). Concavity(min) had the best overall predictive accuracy (cutoff value, 50.37; 94.9% sensitivity, 91.7% specificity, and 93.2% test accuracy), and the top 4 variables demonstrated the most consistent relationships to KC severity.
Conclusions: Investigator-derived ORA variables related to the depth of deformation and the pressure-deformation relationship demonstrated very high test accuracy for detecting the presence of KC. Beyond their diagnostic value, the candidate variables described in this report provide mechanistic insight into the nature of the ORA signal and the characteristic changes in corneal dynamics associated with KC.
Copyright © 2014 American Academy of Ophthalmology. Published by Elsevier Inc. All rights reserved.
Conflict of interest statement
Conflict of Interest: RA is a consultant for Reichert and Oculus. WJD is a co-author of intellectual property issued through Cleveland Clinic Innovations for a technique for biomechanical measurement that is not addressed in this paper. The other authors have no relevant financial interests.
Figures
Similar articles
-
Enhanced Combined Tomography and Biomechanics Data for Distinguishing Forme Fruste Keratoconus.J Refract Surg. 2016 Jul 1;32(7):479-94. doi: 10.3928/1081597X-20160502-02. J Refract Surg. 2016. PMID: 27400080 Free PMC article.
-
Discriminant Value of Custom Ocular Response Analyzer Waveform Derivatives in Forme Fruste Keratoconus.Am J Ophthalmol. 2016 Apr;164:14-21. doi: 10.1016/j.ajo.2015.12.020. Epub 2015 Dec 29. Am J Ophthalmol. 2016. PMID: 26743618 Free PMC article.
-
Assessment of corneal biomechanical parameters in healthy and keratoconic eyes using dynamic bidirectional applanation device and dynamic Scheimpflug analyzer.J Cataract Refract Surg. 2019 Jun;45(6):778-788. doi: 10.1016/j.jcrs.2018.12.015. Epub 2019 Mar 20. J Cataract Refract Surg. 2019. PMID: 30902432
-
Biomechanical properties of early keratoconus: Suppressed deformation signal wave.Cont Lens Anterior Eye. 2017 Apr;40(2):104-108. doi: 10.1016/j.clae.2016.12.004. Epub 2016 Dec 10. Cont Lens Anterior Eye. 2017. PMID: 27956045
-
Corneal biomechanical metrics and anterior segment parameters in mild keratoconus.Ophthalmology. 2010 Apr;117(4):673-9. doi: 10.1016/j.ophtha.2009.09.023. Ophthalmology. 2010. PMID: 20138369
Cited by
-
Evaluation of the Relationship Between the Changes in the Corneal Biomechanical Properties and Changes in the Anterior Segment OCT Parameters Following Customized Corneal Cross-Linking.Clin Ophthalmol. 2022 Jun 9;16:1909-1923. doi: 10.2147/OPTH.S361836. eCollection 2022. Clin Ophthalmol. 2022. PMID: 35711971 Free PMC article.
-
Enhanced Combined Tomography and Biomechanics Data for Distinguishing Forme Fruste Keratoconus.J Refract Surg. 2016 Jul 1;32(7):479-94. doi: 10.3928/1081597X-20160502-02. J Refract Surg. 2016. PMID: 27400080 Free PMC article.
-
Corneal Biomechanics Differences Between Chinese and Caucasian Healthy Subjects.Front Med (Lausanne). 2022 Feb 25;9:834663. doi: 10.3389/fmed.2022.834663. eCollection 2022. Front Med (Lausanne). 2022. PMID: 35280913 Free PMC article.
-
Advances in Biomechanical Parameters for Screening of Refractive Surgery Candidates: A Review of the Literature, Part III.Med Hypothesis Discov Innov Ophthalmol. 2019 Fall;8(3):219-240. Med Hypothesis Discov Innov Ophthalmol. 2019. PMID: 31598522 Free PMC article. Review.
-
Discriminant Value of Custom Ocular Response Analyzer Waveform Derivatives in Forme Fruste Keratoconus.Am J Ophthalmol. 2016 Apr;164:14-21. doi: 10.1016/j.ajo.2015.12.020. Epub 2015 Dec 29. Am J Ophthalmol. 2016. PMID: 26743618 Free PMC article.
References
-
- Kymes SM, Walline JJ, Zadnik K, Gordon MO Collaborative Longitudinal Evaluation of Keratoconus (CLEK) Study Group. Quality of life in keratoconus. Am J Ophthalmol. 2004;138:527–35. - PubMed
-
- Holladay JT. Keratoconus detection using corneal topography. J Refract Surg. 2009;25(suppl):S958–62. - PubMed
-
- Rabinowitz YS. Keratoconus. Surv Ophthalmol. 1998;42:297–319. - PubMed
-
- Goldich Y, Barkana Y, Morad Y, et al. Can we measure corneal biomechanical changes after collagen cross-linking in eyes with keratoconus? --a pilot study. Cornea. 2009;28:498–502. - PubMed
-
- Kirwan C, O’Malley D, O’Keefe M. Corneal hysteresis and corneal resistance factor in keratoectasia: findings using the Reichert ocular response analyzer. Ophthalmologica. 2008;222:334–7. - PubMed
MeSH terms
Grants and funding
LinkOut - more resources
Full Text Sources
Other Literature Sources
