

Predicting progression of glaucoma from rates of frequency doubling technology perimetry change
- PMID: 24289917
- PMCID: PMC3946572
- DOI: 10.1016/j.ophtha.2013.09.016
Predicting progression of glaucoma from rates of frequency doubling technology perimetry change
Abstract
Purpose: To evaluate the ability of longitudinal frequency doubling technology (FDT) to predict the development of glaucomatous visual field loss on standard automated perimetry (SAP) in glaucoma suspects.
Design: Prospective, observational cohort study.
Participants: The study included 587 eyes of 367 patients with suspected glaucoma at baseline selected from the Diagnostic Innovations in Glaucoma Study (DIGS) and the African Descent and Glaucoma Evaluation Study (ADAGES). These eyes had an average of 6.7 ± 1.9 FDT tests during a mean follow-up time of 73.1 ± 28.0 months.
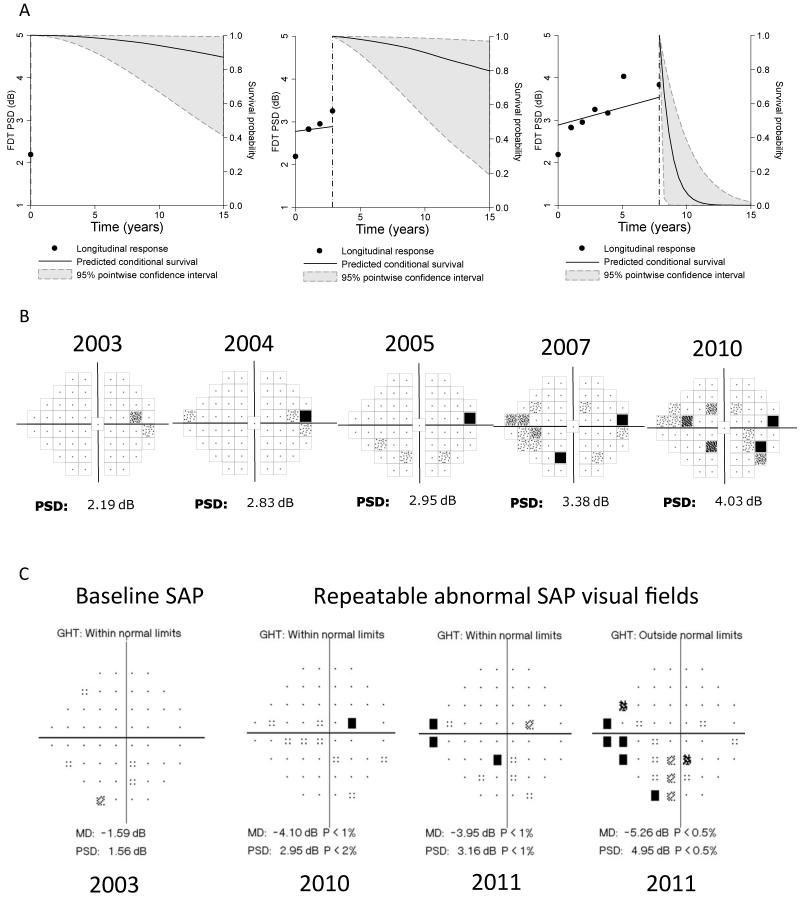
Methods: Glaucoma suspects had intraocular pressure (IOP) >21 mmHg or an optic disc appearance suspicious of glaucoma. All patients had normal or nonrepeatable abnormal SAP at baseline. Humphrey Matrix FDT (Carl Zeiss Meditec, Inc, Dublin, CA) testing was performed within 6 months of SAP testing. The study end point was the development of 3 consecutive abnormal SAP test results. Joint longitudinal survival models were used to evaluate the ability of rates of FDT pattern standard deviation (PSD) change to predict the development of visual field loss on SAP, adjusting for confounding variables (baseline age, mean IOP, corneal thickness, and follow-up measurements of SAP PSD).
Main outcome measures: The R(2) index was used to evaluate and compare the predictive abilities of the model containing longitudinal FDT PSD data with the model containing only baseline data.
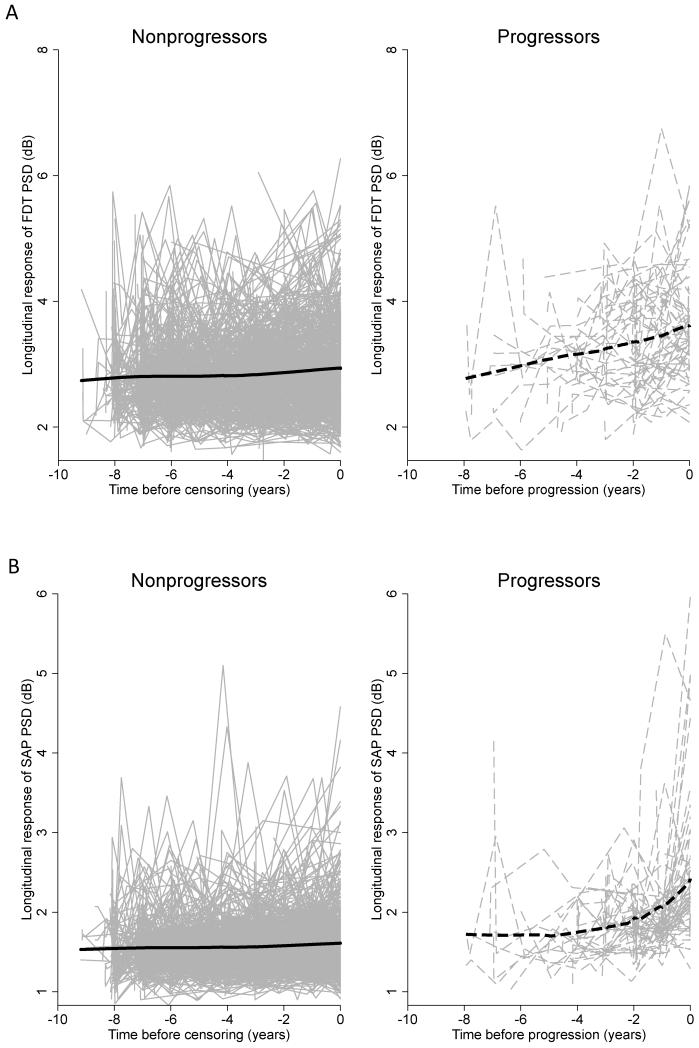
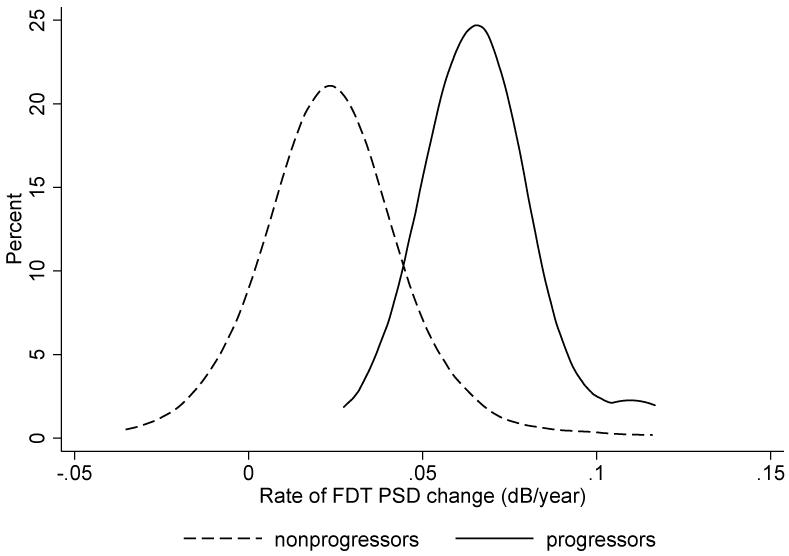
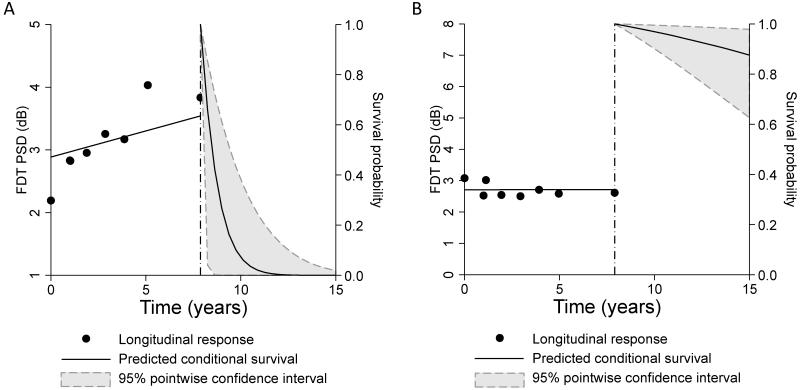
Results: Sixty-three of 587 eyes (11%) developed SAP visual field loss during follow-up. The mean rate of FDT PSD change in eyes that developed SAP visual field loss was 0.07 dB/year versus 0.02 dB/year in those that did not (P < 0.001). Baseline FDT PSD and slopes of FDT PSD change were significantly predictive of progression, with hazard ratios of 1.11 per 0.1 dB higher (95% confidence interval [CI], 1.04-1.18; P = 0.002) and 4.40 per 0.1 dB/year faster (95% CI, 1.08-17.96; P = 0.04), respectively. The longitudinal model performed significantly better than the baseline model with an R(2) of 82% (95% CI, 74-89) versus 11% (95% CI, 2-24), respectively.
Conclusions: Rates of FDT PSD change were highly predictive of the development of SAP visual field loss in glaucoma suspects. This finding suggests that longitudinal FDT evaluation may be useful for risk stratification of patients with suspected glaucoma.
Copyright © 2014 American Academy of Ophthalmology. Published by Elsevier Inc. All rights reserved.
Figures
Similar articles
-
Frequency doubling technology perimetry abnormalities as predictors of glaucomatous visual field loss.Am J Ophthalmol. 2004 May;137(5):863-71. doi: 10.1016/j.ajo.2003.12.009. Am J Ophthalmol. 2004. PMID: 15126151
-
Frequency-doubling technology perimetry for detection of the development of visual field defects in glaucoma suspect eyes: a prospective study.JAMA Ophthalmol. 2014 Jan;132(1):77-83. doi: 10.1001/jamaophthalmol.2013.5511. JAMA Ophthalmol. 2014. PMID: 24177945
-
Short wavelength automated perimetry, frequency doubling technology perimetry, and pattern electroretinography for prediction of progressive glaucomatous standard visual field defects.Ophthalmology. 2002 May;109(5):1009-17. doi: 10.1016/s0161-6420(02)01015-1. Ophthalmology. 2002. PMID: 11986111
-
Screening for Glaucoma: Comparative Effectiveness [Internet].Rockville (MD): Agency for Healthcare Research and Quality (US); 2012 Apr. Report No.: 12-EHC037-EF. Rockville (MD): Agency for Healthcare Research and Quality (US); 2012 Apr. Report No.: 12-EHC037-EF. PMID: 22649799 Free Books & Documents. Review.
-
Virtual reality perimetry compared to standard automated perimetry in adults with glaucoma: A systematic review.PLoS One. 2025 Jan 24;20(1):e0318074. doi: 10.1371/journal.pone.0318074. eCollection 2025. PLoS One. 2025. PMID: 39854584 Free PMC article.
Cited by
-
Usefulness of frequency doubling technology perimetry 24-2 in glaucoma with parafoveal scotoma.Medicine (Baltimore). 2017 Jun;96(24):e6855. doi: 10.1097/MD.0000000000006855. Medicine (Baltimore). 2017. PMID: 28614218 Free PMC article.
-
Predicting Risk of Motor Vehicle Collisions in Patients with Glaucoma: A Longitudinal Study.PLoS One. 2015 Oct 1;10(10):e0138288. doi: 10.1371/journal.pone.0138288. eCollection 2015. PLoS One. 2015. PMID: 26426342 Free PMC article.
-
Joint models for longitudinal and time-to-event data: a review of reporting quality with a view to meta-analysis.BMC Med Res Methodol. 2016 Dec 5;16(1):168. doi: 10.1186/s12874-016-0272-6. BMC Med Res Methodol. 2016. PMID: 27919221 Free PMC article. Review.
-
Comparison of Standard Automated Perimetry, Short-Wavelength Automated Perimetry, and Frequency-Doubling Technology Perimetry to Monitor Glaucoma Progression.Medicine (Baltimore). 2016 Feb;95(7):e2618. doi: 10.1097/MD.0000000000002618. Medicine (Baltimore). 2016. PMID: 26886602 Free PMC article.
-
Deep-layer Microvasculature Dropout in Preperimetric Glaucoma Patients.J Glaucoma. 2020 Jun;29(6):423-428. doi: 10.1097/IJG.0000000000001489. J Glaucoma. 2020. PMID: 32205833 Free PMC article.
References
-
- Weinreb RN, Khaw PT. Primary open-angle glaucoma. Lancet. 2004;363:1711–20. - PubMed
-
- Quigley HA, Dunkelberger GR, Green WR. Retinal ganglion cell atrophy correlated with automated perimetry in human eyes with glaucoma. Am J Ophthalmol. 1989;107:453–64. - PubMed
-
- Landers J, Goldberg I, Graham S. A comparison of short wavelength automated perimetry with frequency doubling perimetry for the early detection of visual field loss in ocular hypertension. Clin Experiment Ophthalmol. 2000;28:248–52. - PubMed
-
- Sample PA, Bosworth CF, Blumenthal EZ, et al. Visual function-specific perimetry for indirect comparison of different ganglion cell populations in glaucoma. Invest Ophthalmol Vis Sci. 2000;41:1783–90. - PubMed
Publication types
MeSH terms
Grants and funding
LinkOut - more resources
Full Text Sources
Other Literature Sources
Medical
Miscellaneous
