

Systemic complement inhibition with eculizumab for geographic atrophy in age-related macular degeneration: the COMPLETE study
- PMID: 24289920
- PMCID: PMC4015213
- DOI: 10.1016/j.ophtha.2013.09.044
Systemic complement inhibition with eculizumab for geographic atrophy in age-related macular degeneration: the COMPLETE study
Abstract
Purpose: To evaluate the effect of eculizumab, a systemic inhibitor of complement component (C5), on the growth of geographic atrophy (GA) in patients with age-related macular degeneration (AMD).
Design: Prospective, double-masked, randomized clinical trial.
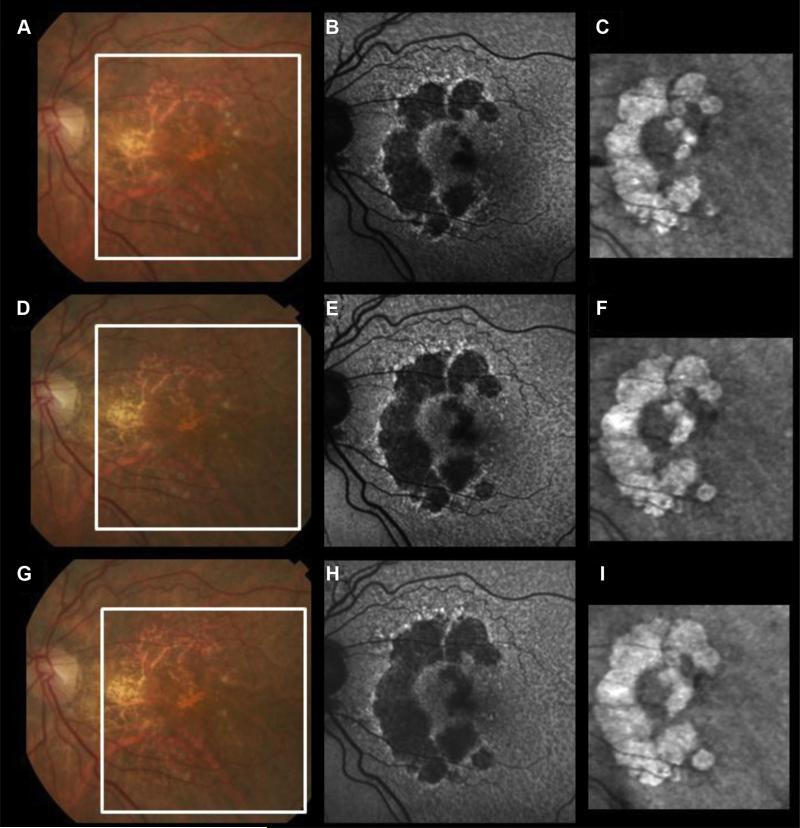
Participants: Patients with GA measuring from 1.25 to 18 mm(2) based on spectral-domain optical coherence tomography imaging.
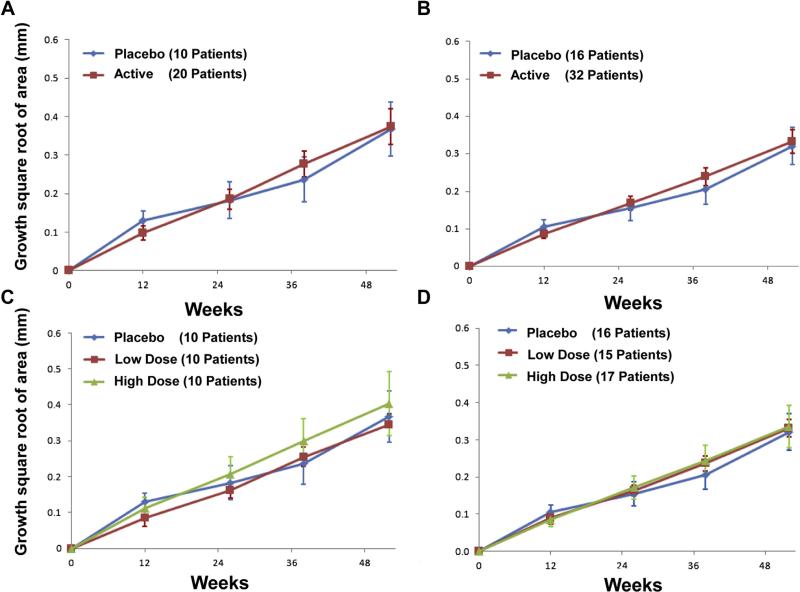
Methods: Patients were randomized 2:1 to receive intravenous eculizumab or placebo over 6 months. In the eculizumab treatment arm, the first 10 patients received a low-dose regimen of 600 mg weekly for 4 weeks followed by 900 mg every 2 weeks until week 24, and the next 10 patients received a high-dose regimen of 900 mg weekly for 4 weeks followed by 1200 mg every 2 weeks until week 24. The placebo group was infused with saline. Patients were observed off treatment for an additional 26 weeks. Both normal-luminance and low-luminance visual acuities were measured throughout the study, and the low-luminance deficits were calculated as the difference between the letter scores.
Main outcome measures: Change in area of GA at 26 weeks.
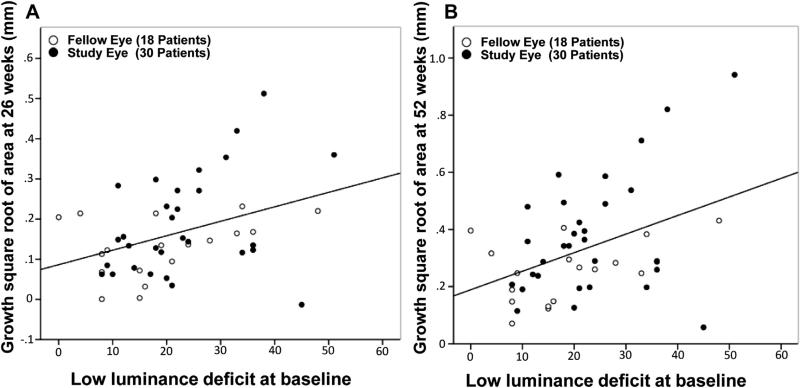
Results: Thirty eyes of 30 patients were enrolled. Eighteen fellow eyes also met inclusion criteria and were analyzed as a secondary endpoint. For the 30 study eyes, mean square root of GA area measurements ± standard deviation at baseline were 2.55 ± 0.94 and 2.02 ± 0.74 mm in the eculizumab and placebo groups, respectively (P = 0.13). At 26 weeks, GA enlarged by a mean of 0.19 ± 0.12 and 0.18 ± 0.15 mm in the eculizumab and placebo groups, respectively (P = 0.96). At 52 weeks of follow-up, GA enlarged by a mean of 0.37 ± 0.22 mm in the eculizumab-treated eyes and by a mean of 0.37 ± 0.21 mm in the placebo group (P = 0.93, 2 sample t test). None of the eyes converted to wet AMD. No drug-related adverse events were identified.
Conclusions: Systemic complement inhibition with eculizumab was well tolerated through 6 months but did not decrease the growth rate of GA significantly. However, there was a statistically significant correlation between the low-luminance deficit at baseline and the progression of GA over 6 months.
Copyright © 2014 American Academy of Ophthalmology. Published by Elsevier Inc. All rights reserved.
Figures
References
-
- Lim LS, Mitchell P, Seddon JM, et al. Age-related macular degeneration. Lancet. 2012;379:1728–38. - PubMed
-
- Khandhadia S, Cipriani V, Yates JR, Lotery AJ. Age-related macular degeneration and the complement system. Immunobiology. 2012;217:127–46. - PubMed
-
- Anderson DH, Mullins RF, Hageman GS, Johnson LV. A role for local inflammation in the formation of drusen in the aging eye. Am J Ophthalmol. 2002;134:411–31. - PubMed
-
- Mullins RF, Aptsiauri N, Hageman GS. Structure and composition of drusen associated with glomerulonephritis: implications for the role of complement activation in drusen biogenesis. Eye (Lond) 2001;15:390–5. - PubMed
Publication types
MeSH terms
Substances
Grants and funding
LinkOut - more resources
Full Text Sources
Other Literature Sources
Medical
Miscellaneous
