. 2013 Dec 12;5(5):1302-15.
doi: 10.1016/j.celrep.2013.10.042. Epub 2013 Nov 27.

Impaired autophagy in the lipid-storage disorder Niemann-Pick type C1 disease

Affiliations

Impaired autophagy in the lipid-storage disorder Niemann-Pick type C1 disease

Sovan Sarkar et al. Cell Rep. .

Abstract

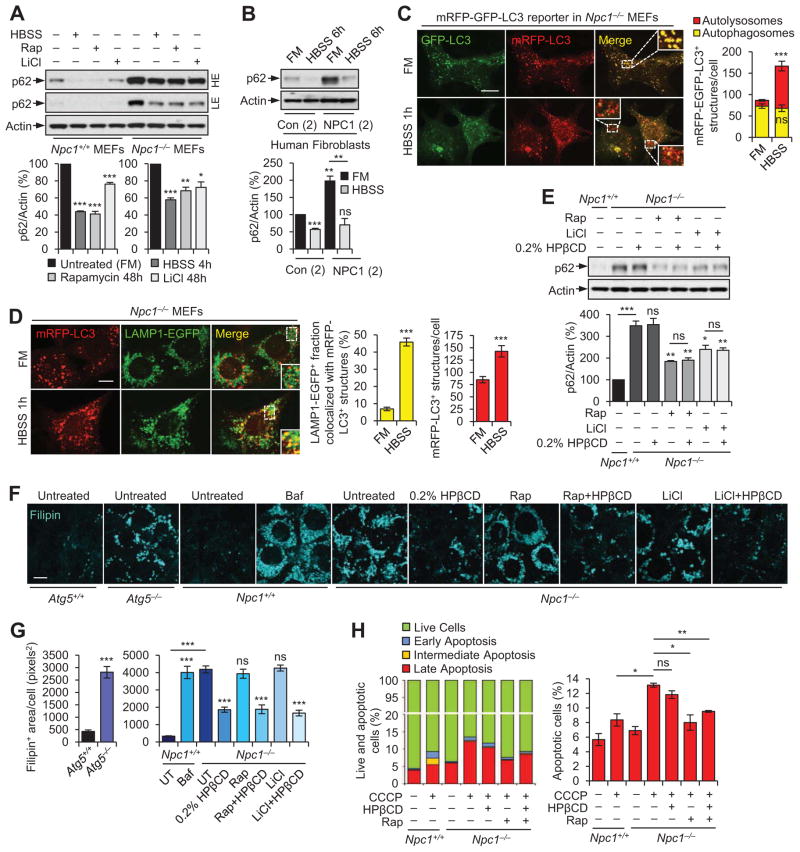
Autophagy dysfunction has been implicated in misfolded protein accumulation and cellular toxicity in several diseases. Whether alterations in autophagy also contribute to the pathology of lipid-storage disorders is not clear. Here, we show defective autophagy in Niemann-Pick type C1 (NPC1) disease associated with cholesterol accumulation, where the maturation of autophagosomes is impaired because of defective amphisome formation caused by failure in SNARE machinery, whereas the lysosomal proteolytic function remains unaffected. Expression of functional NPC1 protein rescues this defect. Inhibition of autophagy also causes cholesterol accumulation. Compromised autophagy was seen in disease-affected organs of Npc1 mutant mice. Of potential therapeutic relevance is that HP-β-cyclodextrin, which is used for cholesterol-depletion treatment, impedes autophagy, whereas stimulating autophagy restores its function independent of amphisome formation. Our data suggest that a low dose of HP-β-cyclodextrin that does not perturb autophagy, coupled with an autophagy inducer, may provide a rational treatment strategy for NPC1 disease.


Conflict of interest statement

CONFLICT OF INTEREST

R.J. is an advisor to Stemgent and Fate Therapeutics.

Figures

Figure 1
Figure 1. Accumulation of autophagosomes in NPC1 mutant cells is due to a block in autophagic flux
(A and B) Filipin and BODIPY fluorescence staining (A) and immunofluorescence staining with anti-LC3 antibody (B) in control and NPC1 patient fibroblasts, Npc1+/+ and Npc1−/− MEFs, and in Npc1wt and Npc1null CHO-K1 cells. Scale bar, 10 μm. See also Figure S1D. (C) Electron microscopy images and quantification of autophagic vacuoles (AVs) in control and NPC1 patient fibroblasts, and in Npc1+/+ and Npc1−/− MEFs. Scale bar, 500 nm. See also Figures S1E,F. (D) Immunoblot analyses with anti-LC3 and anti-actin antibodies in control and NPC1 patient fibroblasts, Npc1+/+ and Npc1−/− MEFs, and in Npc1wt and Npc1null CHO-K1 cells treated with or without 400 nM bafilomycin A1 (Baf) for 4 h. High (HE) and low exposures (LE) of the same immunoblot are shown. (E) GO enrichments among differentially expressed genes with enriched abundance in Npc1+/+ and Npc1−/− MEFs that have GO annotations linking them to autophagy (blue), the lysosomal (green) and the endosomal system (orange). (F) Immunoblot analyses with anti-NPC1, anti-Rab7, anti-M6PR, anti-VAMP8, anti-VAMP7, anti-VAMP3 and anti-actin antibodies in Npc1+/+ and Npc1−/− MEFs. See also Figure S1I. (G) Immunofluorescence staining with anti-Rab7, anti-tubulin, anti-M6PR and anti-LBPA antibodies in Npc1+/+ and Npc1−/− MEFs. Scale bar, 10 μm. Graphical data denote mean ± SEM. ***, p < 0.001; **, p < 0.01; *, p < 0.05; ns, non-significant.
Figure 2
Figure 2. Perturbation of SNARE machinery on late endosomes impairs amphisome formation in NPC1 mutant cells
(A) Fluorescence staining and quantification of colocalization of mRFP-Rab7+ and EGFP-LC3+ vesicles (an indication of amphisome formation) in Npc1+/+ and Npc1−/− MEFs, expressing mRFP-Rab7 and EGFP-LC3 for 24 h and cultured under basal (full medium, FM) and starvation (HBSS; last 1 h) conditions. Scale bar, 10 μm. See also Figure S2A. (B) Fluorescence staining and quantification of colocalization of mRFP-LC3+ and FITC–Dextran+ structures in Npc1+/+ and Npc1−/− MEFs, expressing mRFP-LC3 for 24 h and then incubated in HBSS with Alexa Fluor 488 (FITC)–conjugated Dextran for 15 or 30 min. Scale bar, 10 μm. See also Figure S2C. (C) Co-immunoprecipitation of Flag-Vamp8 and Myc-Syntaxin17 (Stx17) in Npc1+/+ and Npc1−/− MEFs, expressing Myc-Syntaxin17 and either empty vector or Flag-VAMP8 for 24 h, then lysed and immunoprecipitated with anti-Flag beads. Immunoblotting analysis with anti-Myc and anti-Flag antibodies was done on inputs (with equal loading) and immunoprecipitated fractions. (D) Fluorescence staining and quantification of colocalization of Flag-VAMP8+ and Myc-Syntaxin17+ (Stx17) structures in Npc1+/+ and Npc1−/− MEFs, expressing Flag-VAMP8 and Myc-Syntaxin17 for 24 h under basal (full medium, FM) and starvation (HBSS; last 1 h) conditions. Scale bar, 10 μm. (E and F) Fluorescence staining and quantification of colocalization of Flag-VAMP8+ (E) or EGFP-VAMP3+ (F) structures with mRFP-Rab7+ vesicles in Npc1+/+ and Npc1−/− MEFs, expressing mRFP-Rab7 and either Flag-VAMP8 (E) or EGFP-VAMP3 (F) for 24 h. Scale bar, 10 μm. (G) Immunofluorescence staining with anti-Rab7 antibody and quantification of colocalization of Rab7+ and Myc-Syntaxin17+ (Stx17) structures in Npc1+/+ and Npc1−/− MEFs, expressing Myc-Syntaxin17 for 24 h and then starved in HBSS for last 1 h. Scale bar, 10 μm. Graphical data denote mean ± SEM. ***, p < 0.001; **, p < 0.01; *, p < 0.05; ns, non-significant.
Figure 3
Figure 3. Impaired autophagosome maturation retards autophagic cargo clearance in NPC1 mutant cells that are associated with defective mitophagy, whereas lysosomal proteolysis is not perturbed
(A) Fluorescence staining and quantification of autophagosomes (mRFP+-GFP+-LC3) and autolysosomes (mRFP+-GFP -LC3) in Npc1+/+ and Npc1−/− MEFs, expressing mRFP-GFP-LC3 reporter for 24 h. Scale bar, 10 μm. (B) Immunofluorescence staining with anti-p62 antibody and quantification of the percentage of cells exhibiting increased p62+ aggregates in control and NPC1 patient fibroblasts, and in Npc1+/+ and Npc1−/− MEFs. Scale bar, 10 μm. See also Figure S3B. (C) Immunoblot analysis with anti-p62 and anti-actin antibodies in control and NPC1 patient fibroblasts, and in Npc1+/+ and Npc1−/− MEFs. (D) Fluorescence staining and quantification of autophagosome (AP)–associated (mCherry+-GFP+-p62) and autolysosome (AL)–associated (mCherry+-GFP-p62) p62 aggregates in Npc1+/+ and Npc1−/− MEFs, expressing mCherry-GFP-p62 reporter for 24 h. Scale bar, 10 μm. (E) Immunoblot analysis with anti-p62 and anti-actin antibodies in Npc1+/+ and Npc1−/− MEFs, treated with or without 20 μg.mL−1 cycloheximide (CHX) for 4, 8, 12 and 24 h. (F) Immunoblot analyses with anti-DJ-1, anti-Tom20 and anti-actin antibodies in Npc1+/+ and Npc1−/− MEFs. (G) Cell viability and apoptosis analysis with FITC Annexin V and propidium iodide detection by FACS in Npc1+/+ and Npc1−/− MEFs, treated with or without 10 μM CCCP for 18 h. (H) Fluorescence staining and quantification of FITC–Dextran+ and LysoTracker+ structures, and their colocalization in Npc1+/+ and Npc1−/− MEFs, incubated with Alexa Fluor 488 (FITC)–conjugated Dextran for 3 h followed by LysoTracker staining for 1 h. Scale bar, 10 μm. (I) Immunoblot analyses with anti-cathepsin B, anti-cathepsin D and anti-actin antibodies in Npc1+/+ and Npc1−/− MEFs. (J) Immunofluorescence staining with anti-LAMP1 antibody in Npc1+/+ and Npc1−/− MEFs. Scale bar, 10 μm. (K) Cathepsin B activity in Npc1+/+ and Npc1−/− MEFs, and in control and NPC1 patient fibroblasts. Cathepsin B activity is represented as μmole free cathepsin B substrate (AMC) per μg of total protein per 30 min. Graphical data denote mean ± SEM. ***, p < 0.001; **, p < 0.01; *, p < 0.05; ns, non-significant.
Figure 4
Figure 4. Rescue of autophagy defects in NPC1 mutant cells by expressing functional NPC1 protein, whereas cholesterol depletion treatment blocks autophagic flux
(A) Immunoblot analyses with anti-p62, anti-LC3, anti-NPC1, anti-EGFP and anti-actin antibodies in Npc1+/+ and Npc1−/− MEFs, expressing either EGFP or NPC1-EGFP for 48 h. (B and C) Immunofluorescence staining with anti-p62 (B) and anti-LC3 (C) antibodies, and quantification of cells exhibiting accumulated p62+ aggregates (B) and LC3+ vesicles (C) in Npc1+/+ and Npc1−/− MEFs, expressing either EGFP or NPC1-EGFP for 48 h. Arrows (white) show transfected cells whereas arrowhead (orange) denotes a non-transfected cell. Scale bar, 10 μm. (D and E) Filipin staining (D) and quantification of Filipin intensity (E) in Npc1−/− MEFs, either left untreated or treated with 0.1–4% HP-β-cyclodextrin for 24 h. Scale bar, 10 μm. (F) Immunoblot analysis with anti-LC3, anti-p62 and anti-actin antibodies in Npc1+/+ and Npc1−/− MEFs, treated with or without 0.1–4% HP-β-cyclodextrin for 24 h. Low exposures of immunoblots were shown to visualize changes in LC3-II and p62 levels. See also Figure S4E. (G) Immunoblot analysis with anti-LC3, anti-p62 and anti-actin antibodies in rat primary cortical neurons, treated with or without 1% and 4% HP-β-cyclodextrin (HPβCD) for 96 h. See also Figure S4H. (H) Immunoblot analysis with anti-LC3 and anti-actin antibodies in rat primary cortical neurons, treated with or without 1% HP-β-cyclodextrin (HPβCD) for 96 h, in the presence or absence of 400 nM bafilomycin A1 (Baf) for the last 4 h. (I) Fluorescence staining and quantification of autophagosomes (mRFP-LC3+/GFP-LC3+) and autolysosomes (mRFP-LC3+/GFP-LC3 ) in MEFs, expressing mRFP-EGFP-LC3 reporter for 24 h and treated with or without 1% HP-β-cyclodextrin (HPβCD) for 24 h. (J) Immunoblot analysis with anti-LC3, anti-p62 and anti-actin antibodies in Atg5+/+ and Atg5−/− MEFs, treated with or without 1% HP-β-cyclodextrin (HPβCD) for 24 h. Graphical data denote mean ± SEM. ***, p < 0.001; **, p < 0.01; *, p < 0.05; ns, non-significant.
Figure 5
Figure 5. Simulating autophagy rescues autophagy defects in NPC1 mutant cells by facilitating autophagosome maturation independent of amphisome formation, whereas abrogation of autophagy leads to accumulation of intracellular cholesterol
(A) Immunoblot analysis with anti-p62 and anti-actin antibodies in Npc1+/+ and Npc1−/− MEFs, cultured in full medium (FM) with or without 400 nM rapamycin (Rap) or 10 mM lithium (LiCl) for 48 h, or under starvation condition (HBSS; last 4 h). High exposure (HE) and low exposure (LE) of the same immunoblot are shown. (B) Immunoblot analysis with anti-p62 and anti-actin antibodies in control and NPC1 patient fibroblasts, cultured either in basal (full medium; FM) or starvation (HBSS; 6 h) condition. (C) Fluorescence staining and quantification of autophagosomes (mRFP+-GFP+-LC3) and autolysosomes (mRFP+-GFP -LC3) in Npc1−/− MEFs, expressing mRFP-EGFP-LC3 reporter for 24 h and cultured under basal (full medium, FM) or starvation (HBSS; last 1 h) conditions. Cells were subjected to starvation for 1 h to visualize LC3+ vesicles, instead of 4 h where there was a substantial clearance of these vesicles (Figures S5B,C). Scale bar, 10 μm. (D) Fluorescence staining and quantification of mRFP-LC3+ vesicles and their colocalization with LAMP1-EGFP+ structures in NPC1−/− MEFs expressing mRFP-LC3 and LAMP1-EGFP for 24 h, cultured either in basal (full medium; FM) or starvation (HBSS; last 1 h) condition. Cells were subjected to starvation induced autophagy for 1 h as explained above. Scale bar, 10 μm. (E) Immunoblot analysis with anti-p62 and anti-actin antibodies in Npc1+/+ and Npc1−/− MEFs, where Npc1−/− MEFs were treated with or without 400 nM rapamycin (Rap) or 10 mM lithium (LiCl) for 48 h, in the presence or absence of 0.2% HP-β-cyclodextrin (HPβCD) for last 24 h. (F and G) Filipin staining (F) and quantification of Filipin intensity (G) in Atg5+/+ and Atg5−/− MEFs, Npc1+/+ (Baf; 24 h), and in Npc1−/− MEFs treated with or without 400 nM bafilomycin A1MEFs, either left untreated (UT) or treated with 200 nM rapamycin (Rap; 48 h), 10 mM lithium (LiCl, 48 h), 0.2% HP-β-cyclodextrin (HPβCD; 24 h) or a combination of compounds as indicated. Scale bar, 10 μm. (H) Cell viability and apoptosis analysis with FITC–Annexin V and propidium iodide detection by FACS in Npc1+/+ and Npc1−/− MEFs, treated with or without 200 nM rapamycin (Rap), 0.2% HP-β-cyclodextrin (HPβCD) or both for 48 h, in the presence or absence of 10 μM CCCP for last 18 h. Graphical data denote mean ± SEM. ***, p < 0.001; **, p < 0.01; *, p < 0.05; ns, non-significant.
Figure 6
Figure 6. Impaired autophagic flux in vivo in organs from Npc1−/− mice and rescue of cell death in neurons with NPC1 knockdown
(A and B) Immunoblot analyses with anti-NPC1, anti-p62, anti-LC3 and anti-actin antibodies in cerebellum (A) and liver (B) tissues from Npc1+/+ and Npc1−/− mice. (C) Immunoblot analyses with anti-NPC1, and anti-actin antibodies in primary mouse neural stem cells transduced with 5 different lentiviral Npc1 shRNAs or control (Con) shRNA. High (HE) and low (LE) exposures of the same immunoblot are shown. Densitometric analysis was done on low exposures of immunoblots. (D) Immunofluorescence staining with anti-LC3 and anti-Tuj1 antibodies in neurons differentiated from mouse neural stem cells expressing control (Con) or Npc1_2 shRNA. Scale bar, 10 μm. (E) Immunoblot analyses with anti-NPC1, anti-p62, anti-LC3 and anti-actin antibodies in neurons differentiated from mouse neural stem cells expressing control (Con) or Npc1_2 shRNA. (F) Immunoblot analysis with anti-LC3 and anti-actin antibodies in neurons differentiated from mouse neural stem cells expressing control (Con) or Npc1_2 shRNA, treated with or without 400 nM bafilomycin A1 (Baf) for 4 h. (G) Immunoblot analysis with anti-p62 and anti-actin antibodies in neurons differentiated from mouse neural stem cells expressing Npc1_2 shRNA, treated with or without 200 nM rapamycin (Rap), 0.2% HP-β-cyclodextrin (HPβCD) or both for 72 h. (H) Immunofluorescence staining with anti-Tuj1 antibody in neurons differentiated from mouse neural stem cells expressing control (Con) or Npc1_2 shRNA. Nuclei stained with DAPI and arrow shows an apoptotic nucleus. Scale bar, 10 μm. (I) Analysis of cell death in Tuj1+ neurons differentiated from mouse neural stem cells expressing control (Con) or Npc1_2 shRNA, where neurons with NPC1 knockdown were treated with or without 200 nM rapamycin (Rap), 0.2% HP-β-cyclodextrin (HPβCD) or both for 72 h. Graphical data denote mean ± SEM. ***, p < 0.001; **, p < 0.01; *, p < 0.05; ns, non-significant.
Figure 7
Figure 7. Schematic representation of defective autophagy and the effects of its stimulation in NPC1 disease
Mutations in the NPC1 protein inhibit cholesterol efflux and accumulate cholesterol in the LE/L compartments. Additionally, mutations in the NPC1 protein impair autophagosome maturation, leading to a block in autophagy associated with accumulation of autophagosomes (LC3+ vesicles) and autophagy substrates (p62 and mitochondria). This is attributed to defective amphisome formation where the autophagosomes fail to fuse with late endosomes (Rab7+ vesicles) due to the inability of NPC1–deficient late endosomes to recruit components of SNARE machinery, such as VAMP8 and VAMP3, which regulate this fusion event. NPC1 mutations also deplete DJ-1, leading to mitochondrial fragmentation and accumulation of damaged mitochondria due to impaired mitophagy. Upregulation of autophagy (such as by starvation and small molecules) bypasses the autophagy block in NPC1 mutant cells and rescues the autophagy defects by facilitating autophagosome maturation through their fusion with the lysosomes independent of amphisome formation, thereby mediating to the clearance of autophagic cargo.

References

    1. Berg TO, Fengsrud M, Stromhaug PE, Berg T, Seglen PO. Isolation and characterization of rat liver amphisomes. Evidence for fusion of autophagosomes with both early and late endosomes. J Biol Chem. 1998;273:21883–21892. - PubMed
    1. Carstea ED, Morris JA, Coleman KG, Loftus SK, Zhang D, Cummings C, Gu J, Rosenfeld MA, Pavan WJ, Krizman DB, et al. Niemann-Pick C1 disease gene: homology to mediators of cholesterol homeostasis. Science. 1997;277:228–231. - PubMed
    1. Elrick MJ, Yu T, Chung C, Lieberman AP. Impaired proteolysis underlies autophagic dysfunction in Niemann-Pick type C disease. Hum Mol Genet. 2012;21:4876–4887. - PMC - PubMed
    1. Fader CM, Sanchez DG, Mestre MB, Colombo MI. TI-VAMP/VAMP7 and VAMP3/cellubrevin: two v-SNARE proteins involved in specific steps of the autophagy/multivesicular body pathways. Biochim Biophys Acta. 2009;1793:1901–1916. - PubMed
    1. Hara T, Nakamura K, Matsui M, Yamamoto A, Nakahara Y, Suzuki-Migishima R, Yokoyama M, Mishima K, Saito I, Okano H, et al. Suppression of basal autophagy in neural cells causes neurodegenerative disease in mice. Nature. 2006;441:885–889. - PubMed

Publication types