. 2013 Dec 9;24(6):766-76.
doi: 10.1016/j.ccr.2013.10.022. Epub 2013 Nov 27.

Direct reversal of glucocorticoid resistance by AKT inhibition in acute lymphoblastic leukemia

Affiliations

Direct reversal of glucocorticoid resistance by AKT inhibition in acute lymphoblastic leukemia

Erich Piovan et al. Cancer Cell. .

Abstract

Glucocorticoid resistance is a major driver of therapeutic failure in T cell acute lymphoblastic leukemia (T-ALL). Here, we identify the AKT1 kinase as a major negative regulator of the NR3C1 glucocorticoid receptor protein activity driving glucocorticoid resistance in T-ALL. Mechanistically, AKT1 impairs glucocorticoid-induced gene expression by direct phosphorylation of NR3C1 at position S134 and blocking glucocorticoid-induced NR3C1 translocation to the nucleus. Moreover, we demonstrate that loss of PTEN and consequent AKT1 activation can effectively block glucocorticoid-induced apoptosis and induce resistance to glucocorticoid therapy. Conversely, pharmacologic inhibition of AKT with MK2206 effectively restores glucocorticoid-induced NR3C1 translocation to the nucleus, increases the response of T-ALL cells to glucocorticoid therapy, and effectively reverses glucocorticoid resistance in vitro and in vivo.


Figures

Figure. 1
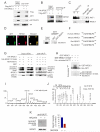
Figure. 1. AKT1 interacts with the glucocorticoid receptor protein and regulates NR3C1 S134 phosphorylation
(A) Western blot analysis of AKT1 and activated AKT1 after NR3C1 immunoprecipitation in 293T cells expressing Flag-tagged AKT1 and HA-tagged NR3C1. (B) NR3C1 western blot analysis after AKT1 immunoprecipitation in 293T cells expressing Flag-tagged AKT1 and HA-tagged NR3C1. (C) Western blot analysis of AKT1 after NR3C1 protein immunoprecipitation in DND-41 T-ALL cells. (D) Immunofluorescence colocalization analysis of AKT (green) and NR3C1 (red) proteins in DND41 cells. Cell nuclei stained with TO-PRO3 are shown in blue. Scale bar: 10 μm. (E) Analysis of AKT1-NR3C1 interaction via Western blot analysis of protein complexes recovered after NR3C1-GST pull down of recombinant His-tagged AKT1. (F) Partial alignment of the glucocorticoid receptor protein sequences flanking S134. (G) Western blot analysis of NR3C1 phosphorylation using an antibody against the AKT phospho-motif in NR3C1 protein immunoprecipitates from U2OS cells expressing MYR-AKT1 together with HA-NR3C1 or HA-NR3C1 S134A. (H) In vitro kinase analysis of AKT1 phosphorylation of recombinant NR3C1 (GST-NR3C1) and NR3C1 S134A mutant (GST-NR3C1 S134A) proteins. Top panel shows P-32 autoradiography after SDS-PAGE and corresponding protein loading is shown at the bottom. (I) ESI-MS/MS spectrum of monophosphorylated peptide STpS134VPENPK (S132 to K140) obtained after trypsin digestion of NR3C1 isolated from cells expressing constitutively active AKT1. (J) Collision induced dissociation of the molecular ion, [M+2H]2+ at m/z 519.72 (M = 1037.42 Da) corresponding to S134. Characteristic b- and y-fragment ions including y7 which contains pSer and features the loss of 98 Da (elimination of phosphoric acid) are shown. (K) Western blot analysis of NR3C1 phosphorylation using an anti AKT phospho-motif antibody in NR3C1 immunoprecipitates from CCRF-CEM cells expressing HA-NR3C1 treated with vehicle or the MK2206 AKT inhibitor. See also Figure S1 and Table S1.
Figure. 2
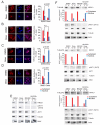
Figure. 2. AKT1-mediated S134 phosphorylation of the NRC3C1 protein impairs dexamethasone-induced glucocorticoid receptor nuclear translocation
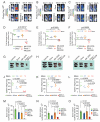
(A-D) Confocal microscopy analysis and quantitation of the distribution of NR3C1 cellular localization in U2OS cells expressing HA-NRC31 (A), HA-NRC31 and MYR-AKT1 (B), HA-NRC31 S134A (C), or HA-NRC31 S134A and MYR-AKT1 in basal conditions (DMSO) and after dexamethasone (Dexa; 1 μM) stimulation. Scale bar for all panels: 20 μm. (E) Cellular localization analysis of NR3C1 via nuclear and cytoplasmic cell fractionation and analysis of AKT1 signaling in cell lysates from CCRF-CEM T-ALL cells treated with vehicle only (DMSO), dexamethasone (Dexa; 1 μM), the MK2206 AKT inhibitor (1 μM) and MK2206 plus dexamethasone (1 μM each). (F) Cellular localization analysis of NR3C1 via Western blot analysis of nuclear and cytoplasmic cell fractions in cell lysates from primograft T-ALL lymphoblasts. Tubulin and MAX proteins are shown as controls for cytosolic and nuclear fractions. C: cytoplasmic fraction; N: nuclear fraction. Data in A-D are represented as mean ± SD. See also Figure S2.
Figure 3
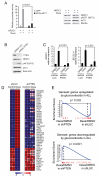
Figure 3. AKT activation inhibits glucocorticoid-induced gene expression
(A) Luciferase reporter analysis of dexamethasone-induced glucocorticoid receptor transactivation in U2OS cells expressing MYR-AKT1 compared with GFP only expressing controls using a synthetic glucocorticoid response element reporter. (B) Western blot analysis of PTEN expression and AKT activation in DND41 T-ALL cells infected with lentiviruses expressing a PTEN shRNA construct (shRNA PTEN) or a control shRNA targeting the Renilla luciferase gene (shRNA LUC). (C) RT-PCR analysis of glucocorticoid regulated transcripts in control and PTEN knockdown DND41 cells treated with vehicle (DMSO) only or 1 μM dexamethasone (Dexa). (D) Heat map representation of the top differentially expressed genes between control DND41 cells treated with vehicle only (Control) vs. 1 μM dexamethasone (Dexa) and corresponding transcript levels in control and dexamethasone treated PTEN knockdown cells. The scale bar shows color coded differential expression with red indicating higher levels and blue lower levels of expression. (E) GSEA analysis of genes regulated by glucocorticoids in ALL patients undergoing glucocorticoid therapy in DND41 shRNA LUC dexamethasone treated cells compared with DND41 shRNA PTEN dexamethasone treated cells. Data in A and C are represented as mean ± SD. See also Figure S3.
Figure. 4
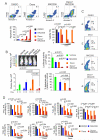
Figure. 4. Pharmacologic inhibition of AKT with MK2206 reverses glucocorticoid resistance
(A) Representative plots of apoptosis and cell viability quantification in CCRF-CEM T-ALL cells treated with vehicle only, MK2206 (100 nM), dexamethasone (Dexa; 1 μM) or dexamethasone plus MK2206 (Dexa + MK2206; 1 μM and 100 nM, respectively) in combination in vitro. (B) Tumor load quantification in vivo by bioluminescence imaging and analysis of luciferase activity and human CD45 expressing cells in the bone marrow of CCRF-CEM T-ALL xenografts treated with vehicle only, MK2206 (10 mg kg−1 via oral gavage twice a day), dexamethasone (5 mg kg−1 via intraperitoneal injection) or MK2206 (10 mg kg−1 twice a day) plus dexamethasone (5 mg kg−1). (C-D) Representative plots (C) and quantification (D) of cell viability in primograft T-ALL samples treated with vehicle only, MK2206 (100 nM-10 μM), dexamethasone (10 nM-1 μM) alone and dexamethasone (10 nM-1 μM) plus MK2206 (100 nM-10 μM) in combination. Percentages of viable (PI −), and non-viable (PI +) cells are indicated. Bar graphs represent mean ± SD. See also Figures S1 and S5.
Figure 5
Figure 5. Pharmacologic inhibition of AKT reverses glucocorticoid resistance in primary human T-ALL xenografts in vivo
(A-C) Representative examples of tumor load analysis via in vivo bioluminescence imaging in mice xenografted with three independent human T-ALLs treated with vehicle only, MK2206 (10 mg kg−1 twice a day), dexamethasone (5 mg kg−1) or MK2206 (10 mg kg−1 twice a day) plus dexamethasone (5 mg kg−1). (D-F) Quantitative analysis of tumor load and therapy response based on luciferase activity. (G-I) Representative images of spleens in primary T-ALL xenografted mice at the end of treatment. (J-L) Quantitative analysis of tumor burden estimated by spleen weight in T-ALL xenografted mice at the end of treatment. (M-O) Quantitative analysis of tumor burden estimated by luciferase counts in bone marrow in T-ALL xenografted mice at the end of treatment. Panels A, D, G, J and M correspond to T-ALL#27. Panels B, E, H, K, N correspond to T-ALL #19. Panels C, F, I, L and O correspond to T-ALL #9. Scale bar: 2 cm. Bar graphs in M-O represent mean ± SD. See also Figure S5.
Figure 6
Figure 6. Pharmacologic inhibition of AKT reverses glucocorticoid resistance in a mouse model of glucorticoid resistant T-ALL
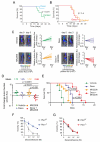
(A) Kaplan-Meier curve in mice treated with dexamethasone (Dexa) or vehicle (Control) after allograft transplantation of Pten-non-deleted (Ptenf/f) NOTCH1-induced T-ALL tumor cells. Arrows indicate drug treatment. (B) Kaplan-Meier curve in mice treated with dexamethasone (Dexa) or vehicle (Control) after allograft transplantation of Pten-deleted (Pten−/−) NOTCH1-induced T-ALL tumor cells. Arrows indicate drug treatment. (C, D) Representative images, changes in bioluminescence by in vivo imaging and analysis of treatment response in mice allografted with NOTCH1-induced Pten−/− mouse leukemia cells treated with vehicle only, MK2206 (10 mg kg−1 via oral gavage twice a day), dexamethasone (Dexa; 5 mg kg−1) or MK2206 (10 mg kg−1 twice a day) plus dexamethasone (5 mg kg−1) (Dexa + MK2206). (E) Kaplan-Meier overall survival curve in mice allografted with NOTCH1-induced Pten−/− mouse leukemia cells and treated with vehicle only (control), MK2206 (10 mg kg−1 via oral gavage twice a day), dexamethasone (Dexa; 5 mg kg−1) or MK2206 (10 mg kg−1 twice a day), plus dexamethasone (5 mg kg−1) (Dexa + MK2206). (F, G) Quantification of glucocorticoid-induced loss of viability in isogenic NOTCH1-induced Ptenf/f or Pten−/− mouse leukemia cells infected with retroviruses expressing the wild type (F) or the S134A mutant (G) glucocorticoid receptor NR3C1. Data in F and G are represented as mean ± SD. See also Figure S6.

Similar articles

Cited by

References

    1. Armstrong F, Brunet de la Grange P, Gerby B, Rouyez MC, Calvo J, Fontenay M, Boissel N, Dombret H, Baruchel A, Landman-Parker J, et al. NOTCH is a key regulator of human T-cell acute leukemia initiating cell activity. Blood. 2009;113:1730–1740. - PubMed
    1. Ayroldi E, Zollo O, Bastianelli A, Marchetti C, Agostini M, Di Virgilio R, Riccardi C. GILZ mediates the antiproliferative activity of glucocorticoids by negative regulation of Ras signaling. The Journal of clinical investigation. 2007;117:1605–1615. - PMC - PubMed
    1. Bandapalli OR, Zimmermann M, Kox C, Stanulla M, Schrappe M, Ludwig WD, Koehler R, Muckenthaler MU, Kulozik AE. NOTCH1 activation clinically antagonizes the unfavorable effect of PTEN inactivation in BFM-treated children with precursor T-cell acute lymphoblastic leukemia. Haematologica. 2013;98:928–936. - PMC - PubMed
    1. Beesley AH, Firth MJ, Ford J, Weller RE, Freitas JR, Perera KU, Kees UR. Glucocorticoid resistance in T-lineage acute lymphoblastic leukaemia is associated with a proliferative metabolism. British journal of cancer. 2009;100:1926–1936. - PMC - PubMed
    1. Bhadri VA, Trahair TN, Lock RB. Glucocorticoid resistance in paediatric acute lymphoblastic leukaemia. Journal of paediatrics and child health. 2012;48:634–640. - PubMed

Publication types

MeSH terms

Associated data