. 2014 Jul:409:161-73.
doi: 10.1016/j.jim.2013.11.021. Epub 2013 Nov 28.

Development of a luciferase based viral inhibition assay to evaluate vaccine induced CD8 T-cell responses

Affiliations

Development of a luciferase based viral inhibition assay to evaluate vaccine induced CD8 T-cell responses

Marloes A Naarding et al. J Immunol Methods. 2014 Jul.

Abstract

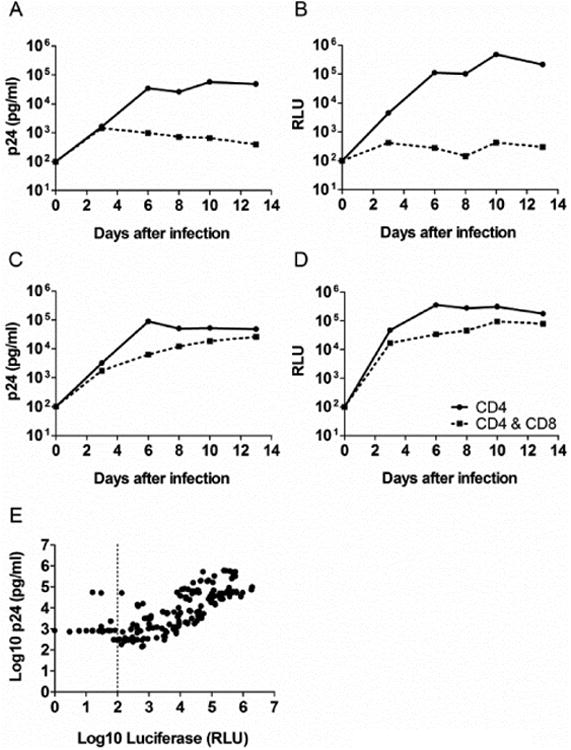
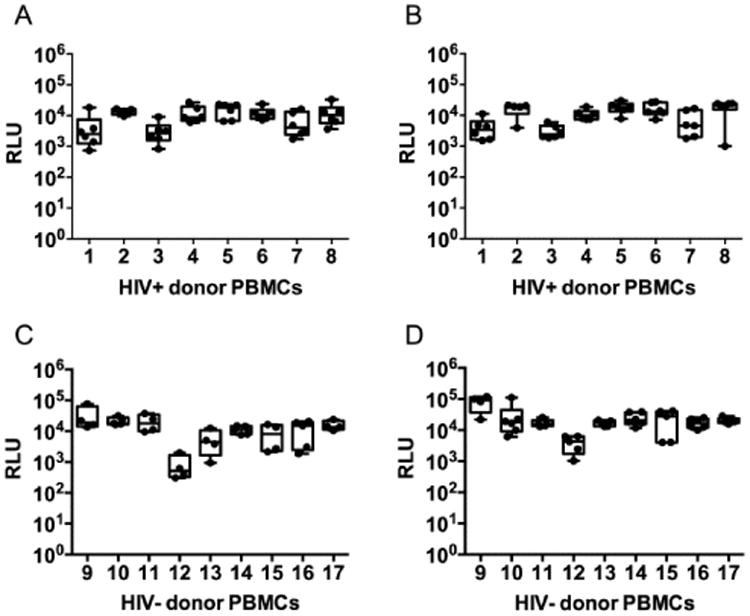
Emergence of SIV and HIV specific CD8 T cells has been shown to correlate with control of in vivo replication. Poor correlation between IFN-γ ELISPOT responses and in vivo control of the virus has triggered the development of more relevant assays to assess functional HIV-1 specific CD8 T-cell responses for the evaluation and prioritization of new HIV-1 vaccine candidates. We previously established a viral inhibition assay (VIA) that measures the ability of vaccine-induced CD8 T-cell responses to inhibit viral replication in autologous CD4 T cells. In this assay, viral replication is determined by measuring p24 in the culture supernatant. Here we describe the development of a novel VIA, referred to as IMC LucR VIA that exploits replication-competent HIV-1 infectious molecular clones (IMCs) in which the complete proviral genome is strain-specific and which express the Renilla luciferase (LucR) gene to determine viral growth and inhibition. The introduction of the luciferase readout does provide significant improvement of the read out time. In addition to switching to the LucR read out, changes made to the overall protocol resulted in the miniaturization of the assay from a 48 to a 96-well plate format, which preserved sample and allowed for the introduction of replicates. The overall assay time was reduced from 13 to 8 days. The assay has a high degree of specificity, and the previously observed non-specific background inhibition in cells from HIV-1 negative volunteers has been reduced dramatically. Importantly, we observed an increase in positive responses, indicating an improvement in sensitivity compared to the original VIA. Currently, only a limited number of "whole-genome" IMC-LucR viruses are available and our efforts will focus on expanding the panel to better evaluate anti-viral breadth. Overall, we believe the IMC LucR VIA provides a platform to assess functional CD8 T-cell responses in large-scale clinical trial testing, which will enhance the ability to select the most promising HIV-1 vaccine candidates capable of controlling HIV-1 replication in vivo.

Keywords: CD8 T cells; HIV; Infectious molecular clones; Renilla reniformis luciferase; Vaccine Clinical trial; Viral inhibition assay.


Figures

Fig. 1
Fig. 1
Virus characterization. (A) Infection of HIV negative CD4 T cells with NL4.3, NLLucR.T2A, CH077.t and CH077.t-LucR T2A. P24 concentrations were determined in the culture supernatant (ELISA). (B) Infection kinetics of HIV negative CD4 T cells with NLLucR.T2A and CH077.t-LucR T2A using Renilla Luciferase activity in the cells as read-out at different time points during replication. (C & D) Determination of stability of Renilla luciferase expression relative to viral infectivity for luciferase containing IMCs. HIV negative CD4 T cells were infected with the luciferase containing virus and supernatant was collected at different time points (depicted on the X-axis). The supernatants were used to infect TZMbl cells. The ratio between virus-encoded Renilla and cell-encoded firefly luciferase (expressed by the TZMbl cells upon infection) is depicted. (C) NL-LucR.T2A (D) CH077.t-LucR T2A
Fig. 2
Fig. 2
Correlation between p24 and Luciferase read out. (A-D) An example of the replication curves based on the p24 and luciferase read out in the VIA when infecting with CH077.t-LucR T2A. (A) Replication in HIV-1 negative CD4 T cells, in the presence or absence of autologous CD8 T cells, based on p24 concentrations in the culture supernatant. (B) Replication in HIV-1 negative CD4 T cells, in the presence or absence of autologous CD8 T cells, based on luciferase read out. (C) Replication in HIV-1 positive CD4 T cells, in the presence or absence of autologous CD8 T cells, based on p24 concentrations in the culture supernatant. (D) Replication in HIV-1 positive CD4 T cells, in the presence or absence of autologous CD8 T cells, based on Luciferase read out. E. Correlation between p24 and Luciferase read out for both NL-LucR T2A and CH077.t-LucR T2A. The data is combined from 4 independent experiments with a total N of 172. The Pearson correlation was determined.
Fig. 3
Fig. 3
The influence of CD8-CD4 T cell ratio on the level of non-specific inhibition in the IMC LucR VIA. (A & B) The experiment was performed in triplicate and the log inhibition was determined by subtracting the average RLU for infected CD4 cells + CD8 T cells from infected CD4 T cells. The black bars represent the PBMCs from a HIV-1 negative donor and the hashed bars represent the results when using PBMCs from a HIV-1 positive donor. (A) NL-LucR.T2A (B) CH077.t-LucR.T2A. The data is from a representative experiment, repeated 3 times. (C) The effect of CD8 & CD4 T cell ratio in the IMC LucR VIA on the non-specific background inhibition is shown. The data is determined on PBMCs from 9 different HIV-1 negative volunteers and the results for NL-LucR T2A and CH077.t-LucR T2A were combined. (D) The log inhibition was determined on PBMCs from 8 HIV-1 positive volunteers for different CD8 & CD4 T cell ratios. The results for both NL-LucR T2A and CH077.t-LucR T2A were combined. Both box and whiskers graphs represent the 95 percentile, the median is depicted by the line in the box and the maximum and minimum values are depicted as the whiskers. A paired T-test was performed using GraphPad Prism version 5 to determine significance.
Fig. 4
Fig. 4
Comparison of the non-specific background inhibition between the first generation VIA and the IMC LucR VIA. IIIB was compared to NL-LucR T2A and CH077 was compared to CH077.t-LucR T2A for the first generation VIA and the IMC LucR VIA, respectively. (A) The PBMCs used were all from pre-immunization time points and the results from NL-LucR T2A and CH077.t-LucR T2A were combined, resulting in an N of 56 (N = 28 for each virus). A paired T test was performed using GraphPad Prism version 5 to determine significance. The box and whiskers graph represent the 95 percentile, the median is depicted by the line in the box and the maximum and minimum values are depicted as the whiskers. The cut off for each assay are depicted as an dotted line. (B) The correlation was determined between the first generation VIA and the IMC LucR VIA for both virus comparisons combined. The data is comprised of data from 40 patients and 68 different time points, varying from before or after immunization. The vertical and horizontal dotted lines represent the cut off of the first generation VIA and the IMC LucRVIA, respectively. A Pearson correlation was performed using GraphPad Prism version 5. Depicted in the graph by the dashed line is the standard error of the linear regression.
Fig. 5
Fig. 5
Assay variability for the infection of CD4 T cells of the IMC LucR VIA. The rate of infection of CD4 T cells in 4 to 6 independent experiments performed by two different operators is depicted for each donor. Eight HIV-1 positive and nine HIV-1 negative donor PBMCs were tested (A) Cells derived from HIV-1 positive individuals infected with NL-LucR T2A. (B) Cells derived from HIV-1 positive individuals infected with CH077.t-LucR T2A. (C) Cells derived from HIV-1 negative individuals infected with NL-LucR T2A. (D) Cells derived from HIV-1 negative individuals infected with CH077.t-LucR T2A. The box and whiskers graphs represent the 95 percentile, the median is depicted by the line in the box and the maximum and minimum values are depicted as the whiskers. In addition to the box and whiskers all individual data points are shown as dots.
Fig. 6
Fig. 6
Assay specificity and inter assay variability for the log inhibition of the IMC LucR VIA. The log inhibition of 4 to 6 independent experiments performed by two different operators is depicted for each donor. The log inhibition was determined by subtracting the average RLU of the triplicates in each experiment for infected CD4 cells + CD8 T cells from infected CD4 T cells alone. Eight HIV-1 positive and nine HIV-1 negative donor PBMCs were tested (A) Cells derived from HIV-1 positive individuals infected with NL-LucR T2A. (B) Cells derived from HIV-1 positive individuals infected with CH077.t-LucR T2A. (C) Cells derived from HIV-1 negative individuals infected with NL-LucR T2A. (D) Cells derived from HIV-1 negative individuals infected with CH077.t-LucR.T2A. The assay cut off is depicted as a dotted line in each graph. The box and whiskers graphs represent the 95 percentile, the median is depicted by the line in the box and the maximum and minimum values are depicted as the whiskers. In addition to the box and whiskers all individual data points are shown as dots.

References

    1. Akinsiku OT, Bansal A, Sabbaj S, Heath SL, Goepfert PA. Interleukin-2 production by polyfunctional HIV-1-specific CD8 T cells is associated with enhanced viral suppression. J Acquir Immune Defic Syndr. 2011;58:132–40. - PMC - PubMed
    1. Baier M, Werner A, Bannert N, Metzner K, Kurth R. HIV suppression by interleukin-16. Nature. 1995;378:563. - PubMed
    1. Bennett MS, Ng HL, Ali A, Yang OO. Cross-clade detection of HIV-1-specific cytotoxic T lymphocytes does not reflect cross-clade antiviral activity. The Journal of infectious diseases. 2008;197:390–7. - PubMed
    1. Bentham M, Mazaleyrat S, Harris M. Role of myristoylation and N-terminal basic residues in membrane association of the human immunodeficiency virus type 1 Nef protein. The Journal of general virology. 2006;87:563–71. - PubMed
    1. Berger EA. HIV entry and tropism: the chemokine receptor connection. AIDS. 1997;11(A):S3–16. - PubMed

Publication types

MeSH terms

Substances