Heat shock factor 1 confers resistance to Hsp90 inhibitors through p62/SQSTM1 expression and promotion of autophagic flux
- PMID: 24291777
- PMCID: PMC3934577
- DOI: 10.1016/j.bcp.2013.11.014
Heat shock factor 1 confers resistance to Hsp90 inhibitors through p62/SQSTM1 expression and promotion of autophagic flux
Abstract
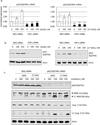
Heat shock protein 90 (Hsp90) has an important role in many cancers. Biochemical inhibitors of Hsp90 are in advanced clinical development for the treatment of solid and hematological malignancies. At the cellular level, their efficacy is diminished by the fact that Hsp90 inhibition causes activation of heat shock factor 1 (HSF1). We report a mechanism by which HSF1 activation diminishes the effect of Hsp90 inhibitors geldanamycin and 17-allylaminogeldanamycin (17-AAG, tanespimycin). Silencing HSF1 with siRNA or inhibiting HSF1 activity with KRIBB11 lowers the threshold for apoptosis in geldanamycin and 17-AAG-treated cancer cells. Autophagy also mitigates the actions of Hsp90 inhibitors. Blocking autophagy with 3-methyladenine (3-MA), bafilomycin A1, or beclin 1 siRNA also lower the threshold for apoptosis. Exploring a potential relationship between HSF1 and autophagy, we monitored autophagosome formation and autophagic flux in control and HSF1-silenced cells. Results show HSF1 is required for autophagy in Hsp90 inhibitor-treated cells. The reduced autophagy observed in HSF1-silenced cells correlates with enhanced cell death. To investigate how HSF1 promotes autophagy, we monitored the expression of genes involved in the autophagic cascade. These data show that sequestosome 1 (p62/SQSTM1), a protein involved in the delivery of autophagic substrates and nucleation of autophagosomes, is an HSF1-regulated gene. Gene silencing was used to evaluate the significance of p62/SQSTM1 in Hsp90 inhibitor resistance. Cells where p62/SQSTM1 was silenced showed a dramatic increase in sensitivity to Hsp90 inhibitors. Results highlight the importance of HSF1 and HSF1-dependent p62/SQSTM1 expression in resistance Hsp90 inhibitors, underscoring the potential of targeting HSF1 to improve the efficacy of Hsp90 inhibitors in cancer.
Keywords: 17-AAG; 17-N-allylamino-17-demethoxygeldanamycin; ATG; Autophagy; Cancer; DMSO; HSE; HSF1; Hsp; Hsp90; LC3; SQSTM1; autophagy-related gene; dimethyl sulfoxide; heat shock element; heat shock factor 1; heat shock protein; microtubule-associated protein 1 light chain 3; p62/SQSTM1; sequestesome 1.
Copyright © 2013 Elsevier Inc. All rights reserved.
Figures


Similar articles
-
Molecular stress-inducing compounds increase osteoclast formation in a heat shock factor 1 protein-dependent manner.J Biol Chem. 2014 May 9;289(19):13602-14. doi: 10.1074/jbc.M113.530626. Epub 2014 Apr 1. J Biol Chem. 2014. PMID: 24692538 Free PMC article.
-
Targeting SQSTM1/p62 induces cargo loading failure and converts autophagy to apoptosis via NBK/Bik.Mol Cell Biol. 2014 Sep 15;34(18):3435-49. doi: 10.1128/MCB.01383-13. Epub 2014 Jul 7. Mol Cell Biol. 2014. PMID: 25002530 Free PMC article.
-
Activation of heat shock factor 1 plays a role in pyrrolidine dithiocarbamate-mediated expression of the co-chaperone BAG3.Int J Biochem Cell Biol. 2010 Nov;42(11):1856-63. doi: 10.1016/j.biocel.2010.07.021. Epub 2010 Aug 6. Int J Biochem Cell Biol. 2010. PMID: 20692357 Free PMC article.
-
Hsp90 molecular chaperone inhibitors: are we there yet?Clin Cancer Res. 2012 Jan 1;18(1):64-76. doi: 10.1158/1078-0432.CCR-11-1000. Clin Cancer Res. 2012. PMID: 22215907 Free PMC article. Review.
-
On mechanisms that control heat shock transcription factor activity in metazoan cells.Cell Stress Chaperones. 2004 Summer;9(2):122-33. doi: 10.1379/csc-14r.1. Cell Stress Chaperones. 2004. PMID: 15497499 Free PMC article. Review.
Cited by
-
HSF1Base: A Comprehensive Database of HSF1 (Heat Shock Factor 1) Target Genes.Int J Mol Sci. 2019 Nov 19;20(22):5815. doi: 10.3390/ijms20225815. Int J Mol Sci. 2019. PMID: 31752429 Free PMC article.
-
The Role of Heat Shock Proteins and Autophagy in Mechanisms Underlying Effects of Sulforaphane on Doxorubicin-Induced Toxicity in HEK293 Cells.Physiol Res. 2023 Jun 9;72(S1):S47-S59. doi: 10.33549/physiolres.935107. Physiol Res. 2023. PMID: 37294118 Free PMC article.
-
Dorsomorphin induces cancer cell apoptosis and sensitizes cancer cells to HSP90 and proteasome inhibitors by reducing nuclear heat shock factor 1 levels.Cancer Biol Med. 2019 May;16(2):220-233. doi: 10.20892/j.issn.2095-3941.2018.0235. Cancer Biol Med. 2019. PMID: 31516744 Free PMC article.
-
HSF1 Attenuates the Release of Inflammatory Cytokines Induced by Lipopolysaccharide through Transcriptional Regulation of Atg10.Microbiol Spectr. 2023 Feb 14;11(1):e0305922. doi: 10.1128/spectrum.03059-22. Epub 2023 Jan 4. Microbiol Spectr. 2023. PMID: 36598250 Free PMC article.
-
HSF1 is a driver of leukemia stem cell self-renewal in acute myeloid leukemia.Nat Commun. 2022 Oct 16;13(1):6107. doi: 10.1038/s41467-022-33861-1. Nat Commun. 2022. PMID: 36245043 Free PMC article.
References
-
- Whitesell L, Lindquist SL. HSP90 and the chaperoning of cancer. Nat Rev Cancer. 2005;5:761–772. - PubMed
-
- Modi S, Stopeck A, Linden H, Solit D, Chandarlapaty S, Rosen N, et al. HSP90 inhibition is effective in breast cancer: a phase II trial of tanespimycin (17-AAG) plus trastuzumab in patients with HER2-positive metastatic breast cancer progressing on trastuzumab. Clin Cancer Res. 2011;17:5132–5139. - PubMed
-
- Goldman JW, Raju RN, Gordon GA, El-Hariry I, Teofilivici F, Vukovic VM, et al. A first in human, safety, pharmacokinetics, and clinical activity phase I study of once weekly administration of the Hsp90 inhibitor ganetespib (STA-9090) in patients with solid malignancies. BMC Cancer. 2013;13:152. - PMC - PubMed
Publication types
MeSH terms
Substances
Grants and funding
LinkOut - more resources
Full Text Sources
Other Literature Sources
Research Materials

