. 2014 Jan;16(1):27-37.
doi: 10.1038/ncb2881. Epub 2013 Dec 1.

Cell-to-cell expression variability followed by signal reinforcement progressively segregates early mouse lineages

Affiliations

Cell-to-cell expression variability followed by signal reinforcement progressively segregates early mouse lineages

Yusuke Ohnishi et al. Nat Cell Biol. 2014 Jan.

Abstract

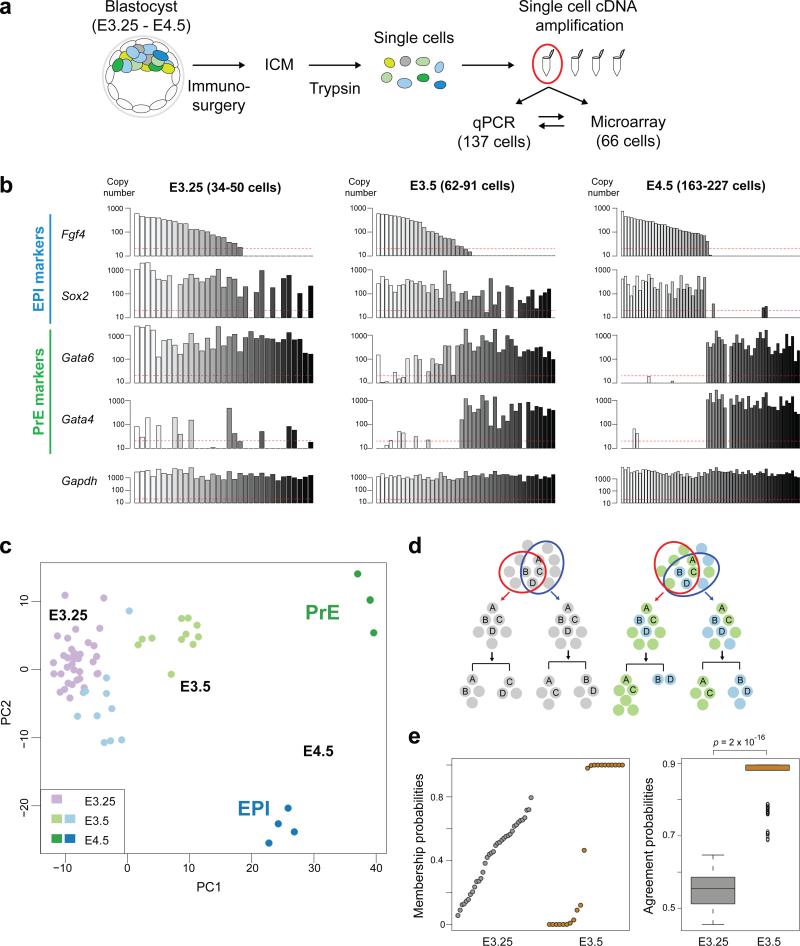
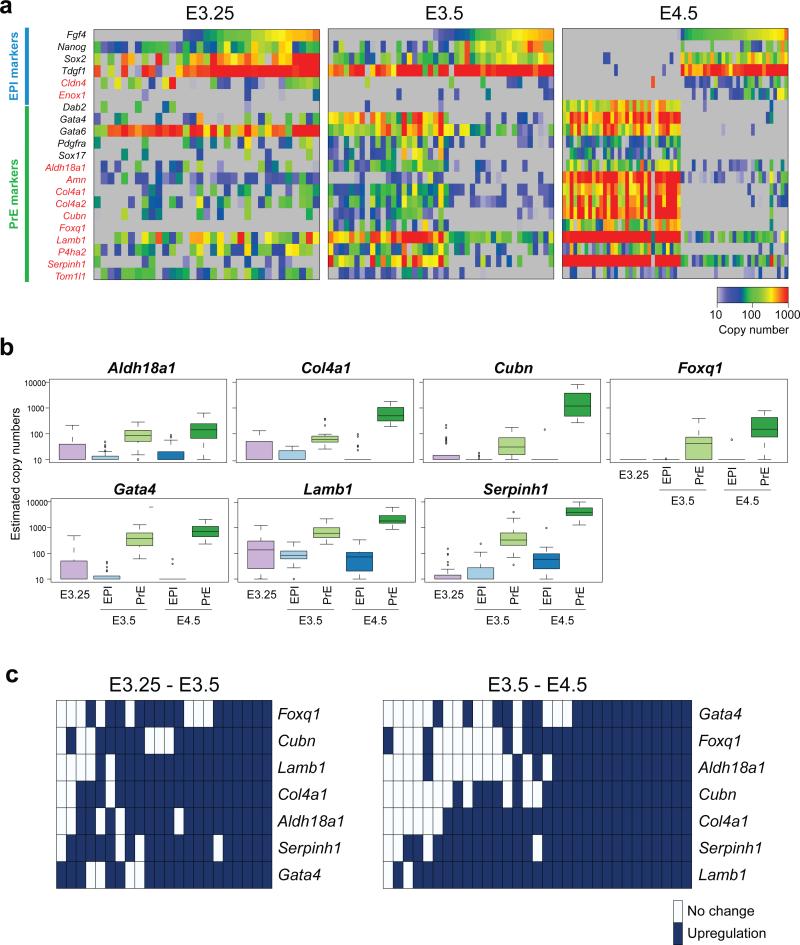
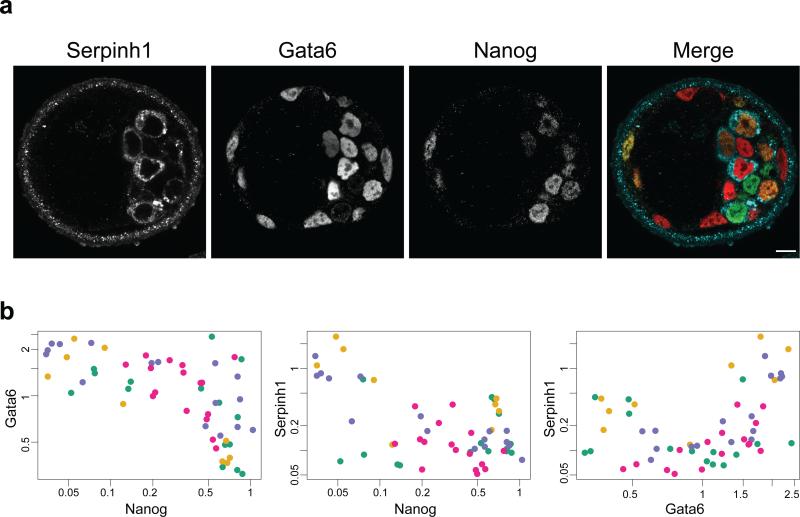
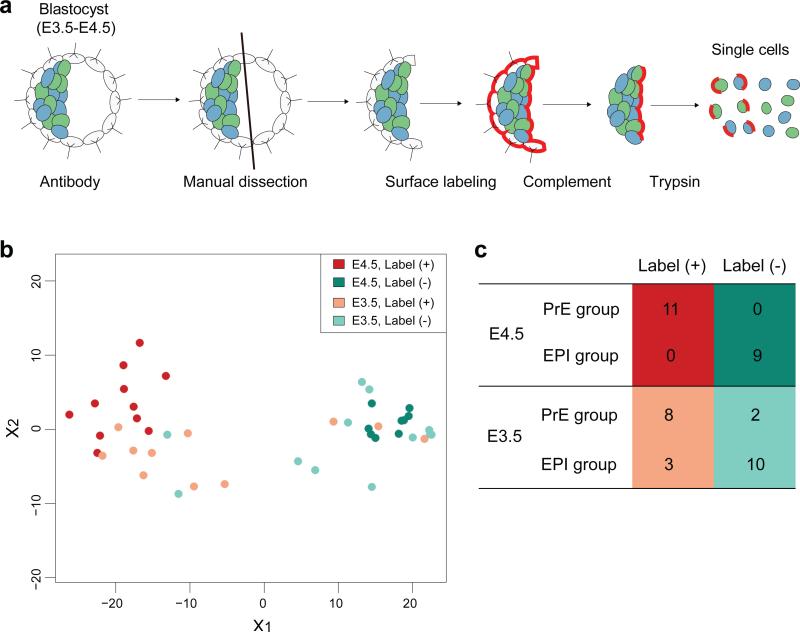
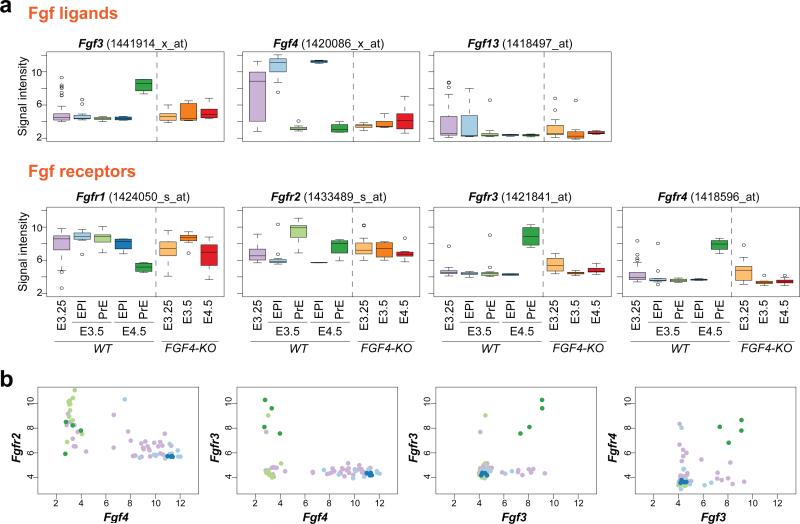
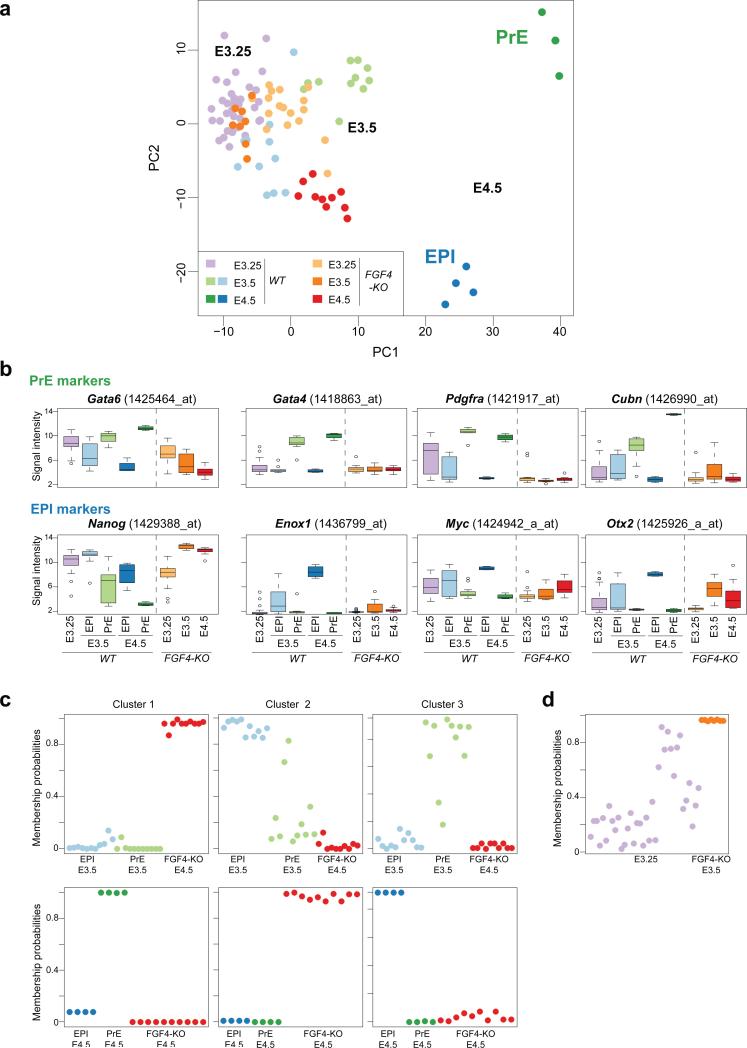
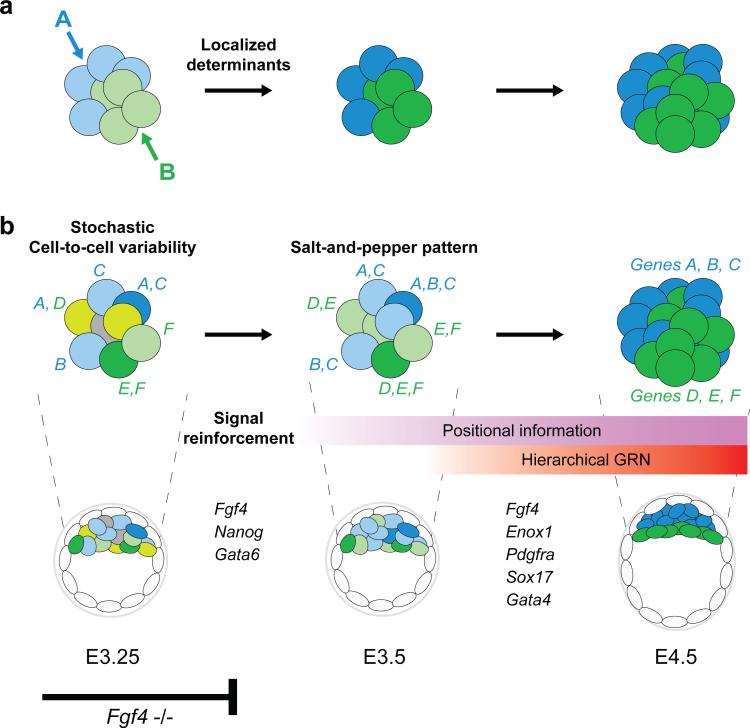
It is now recognized that extensive expression heterogeneities among cells precede the emergence of lineages in the early mammalian embryo. To establish a map of pluripotent epiblast (EPI) versus primitive endoderm (PrE) lineage segregation within the inner cell mass (ICM) of the mouse blastocyst, we characterized the gene expression profiles of individual ICM cells. Clustering analysis of the transcriptomes of 66 cells demonstrated that initially they are non-distinguishable. Early in the segregation, lineage-specific marker expression exhibited no apparent correlation, and a hierarchical relationship was established only in the late blastocyst. Fgf4 exhibited a bimodal expression at the earliest stage analysed, and in its absence, the differentiation of PrE and EPI was halted, indicating that Fgf4 drives, and is required for, ICM lineage segregation. These data lead us to propose a model where stochastic cell-to-cell expression heterogeneity followed by signal reinforcement underlies ICM lineage segregation by antagonistically separating equivalent cells.


Figures

Figure 1
Figure 1
Single-cell expression analysis of the lineage segregation within the inner cell mass of the mouse blastocyst. (a) Schematic of the experimental method of single-cell isolation and gene expression profiling. cDNA was processed, stored and used for qPCR and microarray analyses. (b) Gene expression profiles of 137 cells isolated from the ICM at E3.25 (33 cells from 4 embryos), E3.5 (43 cells from 3 embryos) and E4.5 (61 cells from 3 embryos) analysed by qPCR. Each bar represents the expression of indicated genes in individual cells, with the same horizontal positions representing the same cells. Red line indicates the minimal level of gene expression detectable quantitatively (20 copies). (c) Principal component analysis (PCA) plot of the microarray expression profiles characterizing the relative position of individual cells from blastocysts (66 cells including 36 cells from 6 embryos at E3.25, 22 cells from 3 embryos at E3.5, and 8 cells from one embryo at E4.5) in a map of lineage segregation. Note that the PCA was performed in an unsupervised manner, i.e., without information on cell stage or lineage. (d) Schematic of the cluster stability analysis to identify subpopulations among cells. If distinguishable subgroups exist (marked in green and blue in the right scheme), repeated bootstrap-sampled unsupervised clustering segregates them reproducibly (right panel). If repeated clustering produces incongruent results, no stably identifiable subgroups exist (left, grey). (e) Results of the cluster stability analysis (using a version of k-means clustering, partitioning around medoids, with k = 2) for E3.25 and E3.5 cells. (Left) Membership probabilities of each cell in the consensus clustering. Each dot represents the relative frequency at which a cell was assigned to one of the two consensus clusters in 250 random samplings. For E3.5, these frequencies had a bimodal distribution at 0 and 1, while for E3.25, they were diffuse. (Right) Boxplot of cluster agreement score of 250 random samplings with the consensus. Consistently high agreement was seen for E3.25, whereas the score was close to random expectation for E3.25. The agreement score distributions between E3.25 and E3.5 were significantly different (p = 2 × 10⁻¹⁶, Wilcoxon test).
Figure 2
Figure 2
Correlation and hierarchy of gene expression is progressively established during lineage segregation within the ICM of the mouse blastocyst. (a) Expression of lineage-specific markers analysed by single-cell qPCR (137 cells in total including 33 cells from 4 embryos at E3.25, 43 cells from 3 embryos at E3.5, and 61 cells from 3 embryos at E4.5). Genes marked in red represent newly identified lineage markers. Each column represents the expression profile of an individual cell, with the color-code at the right bottom representing the estimated copy number for each gene. (b) Progressive upregulation of newly identified PrE differentiation marker genes. Box plots showing the expression level for each gene, collected for each stage from single-cell qPCR analysis (137 cells in total including 33 cells from 4 embryos for E3.25, 21 and 22 cells from 3 embryos for E3.5 EPI and PrE, and 30 and 31 cells from 3 embryos for E4.5 EPI and PrE, respectively). (c) Hierarchical relationships of the activation of PrE differentiation marker genes. Each column represents one cell, dark blue indicates upregulation of genes during the transition from E3.25 to E3.5 (left) or from E3.5 to E4.5 (right). Upregulation during a transition was operationally defined as a gene expression value more than the midpoint of the average expression levels for E3.25 and E3.5 cells, or for E3.5 and E4.5 cells, respectively (see Methods and Supplementary Fig. S3 and S4 for detailed method). Hierarchy in gene activation was significantly stronger at the E3.5 to E4.5 transition than at the E3.25 to E3.5 transition (p = 2 × 10⁻¹⁶, t-test).
Figure 3
Figure 3
Heterogeneity in protein expression level of the EPI and PrE markers. (a) A single-section immunofluorescence image of the E3.5 blastocyst simultaneously stained for Serpinh1 (a newly identified PrE marker), Gata6 and Nanog. In the merged image, Serpinh1, Gata6 and Nanog are labelled in blue, red and green, respectively. Scale bar; 10 μm. (b) Quantitative plots showing the normalized mean fluorescent intensity of Gata 6 relative to Nanog, Serpinh1 relative to Nanog, and Serpinh1 relative to Gata6. Each dot represents one blastomere with different colours representing different embryos (56 cells from 4 embryos at E3.5). The expression intensity value of the respective gene is normalized against the level of DAPI signal. The average background fluorescence level is 0.032, 0.001 and 0.027 for Gata6, Nanog and Serpinh1, respectively. Correlation of protein expression levels is evident between Nanog and Gata6, Nanog and Serpinh1, and Gata6 and Serpinh1 (r = -0.62 and p = 3 × 10⁻⁷, r = - 0.46 and p = 3 × 10⁻⁴, and r = 0.46 and p = 3 × 10⁻⁴, respectively; Pearson's correlation coefficient).
Figure 4
Figure 4
Cell position influences gene expression. (a) Schematic of the method to label the cells on the surface of the ICM facing the blastocyst cavity. Immunosurgery was combined with manual bisection and isolation of the embryonic half of the blastocyst, followed by fluorescent labelling of the exposed surface cell layer (see Methods for details). (b) Multi-dimensional scaling plot of the labelled and non-labelled E3.5 and E4.5 inner cells, based on the expression of 10 highly variable genes, as identified from the E3.5 and 4.5 microarray data (Cotl1, Cth, Cubn, Fgf4, Lama1, Morc1, Pdgfra, Sepinh1, Sox17, Srgn), and quantified by additional single-cell qPCR measurements (43 cells in total including 23 cells from 6 embryos at E3.5, and 20 cells from 2 embryos at E4.5). (c) Number of label positive and negative cells in PrE and EPI groups, in which the lineage identity is assigned by marker gene expressions. Clear segregation of the PrE and EPI cells at E4.5 indicates that this labelling method can clearly distinguish the PrE cells from the EPI cells in the E4.5 blastocyst. In E3.5, label positive cells are strongly enriched in the PrE group (odds ratio 12, p = 0.01, Fisher's exact test).
Figure 5
Figure 5
Comprehensive characterisation of expression of Fgf signalling components in the early mouse embryo. (a) Box plots showing the mRNA expression levels of Fgf ligands and receptors detectable in the early mouse embryo, collected for each stage from single-cell microarray analysis (66 WT cells including 36 cells from 6 embryos for E3.25, 11 and 11 cells from 3 embryos for E3.5 EPI and PrE, and 4 and 4 cells from one embryo for E4.5 EPI and PrE cells, respectively; and 35 Fgf4−/− cells including 17 cells from 3 embryos for E3.25, 8 cells from one embryo for E3.5 and 10 cells from one embryo for E4.5). Those Fgf ligands whose expression level is negligible are shown in Supplementary Fig. S5. (b) Scatter plots with each dot representing the mRNA expression levels of specific Fgf ligand and receptor pairs in one blastomere. The colour code of the dot is the same throughout this study, shown in inset of Fig.1c, with pink representing E3.25 cells, light blue and green E3.5 EPI and PrE cells, and blue and green E4.5 EPI and PrE cells, respectively. Those with statistically significant correlation (positive or negative) are shown (r = -0.77, p = 7 × 10⁻⁷ (Fgf4 vs. Fgfr2); r = -0.42, p = 2 × 10⁻² (Fgf4 vs. Fgfr3); r = 0.82, p = 4 × 10⁻⁸ (Fgf3 vs. Fgfr3); r = 0.76, p = 1 × 10⁻⁶ (Fgf3 vs. Fgfr4); Pearson's correlation coefficient).
Figure 6
Figure 6
Fgf4 is required for driving lineage segregation between EPI and PrE in the early mouse embryo. (a) PCA plot of the microarray expression profiles of Fgf4−/− cells (35 Fgf4−/− cells including 17 cells from 3 embryos for E3.25, 8 cells from one embryo for E3.5 and 10 cells from one embryo for E4.5) overlaid on the EPI versus PrE lineage map established using WT cell profile (66 WT cells including 36 cells from 6 embryos for E3.25, 11 and 11 cells from 3 embryos for E3.5 EPI and PrE, and 4 and 4 cells from one embryo for E4.5 EPI and PrE cells, respectively). Note that the position of WT cells is identical to that shown in Fig.1c and is used here as a reference map. (b) Impact of the loss of Fgf4 on the expression of lineage markers analysed by microarray. Box plots show the expression of PrE and EPI markers (including differentiation markers), collected for each stage from single-cell microarray analysis (similarly to Fig. 5a). (c) Cluster stability analysis (250 random samplings) for Fgf4−/− E4.5 cells together with WT E3.5 EPI and PrE cells (upper row), or with E4.5 EPI and PrE cells (lower row). Shown are the membership probabilities of the consensus clustering, analogous to the analysis in Fig. 1e. Unsupervised clustering faithfully recovers the grouping into WT E3.5 EPI cells, WT E3.5 PrE cells, WT E4.5 EPI cells, WT E4.5 PrE cells and Fgf4−/− E4.5 cells. (d) Cluster stability analysis (250 random samplings) for Fgf4−/− E3.5 cells together with WT E3.25 cells. Shown are the membership probabilities of the consensus clustering. The analysis demonstrates that Fgf4−/− E3.5 cells form a single, tight cluster.
Figure 7
Figure 7
Schematic model for EPI vs. PrE lineage segregation in the early mouse embryo, contrasting to mechanisms for embryo patterning in non-mammalian species. (a) In many non-mammalian species, localized determinants play a key role in embryonic patterning. (b) In the ICM of the mouse blastocyst, EPI and PrE lineages are progressively segregated within a cohort of initially equivalent cells. Cell-to-cell variability generated by stochastic onset of gene expression (genes A, B, C represent the lineage marker for blue cells, whereas D, E, F for green cells) is progressively enhanced by signalling activities and feedbacks as well as cell-cell interactions, and forms salt and pepper pattern, with emerging two populations. This process eventually leads to establishing two distinct cell lineages (blue or green cells) with specific gene regulatory networks in the context of positional information. In the absence of Fgf4, reinforcement by the signalling cascade may fail and lineage segregation is halted without differentiation into either of the two lineages.

Comment in

Similar articles

Cited by

References

    1. Rossant J, Tam PP. Blastocyst lineage formation, early embryonic asymmetries and axis patterning in the mouse. Development. 2009;136:701–713. - PubMed
    1. Chazaud C, Yamanaka Y, Pawson T, Rossant J. Early lineage segregation between epiblast and primitive endoderm in mouse blastocysts through the Grb2-MAPK pathway. Developmental cell. 2006;10:615–624. - PubMed
    1. Plusa B, Piliszek A, Frankenberg S, Artus J, Hadjantonakis AK. Distinct sequential cell behaviours direct primitive endoderm formation in the mouse blastocyst. Development. 2008;135:3081–3091. - PMC - PubMed
    1. Schrode N, et al. Anatomy of a blastocyst: Cell behaviors driving cell fate choice and morphogenesis in the early mouse embryo. Genesis. 2013;51:219–233. - PMC - PubMed
    1. Grabarek JB, et al. Differential plasticity of epiblast and primitive endoderm precursors within the ICM of the early mouse embryo. Development. 2012;139:129–139. - PMC - PubMed

Publication types

MeSH terms