. 2014 Mar;19(3):319-34.
doi: 10.1007/s00775-013-1068-3. Epub 2013 Nov 30.

Nickel binding properties of Helicobacter pylori UreF, an accessory protein in the nickel-based activation of urease

Affiliations

Nickel binding properties of Helicobacter pylori UreF, an accessory protein in the nickel-based activation of urease

Barbara Zambelli et al. J Biol Inorg Chem. 2014 Mar.

Abstract

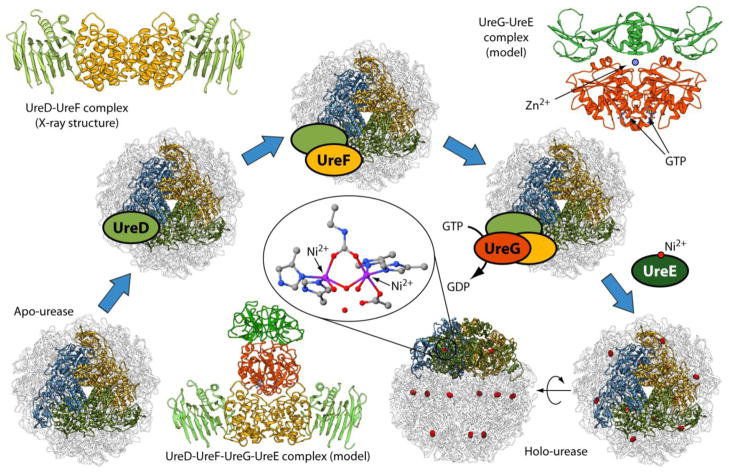
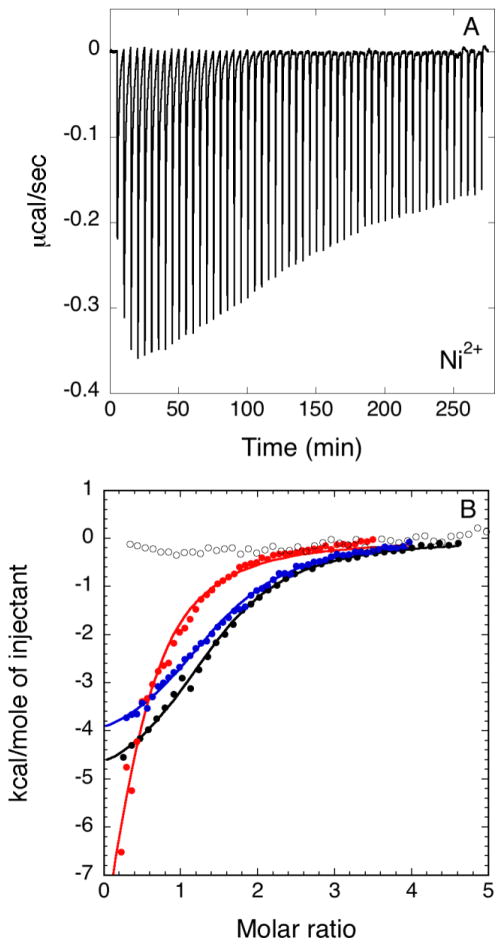
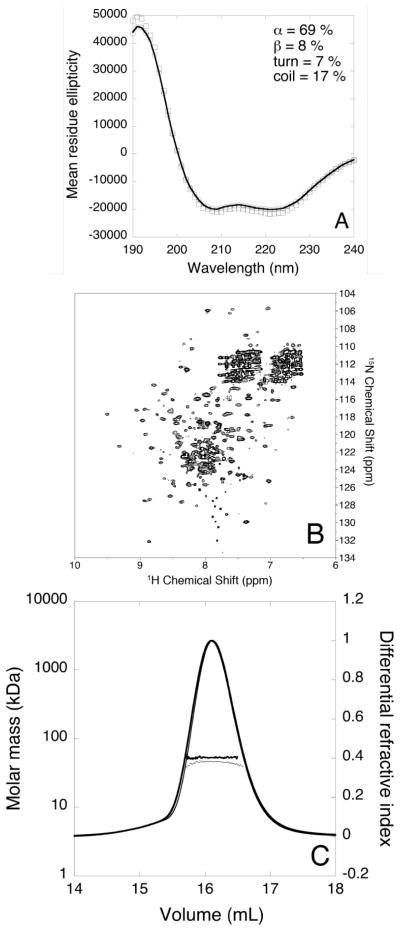
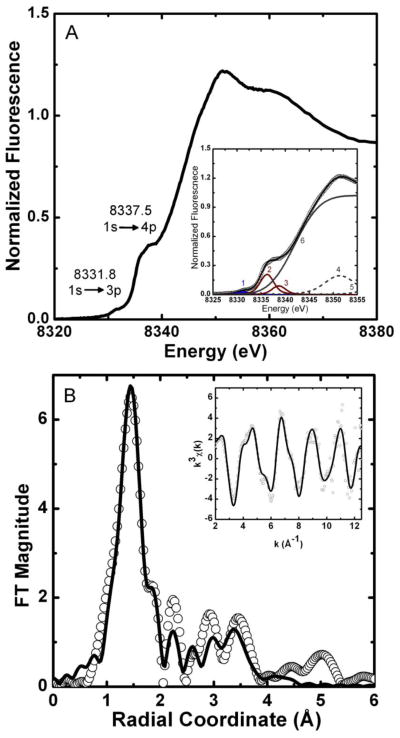
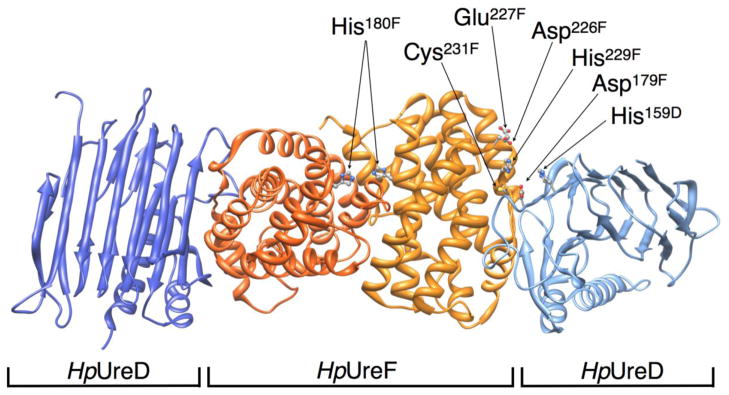
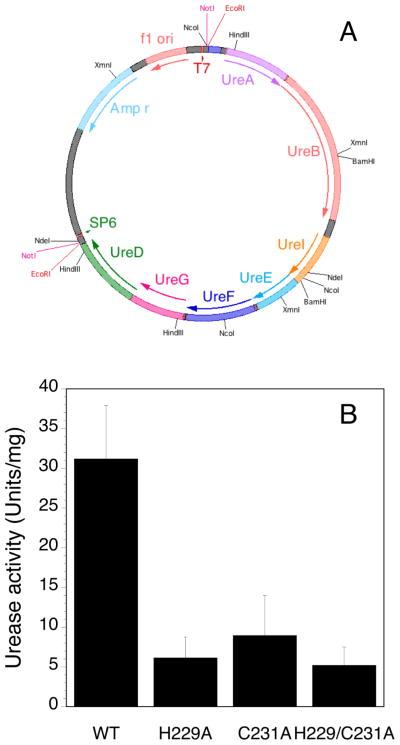
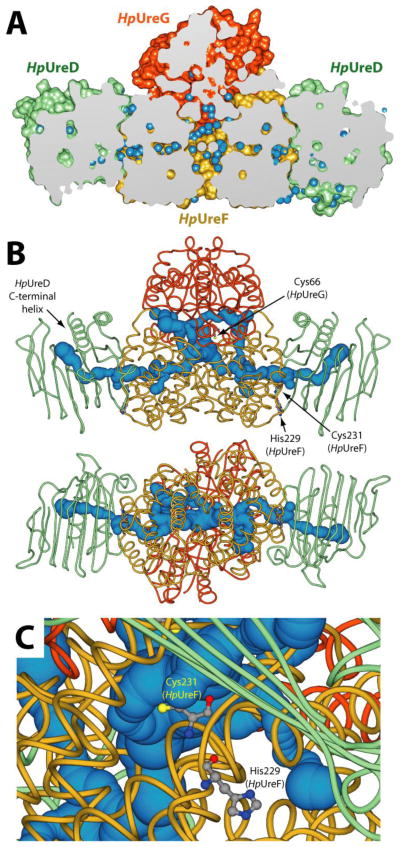
Helicobacter pylori UreF (HpUreF) is involved in the insertion of Ni(2+) in the urease active site. The recombinant protein in solution is a dimer characterized by an extensive α-helical structure and a well-folded tertiary structure. HpUreF binds two Ni(2+) ions per dimer, with a micromolar dissociation constant, as shown by calorimetry. X-ray absorption spectroscopy indicated that the Ni(2+) ions reside in a five-coordinate pyramidal geometry comprising exclusively N/O-donor ligands derived from the protein, including one or two histidine imidazole and carboxylate ligands. Binding of Ni(2+) does not affect the solution properties of the protein. Mutation to alanine of His229 and/or Cys231, a pair of residues located on the protein surface that interact with H. pylori UreD, altered the affinity of the protein for Ni(2+). This result, complemented by the findings from X-ray absorption spectroscopy, indicates that the Ni(2+) binding site involves His229, and that Cys231 has an indirect structural role in metal binding. An in vivo assay of urease activation demonstrated that H229A HpUreF, C231A HpUreF, and H229/C231 HpUreF are significantly less competent in this process, suggesting a role for a Ni(2+) complex with UreF in urease maturation. This hypothesis was supported by calculations revealing the presence of a tunnel that joins the Cys-Pro-His metal binding site on UreG and an opening on the UreD surface, passing through UreF close to His229 and Cys231, in the structure of the H. pylori UreDFG complex. This tunnel could be used to transfer nickel into the urease active site during apoenzyme-to-holoenzyme activation.


Figures

Figure 1
Figure 1
Scheme of the Helicobacter pylori urease activation process starting from the apo-enzyme and leading to holo-urease. The ribbon diagrams show the structure of Helicobacter pylori urease in its [(αβ)3]4 quaternary structure; each blue, gold and green highlighted chains represent one (αβ) heterodimer, and they all together reveal the similarity of the (αβ)3 moiety in this urease with the (αβγ)3 quaternary structure of other bacterial ureases such as that of Sporosarcina pasteurii and Klebsiella aerogenes. The details of the Ni2+ ions coordination environment in the active site are shown in the central inset. The crystal structures or models of the various protein complexes involved in the process are also shown as ribbon diagrams: HpUreD (light green), HpUreF (orange), HpUreG (red) and HpUreE (dark green).
Figure 2
Figure 2
Representative plots of titration data showing the thermal effect of 55 × 5 μL injections of Ni2+ onto a solution of HpUreF. In A, raw heat data are shown for wild type HpUreF. In B, integrated heat data of wild type HpUreF (black filled circles), H229A HpUreF (blue filled circles) mutant, C231A HpUreF mutant (red filled circles) and H229A/C231A HpUreF double mutant (hollow circles) are indicated together with the best fits (solid lines).
Figure 3
Figure 3
(A) Far-UV CD spectrum of HpUreF in 20 mM phosphate buffer in the absence (hollow circles) and in the presence of two equivalents of Ni2+ (hollow squares) per protein dimer. The best fit calculated for apo-HpUreF is represented as a solid line. Mean residue ellipticity units are degrees cm2 dm−1 residue−1; (B) Representative 1H-15N TROSY-HSQC spectrum of apo-HpUreF acquired at 900 MHz and 298 K; (C) Plot of the molar mass distribution of HpUreF in the absence (thick dots and line) and in the presence (thin dots and line) of two equivalents of Ni2+ per protein dimer. The solid lines indicate the Superdex-75 elution profiles monitored by the refractive index detector, while the dots are the weight-averaged molecular masses for each slice, measured every second.
Figure 4
Figure 4
HpUreF Ni K-edge XAS. (A) XANES spectrum; the inset reports the data (circles) vs. the fitted sum (line) from the individual XANES spectrum pre-edge features (peaks 1 to 5; see SI-1). (B) Fourier-transformed EXAFS spectrum (circles) and best fit (line), shown without phase correction (FT window = 2–12.5 Å−1). Inset: k3-weighted unfiltered EXAFS spectrum and best fit. The fit shown is for the (N/O)1(Namide)1(NHis)1(OCO2)2 model from Table 1.
Figure 5
Figure 5
Ribbon scheme of the H. pylori UreD-UreF complex (PDB code 3SF5), highlighting His180, His229, Cys231 on UreF and the nearby residues potentially involved in metal binding and trafficking. UreF monomers are depicted in dark and light orange, UreD monomers in dark and light blue.
Figure 6
Figure 6
(A) Scheme of the pGEM::ureOP plasmid containing the 6.1 kbp H. pylori urease operon utilized for in cell studies; (B) Urease activity measured for the soluble cellular extract of E. coli BL21(DE3) cells transformed with the pGEM::ureOP plasmid and with its H229A-HpUreF, C231A-HpUreF and H229A/C231A-HpUreF mutants. The enzymatic activities, measured in duplicate on two different cultures, are normalized to the total protein content of bacterial lysate.
Figure 7
Figure 7
(A) Longitudinal section of the solvent excluded surface of the apo UreG2-UreF2-UreD2 crystal structure from H. pylori 26695 strain (PDB: 4HI0) [55]. HpUreD, HpUreF and HpUreG chains are colored as in Figure 1. Water molecules are depicted as light blue spheres. (B) Channels departing from the buried CPH motif calculated using the program CAVER 3.0 [53] and the HpUreG2-UreF2-UreD2 crystal structure (PDB: 4HI0) [55]. Protein backbones are reported in cartoons colored as in Figure 1, while the tunnels are reported as light blue spheres. The radius of the sphere is indicative of the thickness of the tunnel. The HpUreG Cys66 residues, as well as HpUreF His229 and Cys231, are reported as balls-and-sticks colored accordingly to atom type. In the bottom panel the structure is rotated by 90° along the horizontal axis. (C) Detail of the position of HpUreF His229 and Cys231 with respect of the calculated tunnel. Protein backbones and the tunnel are colored as in panel B.

References

    1. Polk DB, Peek RM., Jr Nat Rev Cancer. 2010;10:403–414. - PMC - PubMed
    1. Slonczewski JL, Fujisawa M, Dopson M, Krulwich TA. Adv Microb Physiol. 2009;55:1–79. - PubMed
    1. Mobley HL, Island MD, Hausinger RP. Microbiol Rev. 1995;59:451–480. - PMC - PubMed
    1. Krajewska B. J Mol Catal B-Enzym. 2009;59:9–21.
    1. Jabri E, Karplus PA. Biochemistry. 1996;35:10616–10626. - PubMed

Publication types

LinkOut - more resources