. 2014 Feb;18(2):253-71.
doi: 10.1016/j.media.2013.10.012. Epub 2013 Nov 6.

Contour tracking in echocardiographic sequences via sparse representation and dictionary learning

Affiliations

Contour tracking in echocardiographic sequences via sparse representation and dictionary learning

Xiaojie Huang et al. Med Image Anal. 2014 Feb.

Erratum in

  • Med Image Anal. 2015 May;22(1):21

Abstract

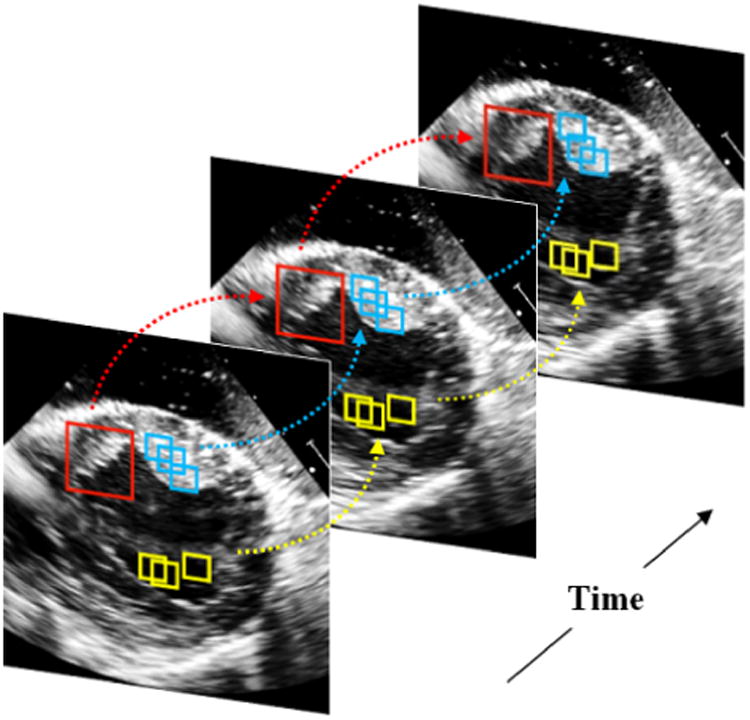
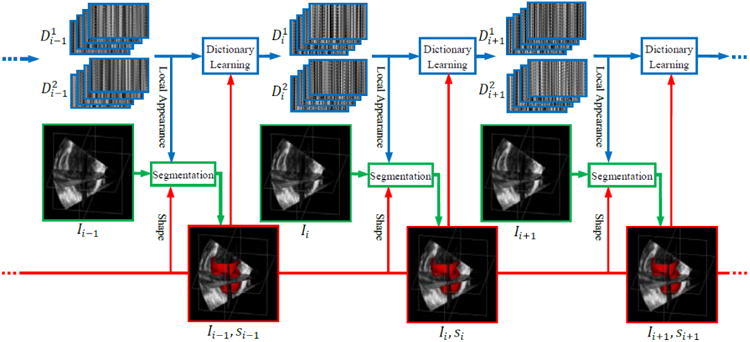
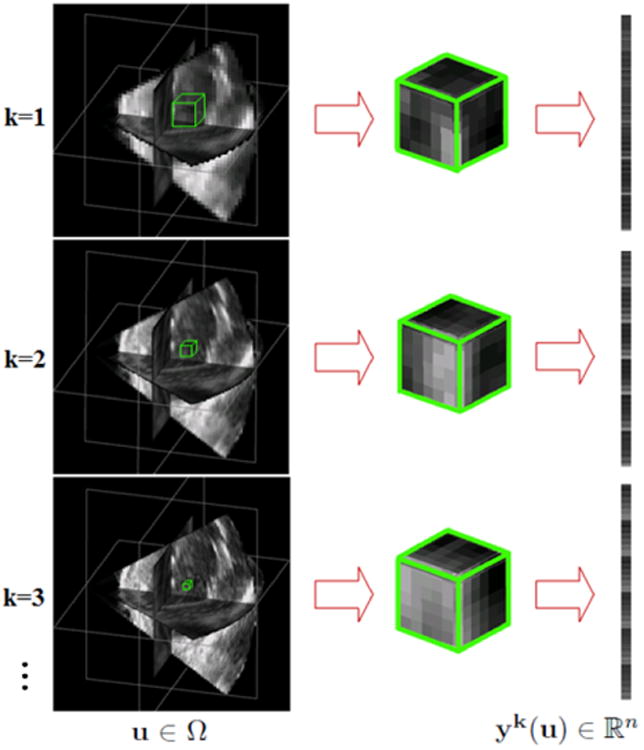
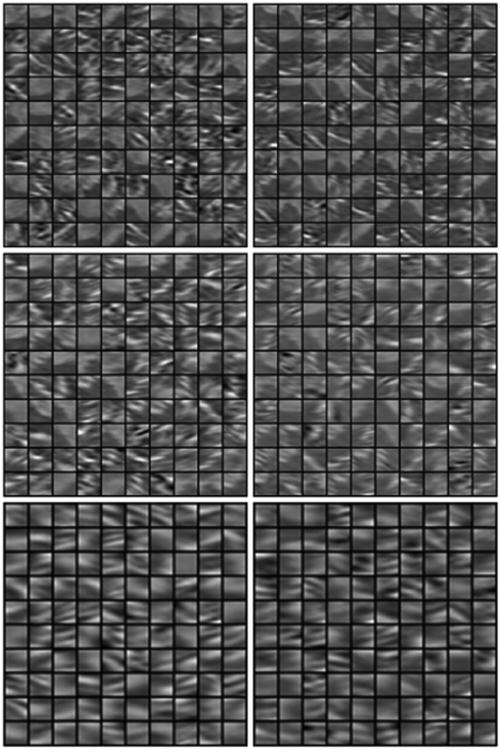
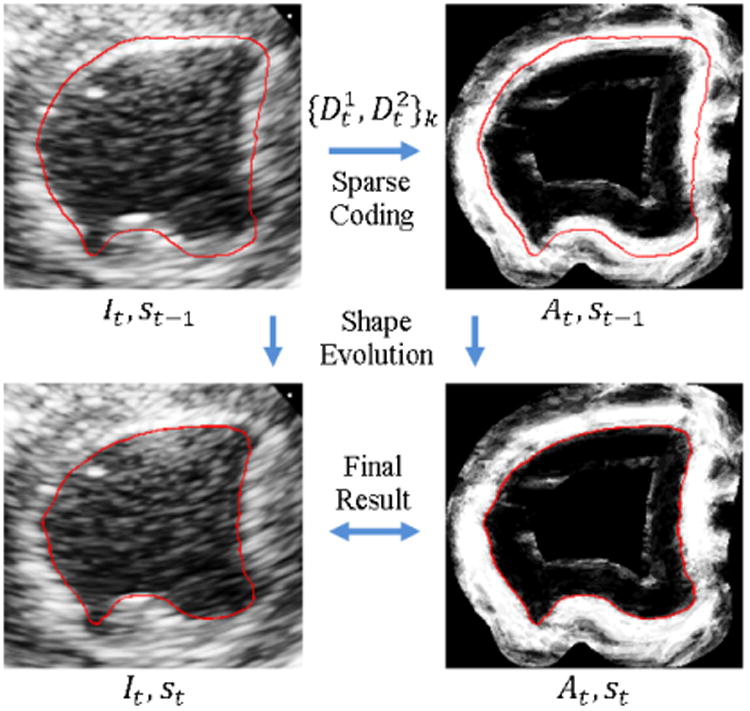
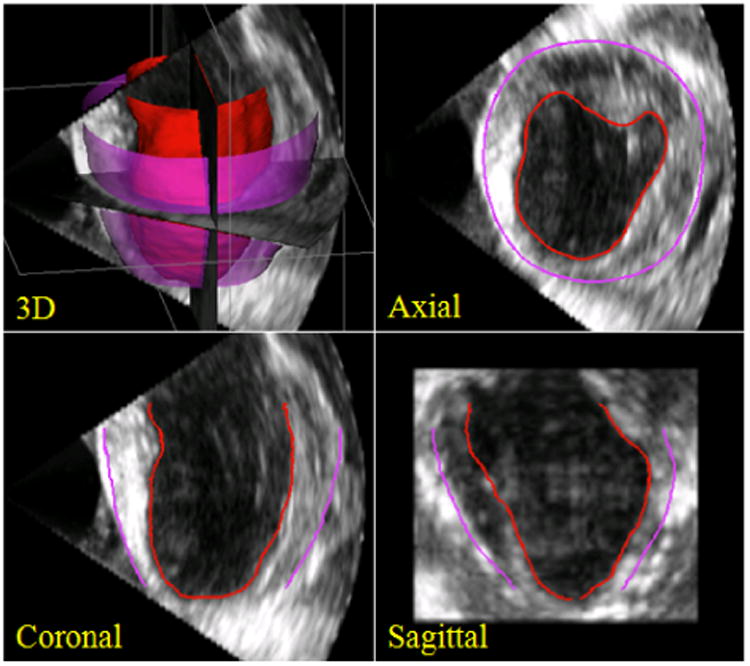
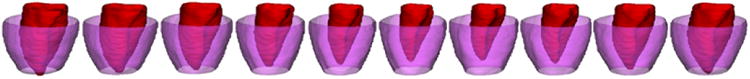
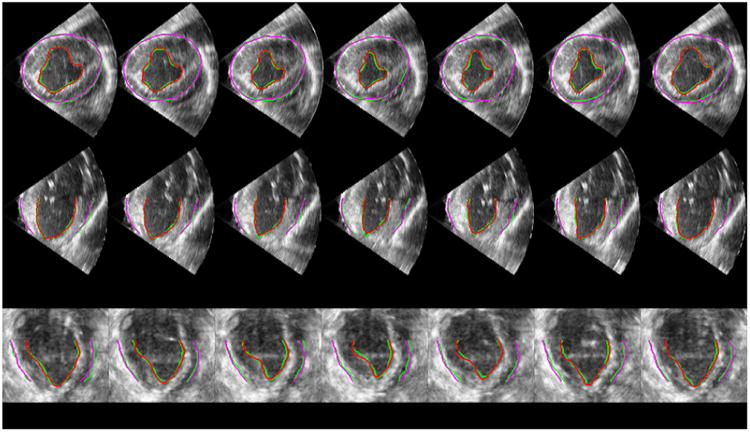
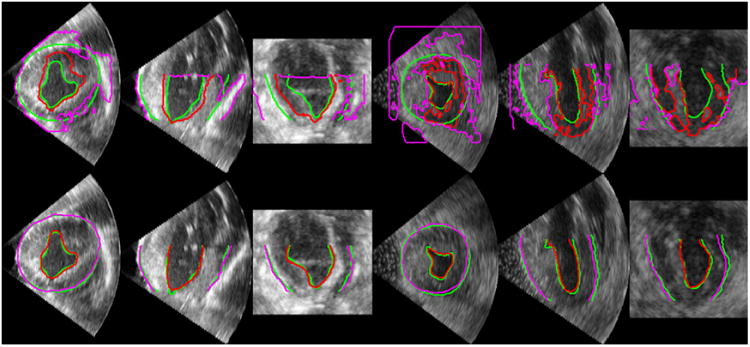
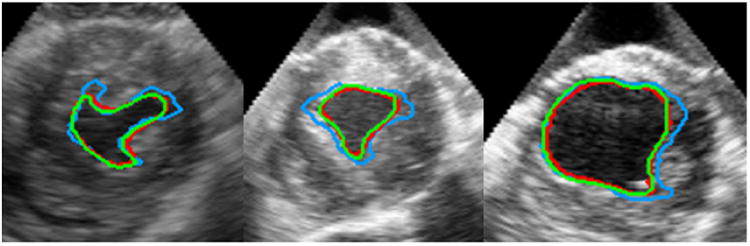
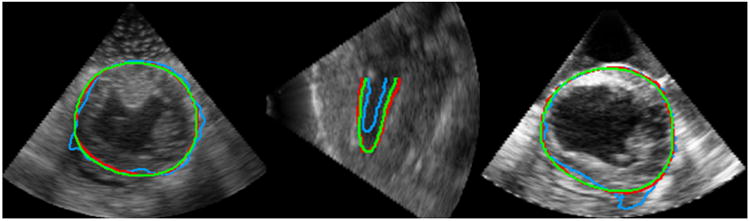
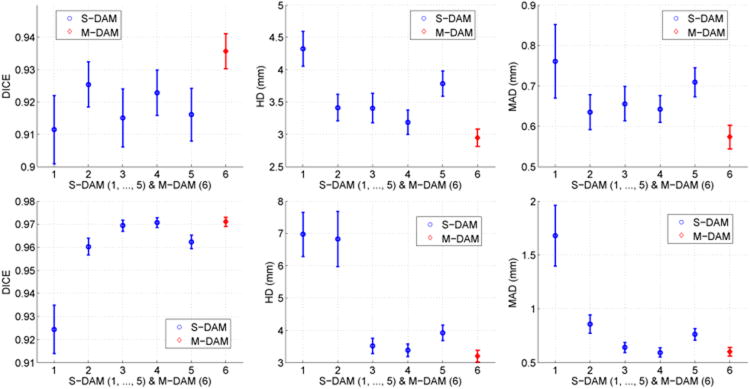
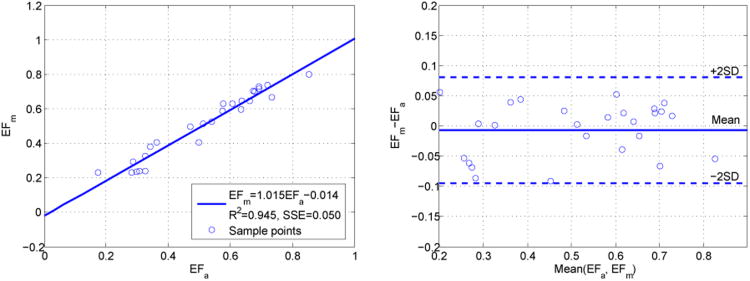
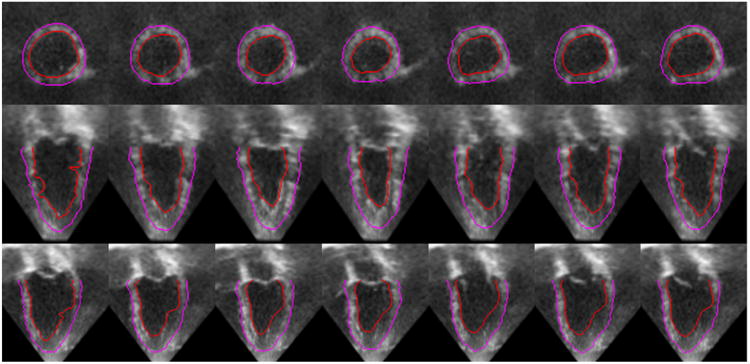
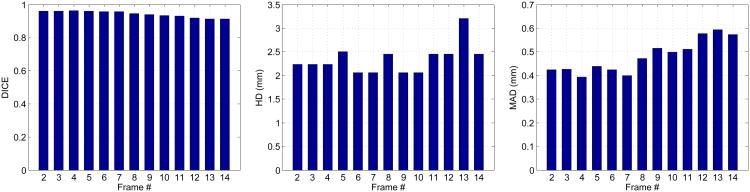
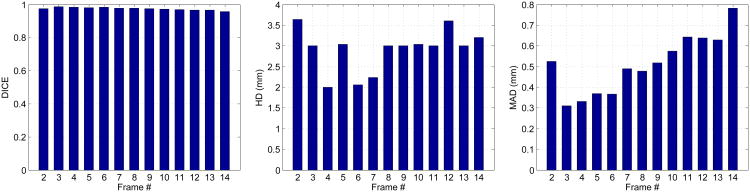
This paper presents a dynamical appearance model based on sparse representation and dictionary learning for tracking both endocardial and epicardial contours of the left ventricle in echocardiographic sequences. Instead of learning offline spatiotemporal priors from databases, we exploit the inherent spatiotemporal coherence of individual data to constraint cardiac contour estimation. The contour tracker is initialized with a manual tracing of the first frame. It employs multiscale sparse representation of local image appearance and learns online multiscale appearance dictionaries in a boosting framework as the image sequence is segmented frame-by-frame sequentially. The weights of multiscale appearance dictionaries are optimized automatically. Our region-based level set segmentation integrates a spectrum of complementary multilevel information including intensity, multiscale local appearance, and dynamical shape prediction. The approach is validated on twenty-six 4D canine echocardiographic images acquired from both healthy and post-infarct canines. The segmentation results agree well with expert manual tracings. The ejection fraction estimates also show good agreement with manual results. Advantages of our approach are demonstrated by comparisons with a conventional pure intensity model, a registration-based contour tracker, and a state-of-the-art database-dependent offline dynamical shape model. We also demonstrate the feasibility of clinical application by applying the method to four 4D human data sets.

Keywords: Contour tracking; Dictionary learning; Echocardiography; Segmentation; Sparse representation.


Figures

Figure 1
Figure 1
Spatio-temporal coherence of local image appearance at different scales. Local images in the same color present similar appearance. The arrows point out the temporal coherence of local image appearance.
Figure 2
Figure 2
Dynamical dictionary updating interlaced with sequential segmentation. Ii is the image of frame i. si is the segmentation of frame i. Dij represents multiscale appearance dictionaries for class j in frame i.
Figure 3
Figure 3
Construction of multiscale appearance vectors. From top to bottom, the images are ordered from coarse to fine resolutions and the physical sizes of the blocks vary from large to small. yk(u) is an appearance vector for voxel u∈Ω at scale k.
Figure 4
Figure 4
Examples of learned appearance dictionaries at different scales for the two local appearance classes inside and outside the endo-cardial border. The left (right) column from top to bottom represents three dictionaries from coarser scale to finer scale for the outside (inside) class. The dictionaries in the same row are at the same scale. The true physical size of the finer scale dictionary atoms is smaller than the coarser scale dictionary atoms.
Figure 5
Figure 5
The procedure of region-based level set segmentation of a current frame given appearance dictionary prediction {Dt1,Dt2}k. It is the image of frame t. st is the segmentation of frame t. At is the appearance discriminant.
Figure 6
Figure 6
A typical example of 3D segmentations by our algorithm in 3D, axial slice, coronal slice, and sagittal sliceviews. Endocardial segmentations are in red and epicardial segmentations are in purple.
Figure 7
Figure 7
3D endocardial (in red) and epicardial (in purple) surfaces of frames 1, 4, 7, 10, 13, 16, 19, 22, 25, and 28 of a representative canine echocardiographic sequence segmented using our approach.
Figure 8
Figure 8
Sample axial (top row), coronal (middle row), and sagittal (bottom row) slices of a 4D image (a cardiac cycle) overlaid with our automatic segmentations (red and purple) and expert manual tracings (green). Each column represents a frame at a time point of the cardiac cycle. From left to right the frames are in chronological order with the two ends representing ED frames.
Figure 9
Figure 9
Comparisons of segmentation results by the Rayleigh model (top row) and our DAM (bottom row). Green: Manual segmentation. Red: Automatic endocardial segmentation. Purple: Automatic epicardial segmentation.
Figure 10
Figure 10
Comparisons of segmentation results by nonrigid registration and our DAM. Green: Manual segmentation. Red: Our DAM. Blue: Non-rigid registration.
Figure 11
Figure 11
Comparisons of segmentation results by the S-DAM and the M-DAM. Green: Manual segmentation. Red: M-DAM. Blue: S-DAM.
Figure 12
Figure 12
Means and 95% confidence intervals of DICE, HD, and MAD obtained by the S-DAM (blue, scales 1,…, 5) and the M-DAM (red, 6) for endocardial segmentation(top row) and epicardial segmentation (bottom row).
Figure 13
Figure 13
Linear regression analysis (left) and Bland-Altman analysis (right) showing the agreement between the ejection fraction measurements computed from automatic segmentations (EFa) and manual segmentations (EFm).
Figure 14
Figure 14
Sample axial (top row), coronal (middle row), and sagittal (bottom row) slices of a 4D human echocardiographic image (a cardiac cycle) overlaid with segmentations. Each column represents a frame at a time point of the cardiac cycle. The contours in the first frame are manual tracings.
Figure 15
Figure 15
The effects of varying the weight κ of the appearance discriminant At. The curves represent mean values and the bars denote 95% confidence intervals.
Figure 16
Figure 16
The effects of varying the weight γ of the shape prediction Φt. The curves represent mean values and the bars denote 95% confidence intervals.
Figure 17
Figure 17
The effects of varying the sparsity factor T. The curves represent mean values and the bars denote 95% confidence intervals.
Figure 18
Figure 18
The effects o f varying the dictionary size. K denotes the ratio of the dictionary size to the dimension of the appearance vector n. The curves represent mean values and the bars denote 95% confidence intervals.
Figure 19
Figure 19
The effects of varying the number of weak learners J while S = 5. The curves represent mean values and the bars denote 95% confidence intervals.
Figure 20
Figure 20
The effects of varying the sparsity factor T. The curves represent mean values and the bars denote 95% confidence intervals.
Figure 21
Figure 21
Endocardial segmentation quality measures at different frames of an example sequence from end-diastole to end-systole.
Figure 22
Figure 22
Epicardial segmentation quality measures at different frames of an example sequence from end-diastole to end-systole.

References

    1. Aharon M, Elad M, Bruckstein A. K-SVD: An algorithm for designing overcomplete dictionaries for sparse representation. IEEE TSP. 2006;54:4311–4322.
    1. Angelini ED, Laine A, Takuma S, Holmes JW, Homma S. LV volume quantification via spatio-temporal analysis of real-time 3D echocardiography. IEEE TMI. 2001;20:457–469. - PubMed
    1. Baraniuk RG, Candes E, Elad M, Ma Y. Applications of sparse representation and compressive sensing. Proc IEEE. 2010:906–909.
    1. Bosch JG, Mitchell SC, Lelieveldt BPF, Nijland F, Kamp O, Sonka M, Reiber JHC. Automatic segmentation of echocardiographic sequences by active appearance motion models. IEEE TMI. 2002;21:1374–1383. - PubMed
    1. Boukerroui D, Noble JA, Brady M. Velocity estimation in ultrasound images: A block matching approach. IPMI'03. 2003:586–598. - PubMed

Publication types